| Param | Original file | Final file |
|---|---|---|
| Filename | modeM0/AS1A04_109T01_9000001578_10917cztM0_level2.evt | modeM0/AS1A04_109T01_9000001578_10917cztM0_level2_quad_clean.evt |
| Size (bytes) | 553,968,000 | 107,614,080 |
| Size | 528.3 MB | 102.6 MB |
| Events in quadrant A | 4,540,677 | 680,803 |
| Events in quadrant B | 4,446,624 | 697,107 |
| Events in quadrant C | 3,251,465 | 700,845 |
| Events in quadrant D | 4,037,462 | 666,667 |
| Mode SS | |||
|---|---|---|---|
| Quadrant | BADHDUFLAG | Total packets | Discarded packets |
| A | 0 | 150 | 0 |
| B | 0 | 150 | 0 |
| C | 0 | 150 | 0 |
| D | 0 | 150 | 0 |
| Mode M9 | |||
|---|---|---|---|
| Quadrant | BADHDUFLAG | Total packets | Discarded packets |
| A | 0 | 2 | 0 |
| B | 0 | 2 | 0 |
| C | 0 | 2 | 0 |
| D | 0 | 2 | 0 |
| Mode M0 | |||
|---|---|---|---|
| Quadrant | BADHDUFLAG | Total packets | Discarded packets |
| A | 0 | 18585 | 39 |
| B | 0 | 18231 | 46 |
| C | 0 | 15062 | 33 |
| D | 0 | 17218 | 59 |
| Quadrant | Total seconds | Saturated seconds | Saturation percentage |
|---|---|---|---|
| A | 7380 | 285 | 3.861789% |
| B | 7380 | 277 | 3.753388% |
| C | 7378 | 12 | 0.162646% |
| D | 7376 | 64 | 0.867679% |
Noise dominated data is calculated using 1-second bins in cleaned event files. If a bin has >2000 counts, and if more than 50% of those come from <1% of pixels, then it is considered to be noise-dominated and hence unusable.
| Quadrant | # 1 sec bins | Bins with >0 counts | Bins with >2000 counts | High rate bins dominated by noise | Noise dominated (total time) | Noise dominated (detector-on time) | Marked lightcurve |
|---|---|---|---|---|---|---|---|
| A | 7654 | 7395 | 137 | 137 | 1.79% | 1.85% | 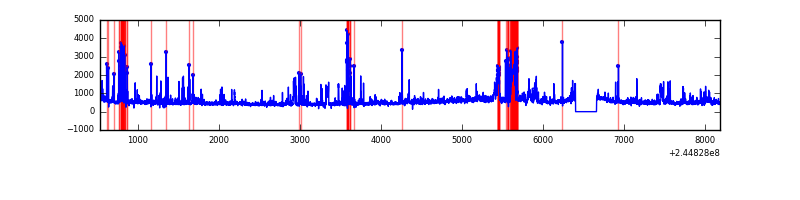 |
| B | 7654 | 7395 | 149 | 149 | 1.95% | 2.01% | 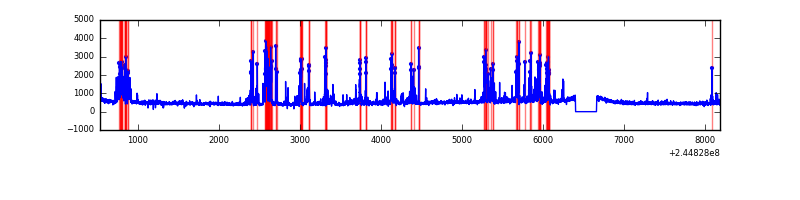 |
| C | 7654 | 7394 | 0 | 0 | 0.00% | 0.00% | 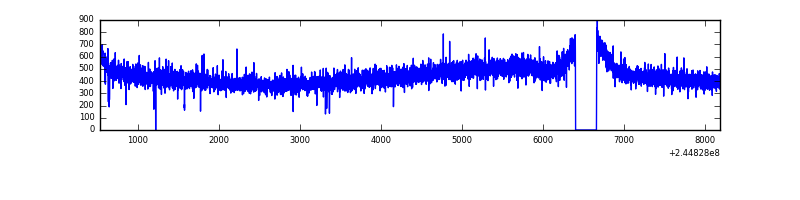 |
| D | 7654 | 7395 | 45 | 45 | 0.59% | 0.61% | 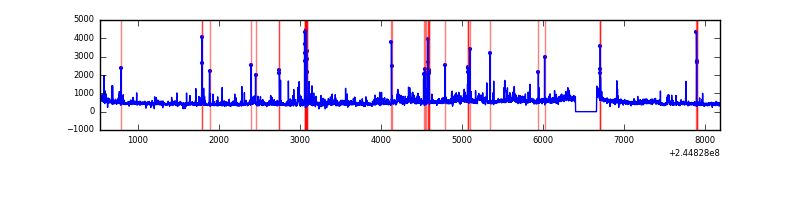 |
Top three noisy pixels from each quadrant. If the there are fewer than three noisy pixels in the level2.evt file, extra rows are filled as -1
| Pixel properties | Quadrant properties | ||||||
|---|---|---|---|---|---|---|---|
| Quadrant | DetID | PixID | Counts | Sigma | Mean | Median | Sigma |
| A | 8 | 5 | 380982 | 2189.2 | 850 | 831 | 173.6 |
| A | 15 | 174 | 281118 | 1614.11 | 850 | 831 | 173.6 |
| A | 13 | 251 | 261683 | 1502.19 | 850 | 831 | 173.6 |
| B | 4 | 239 | 935187 | 5659.6 | 858 | 836 | 165.1 |
| B | 0 | 214 | 81871 | 490.85 | 858 | 836 | 165.1 |
| B | 0 | 219 | 30150 | 177.56 | 858 | 836 | 165.1 |
| C | 13 | 61 | 6278 | 28.11 | 831 | 834 | 193.6 |
| C | 8 | 222 | 4469 | 18.77 | 831 | 834 | 193.6 |
| C | 8 | 128 | 3250 | 12.48 | 831 | 834 | 193.6 |
| D | 1 | 52 | 576423 | 2858.6 | 825 | 798 | 201.4 |
| D | 5 | 222 | 146486 | 723.5 | 825 | 798 | 201.4 |
| D | 13 | 104 | 74074 | 363.89 | 825 | 798 | 201.4 |
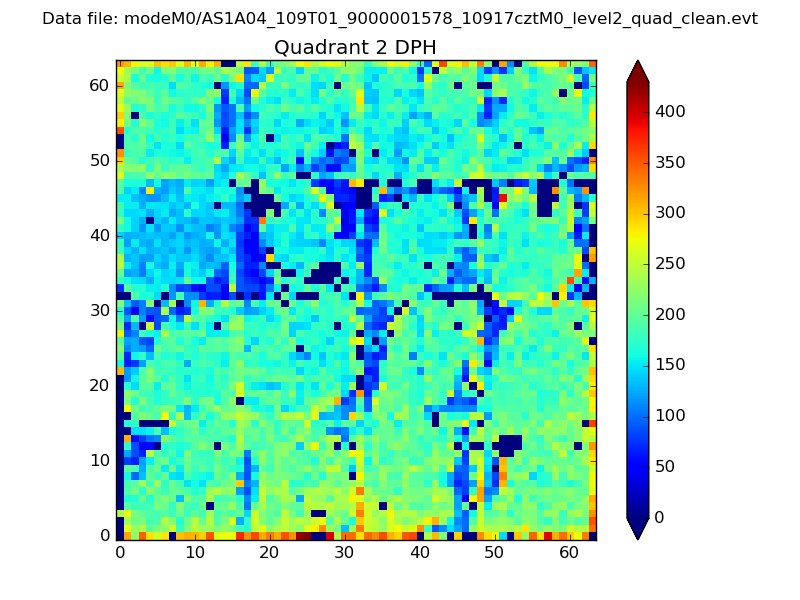
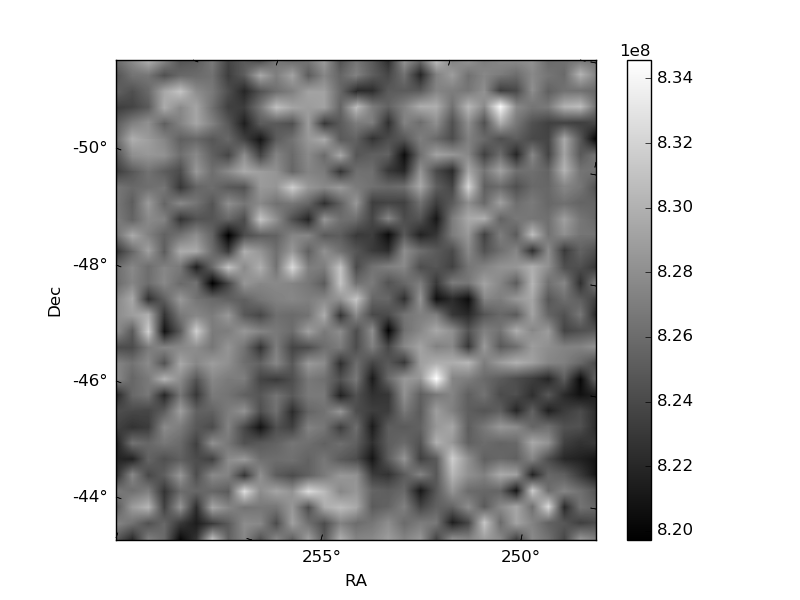
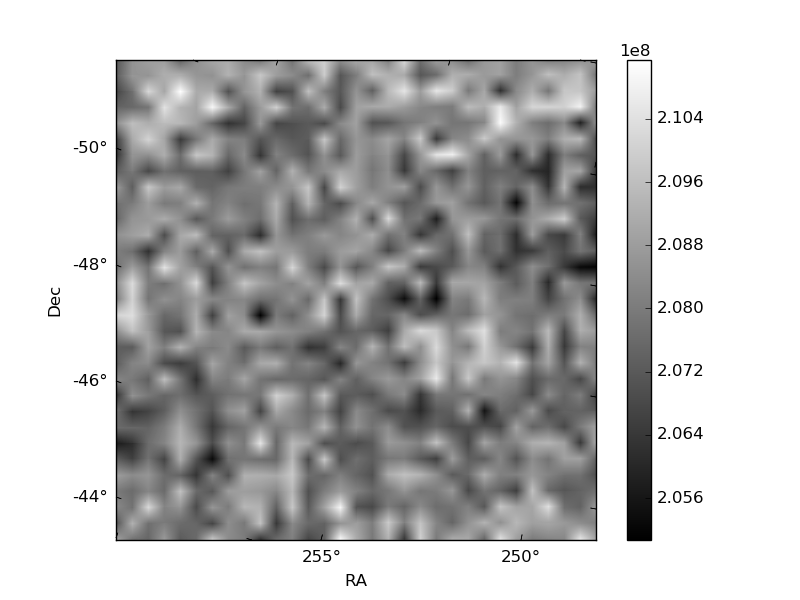
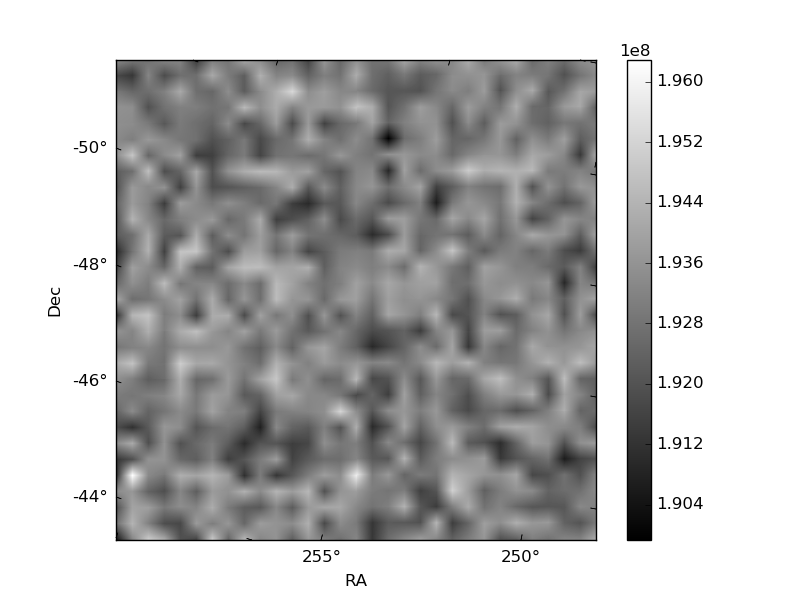
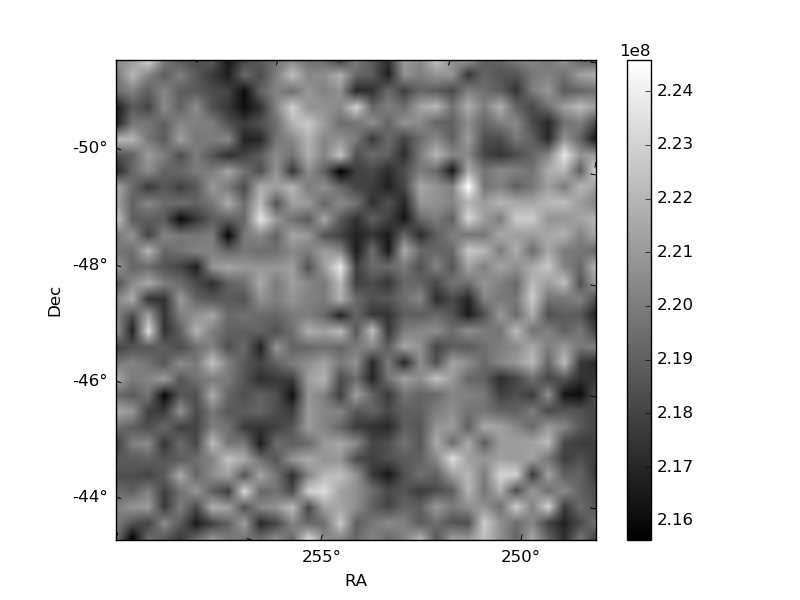
Histogram calculated using DETX and DETY for each event in the final _common_clean file
| Quadrant A | 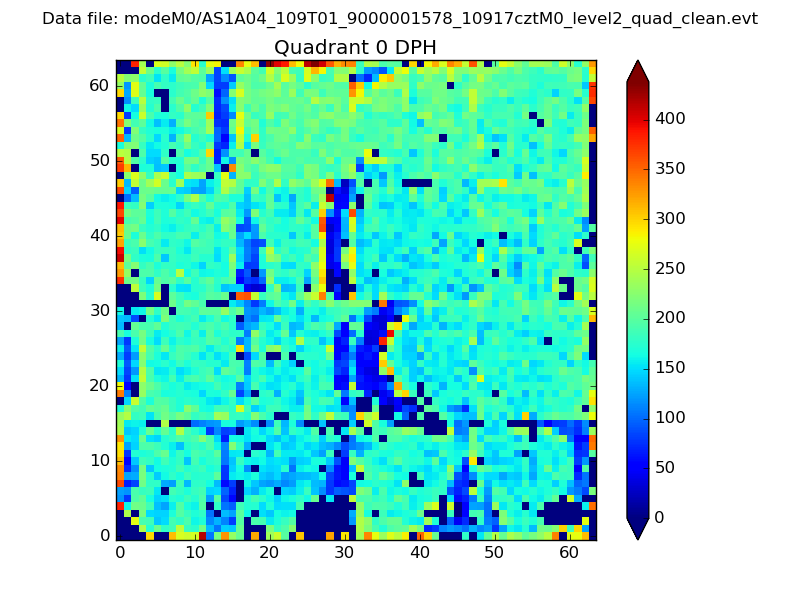 |
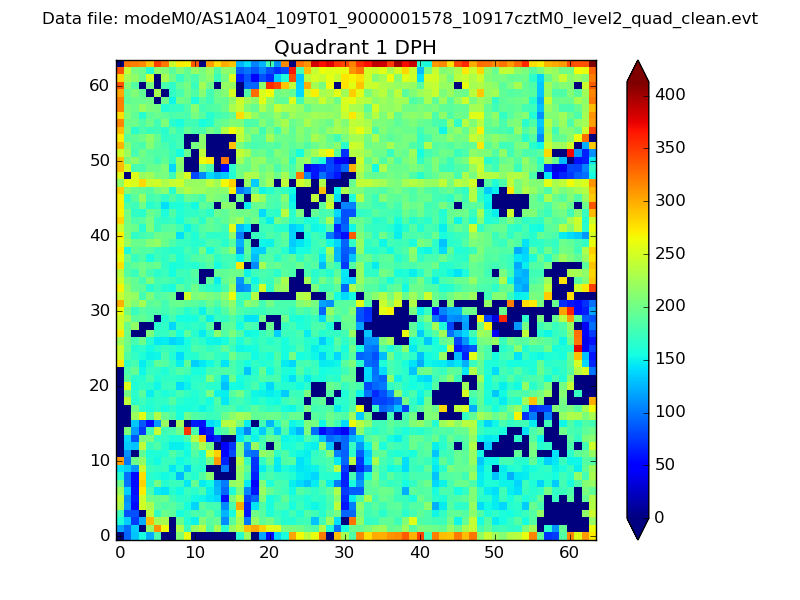 |
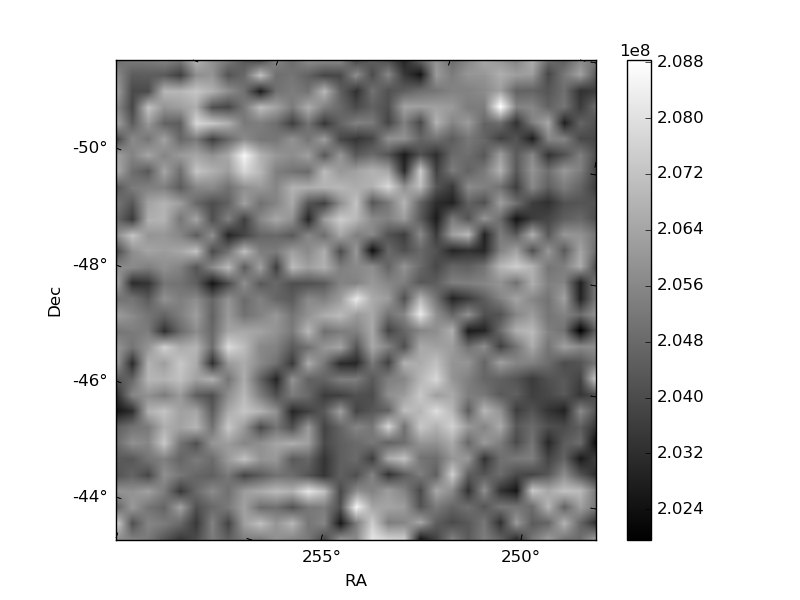
Quadrant B |
|---|---|---|---|
| Quadrant D | 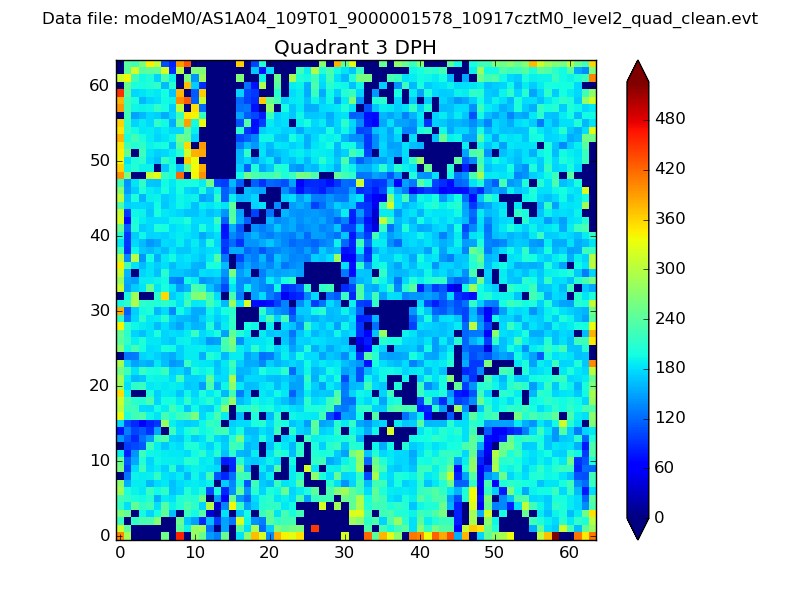 |
 |
Quadrant C |
| Plot type | Count rate plots | Images |
|---|---|---|
| Comparison with Poisson distribution Blue bars denote a histogram of data divided into 1 sec bins. Red curve is a Poisson curve with rate = median count rate of data. |
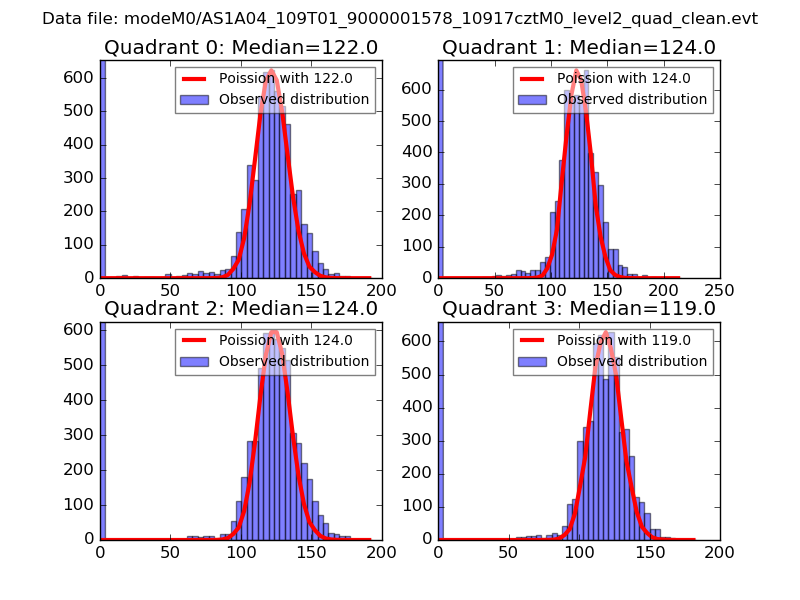 |
 |
| Quadrant-wise count rates Data is divided into 100 sec bins |
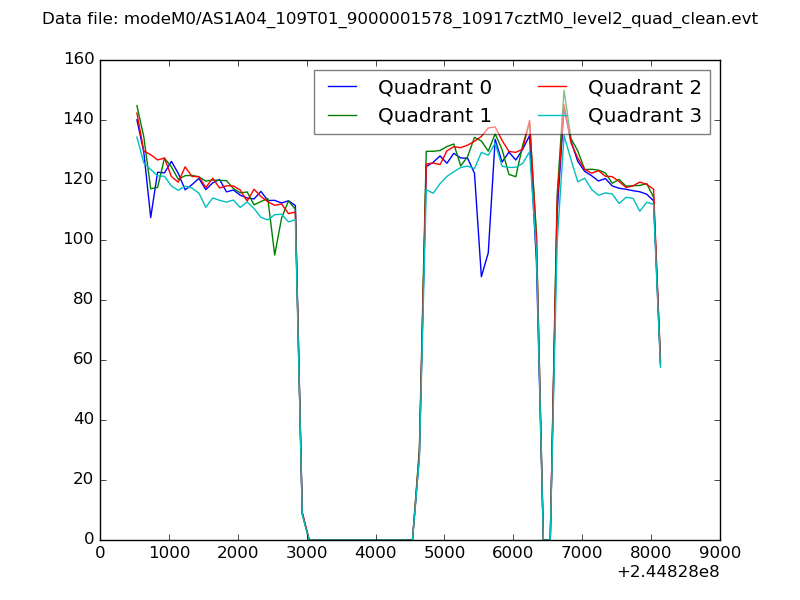 |
|
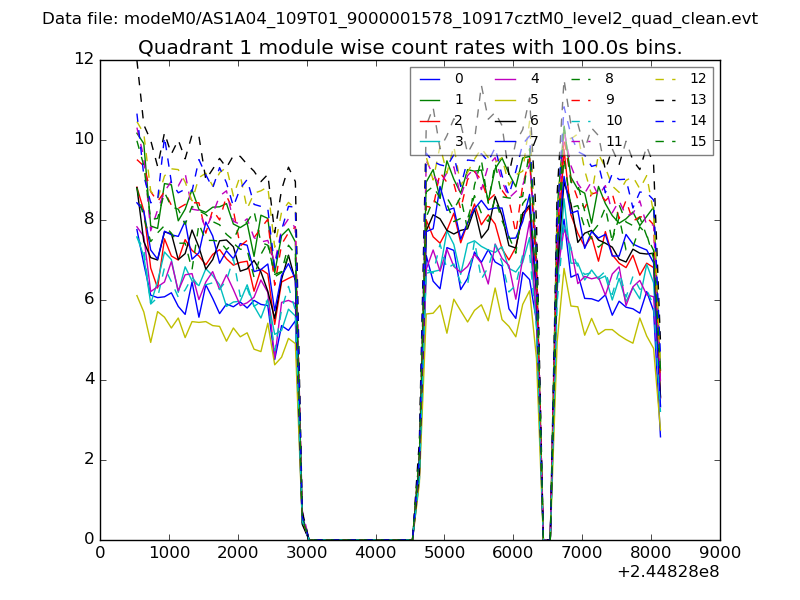
| Module-wise count rates for Quadrant A Data is divided into 100 sec bins |
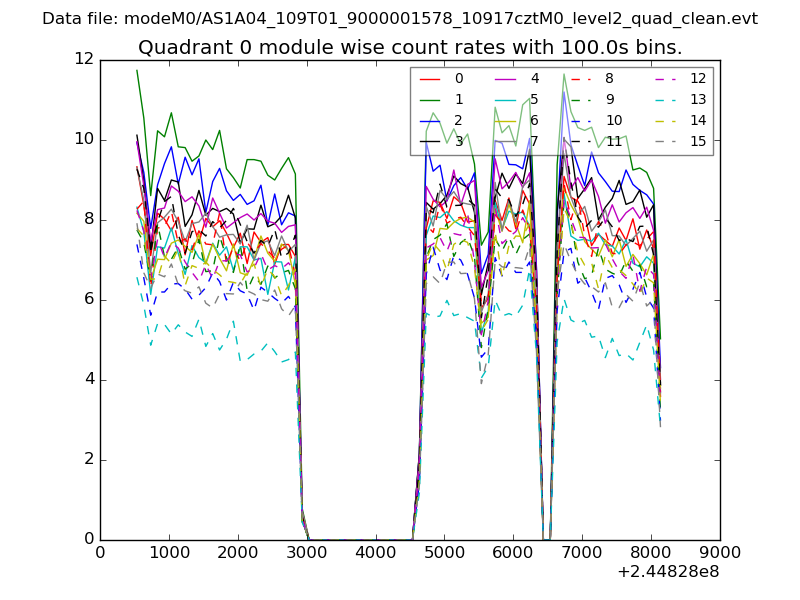 |
 |
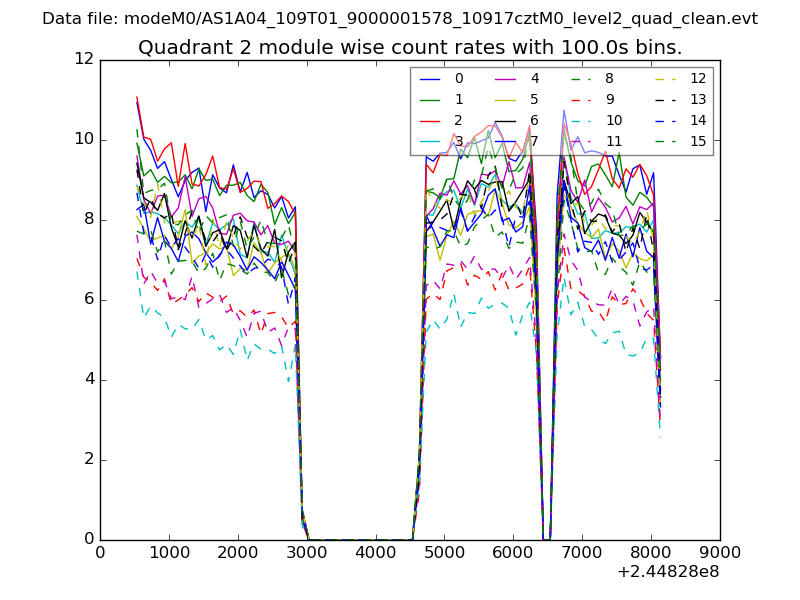
| Module-wise count rates for Quadrant B Data is divided into 100 sec bins |
 |
 |
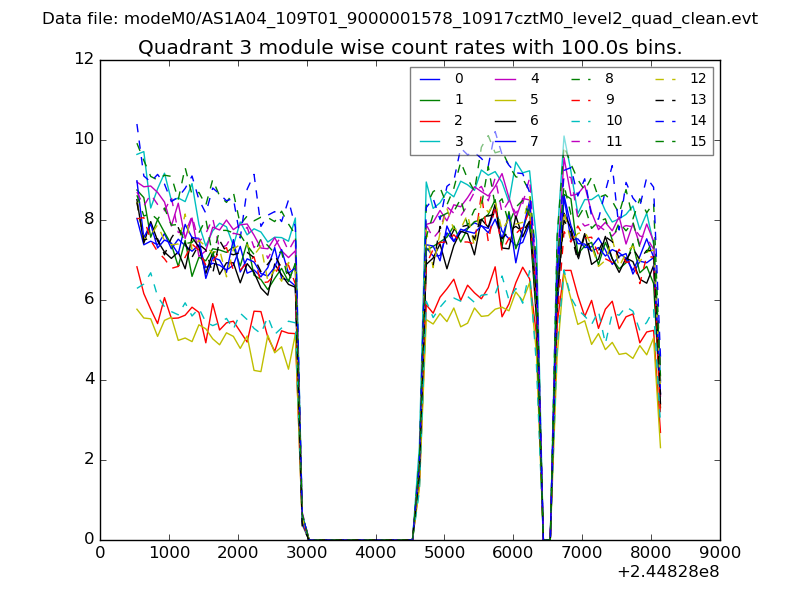
| Module-wise count rates for Quadrant C Data is divided into 100 sec bins |
 |
 |
| Module-wise count rates for Quadrant D Data is divided into 100 sec bins |
 |
 |
| Parameter | Plot |
|---|---|
| CZT HV Monitor | 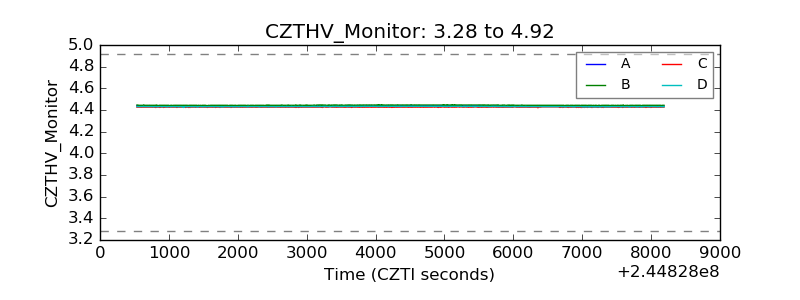 |
| D_VDD | 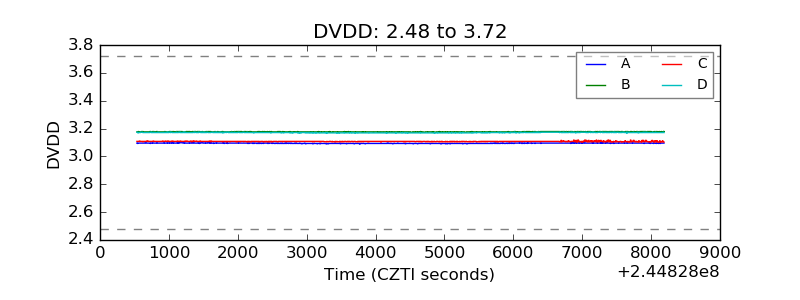 |
| Temperature 1 | 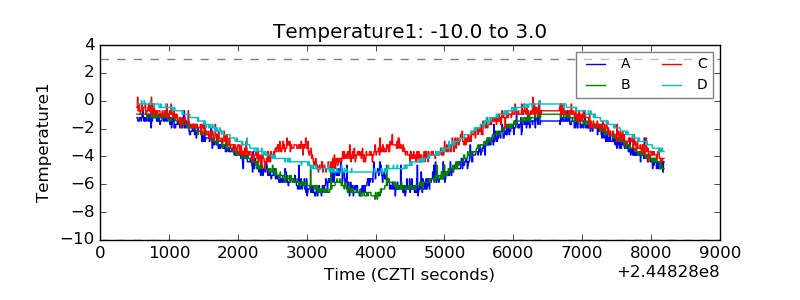 |
| Veto HV Monitor | 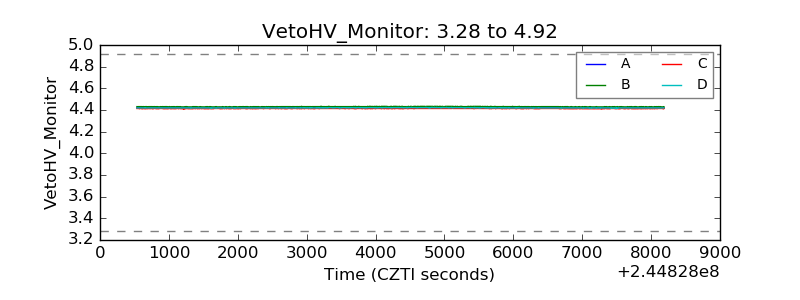 |
| Veto LLD | 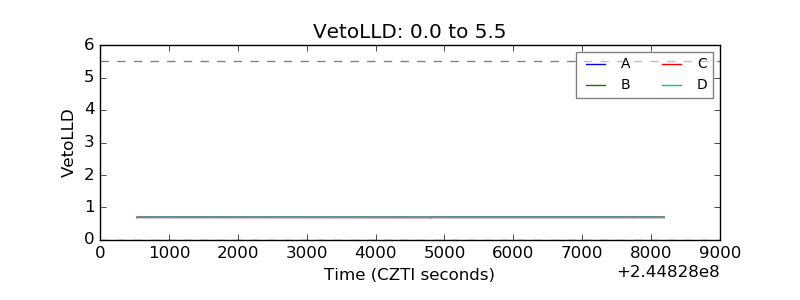 |
| Alpha Counter | 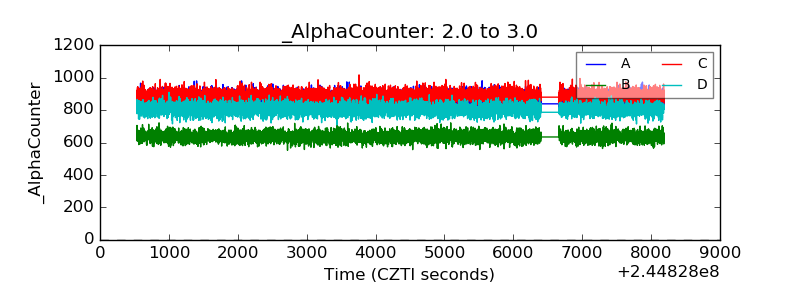 |
| _CPM_Rate | 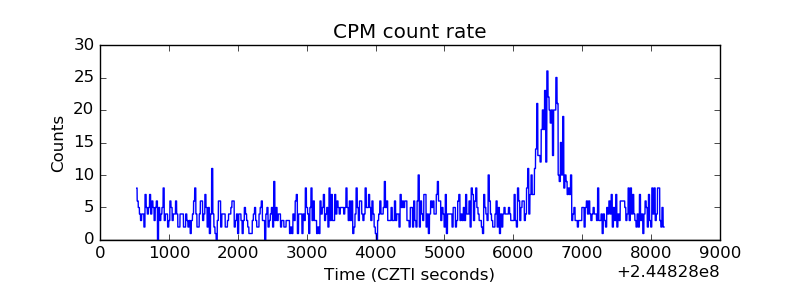 |
| CZT Counter | 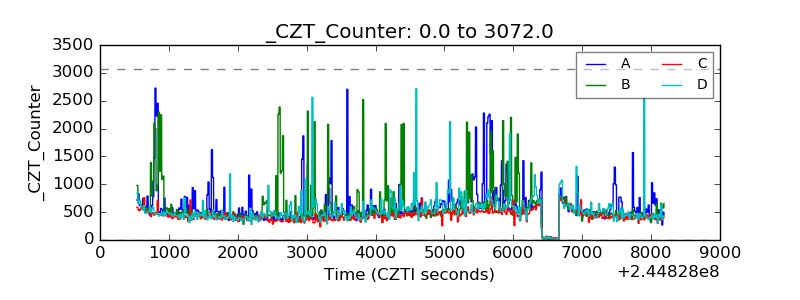 |
| +2.5 Volts monitor |  |
| +5 Volts monitor |  |
| _ROLL_ROT | 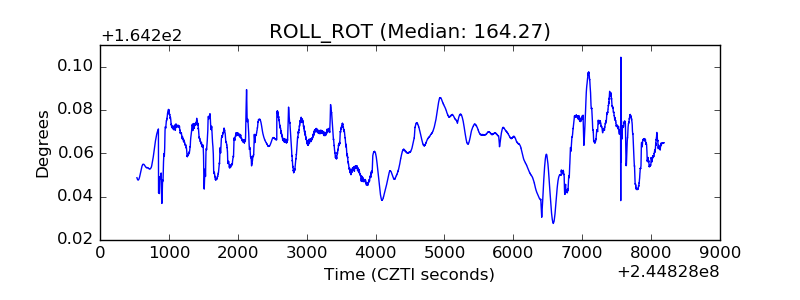 |
| _Roll_DEC | 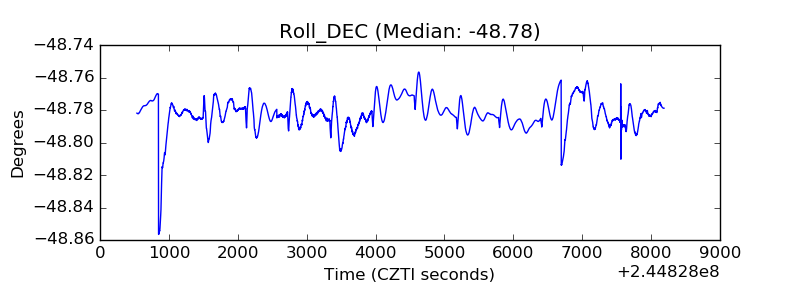 |
| _Roll_RA | 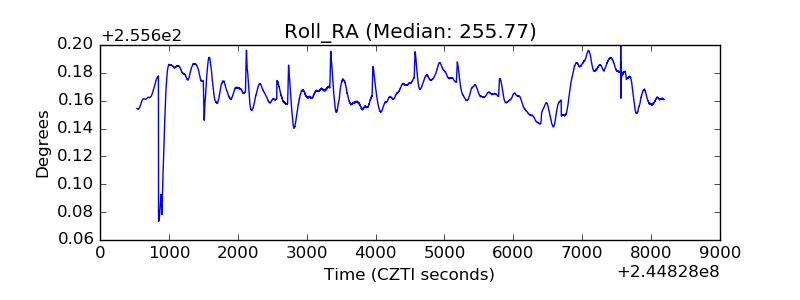 |
| Veto Counter | 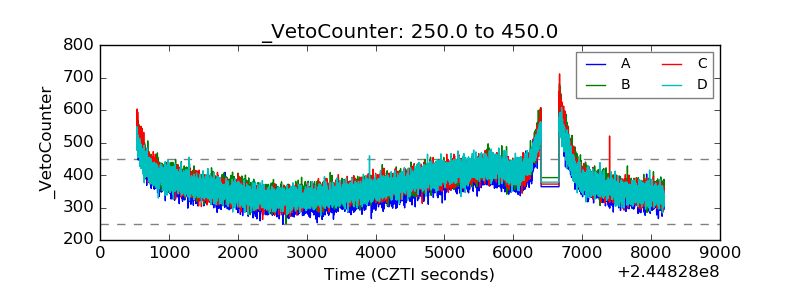 |