| Param | Original file | Final file |
|---|---|---|
| Filename | modeM0/AS1A04_109T01_9000001578_10918cztM0_level2.evt | modeM0/AS1A04_109T01_9000001578_10918cztM0_level2_quad_clean.evt |
| Size (bytes) | 563,495,040 | 104,866,560 |
| Size | 537.4 MB | 100.0 MB |
| Events in quadrant A | 4,622,168 | 661,369 |
| Events in quadrant B | 4,712,391 | 674,325 |
| Events in quadrant C | 3,210,722 | 683,083 |
| Events in quadrant D | 4,023,269 | 646,924 |
| Mode SS | |||
|---|---|---|---|
| Quadrant | BADHDUFLAG | Total packets | Discarded packets |
| A | 0 | 150 | 0 |
| B | 0 | 150 | 0 |
| C | 0 | 150 | 0 |
| D | 0 | 150 | 0 |
| Mode M9 | |||
|---|---|---|---|
| Quadrant | BADHDUFLAG | Total packets | Discarded packets |
| A | 0 | 1 | 0 |
| B | 0 | 1 | 0 |
| C | 0 | 1 | 0 |
| D | 0 | 1 | 0 |
| Mode M0 | |||
|---|---|---|---|
| Quadrant | BADHDUFLAG | Total packets | Discarded packets |
| A | 0 | 18707 | 15 |
| B | 0 | 18976 | 17 |
| C | 0 | 14935 | 10 |
| D | 0 | 17150 | 22 |
| Quadrant | Total seconds | Saturated seconds | Saturation percentage |
|---|---|---|---|
| A | 7323 | 285 | 3.891848% |
| B | 7323 | 335 | 4.574628% |
| C | 7325 | 28 | 0.382253% |
| D | 7322 | 87 | 1.188200% |
Noise dominated data is calculated using 1-second bins in cleaned event files. If a bin has >2000 counts, and if more than 50% of those come from <1% of pixels, then it is considered to be noise-dominated and hence unusable.
| Quadrant | # 1 sec bins | Bins with >0 counts | Bins with >2000 counts | High rate bins dominated by noise | Noise dominated (total time) | Noise dominated (detector-on time) | Marked lightcurve |
|---|---|---|---|---|---|---|---|
| A | 7488 | 7331 | 100 | 100 | 1.34% | 1.36% | 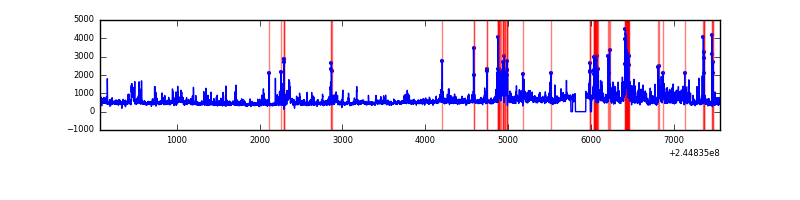 |
| B | 7488 | 7331 | 149 | 149 | 1.99% | 2.03% | 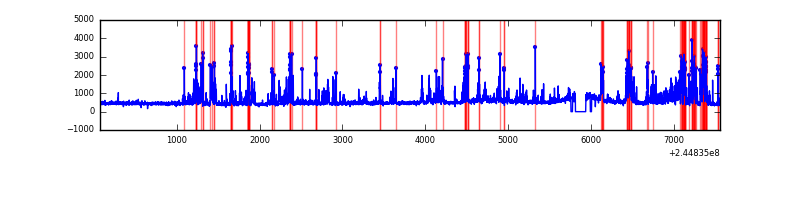 |
| C | 7488 | 7331 | 0 | 0 | 0.00% | 0.00% | 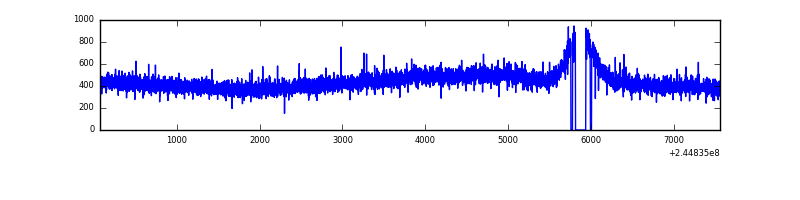 |
| D | 7488 | 7331 | 65 | 65 | 0.87% | 0.89% | 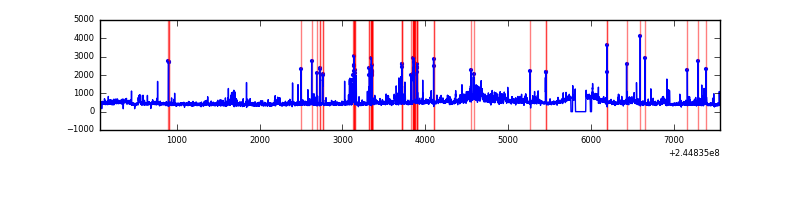 |
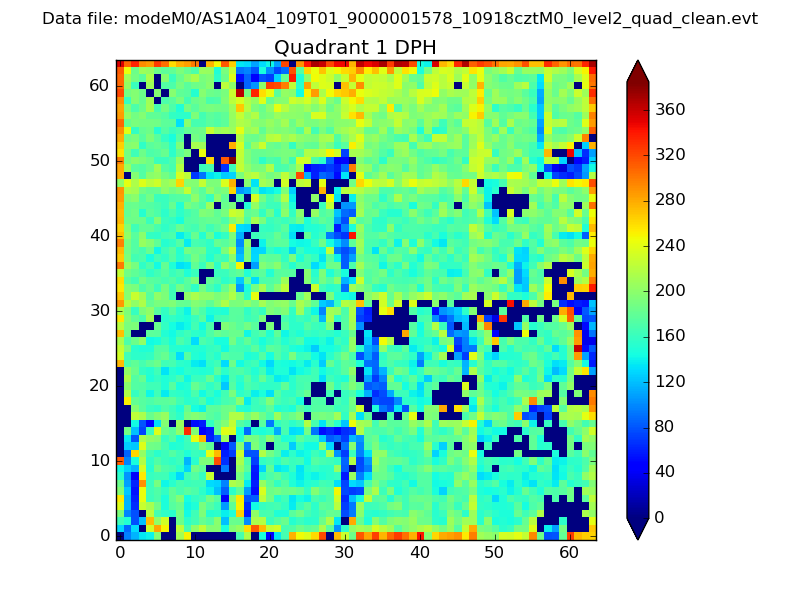
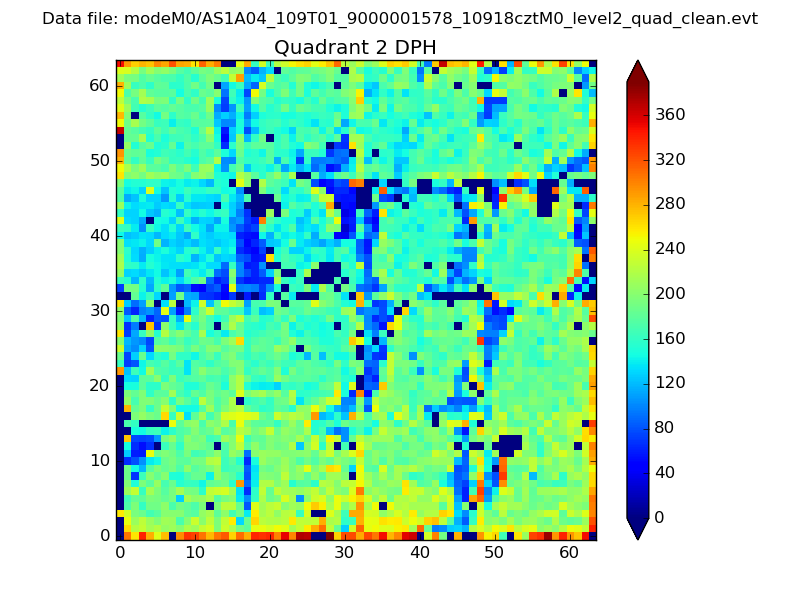
Top three noisy pixels from each quadrant. If the there are fewer than three noisy pixels in the level2.evt file, extra rows are filled as -1
| Pixel properties | Quadrant properties | ||||||
|---|---|---|---|---|---|---|---|
| Quadrant | DetID | PixID | Counts | Sigma | Mean | Median | Sigma |
| A | 13 | 251 | 849556 | 4943.07 | 835 | 816 | 171.7 |
| A | 15 | 223 | 310671 | 1804.6 | 835 | 816 | 171.7 |
| A | 8 | 5 | 122250 | 707.23 | 835 | 816 | 171.7 |
| B | 4 | 239 | 1281742 | 7910.08 | 841 | 820 | 161.9 |
| B | 0 | 214 | 52965 | 322.01 | 841 | 820 | 161.9 |
| B | 15 | 204 | 24700 | 147.47 | 841 | 820 | 161.9 |
| C | 8 | 128 | 8914 | 42.47 | 817 | 818 | 190.6 |
| C | 8 | 222 | 8338 | 39.45 | 817 | 818 | 190.6 |
| C | 13 | 61 | 6233 | 28.41 | 817 | 818 | 190.6 |
| D | 1 | 52 | 723626 | 3643.36 | 812 | 787 | 198.4 |
| D | 5 | 222 | 37146 | 183.26 | 812 | 787 | 198.4 |
| D | 13 | 104 | 32538 | 160.04 | 812 | 787 | 198.4 |
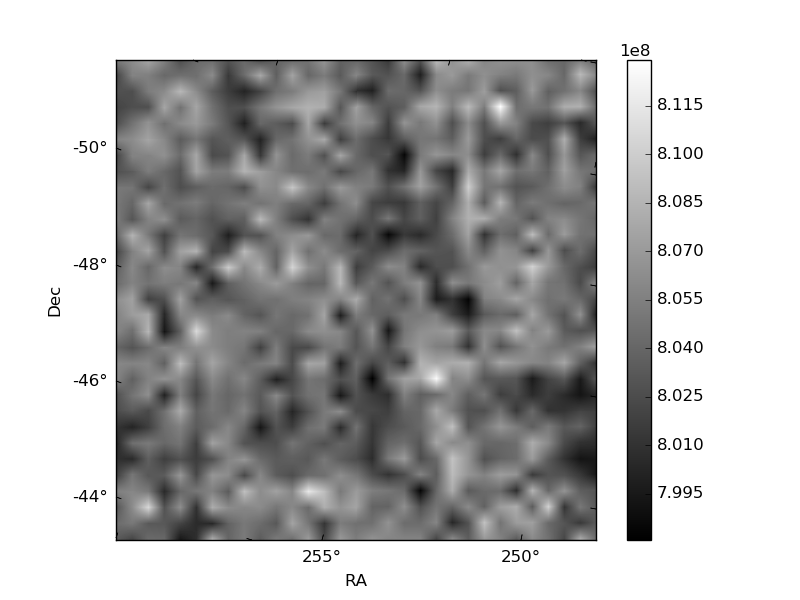
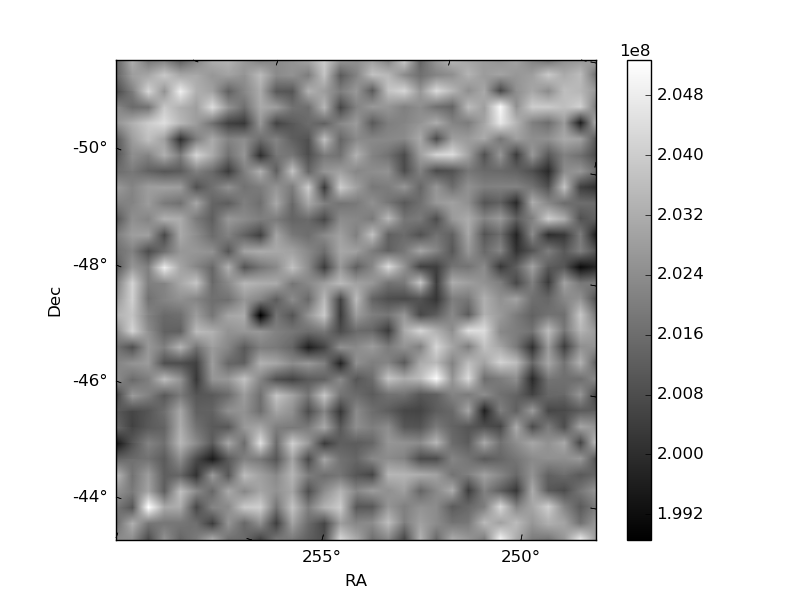
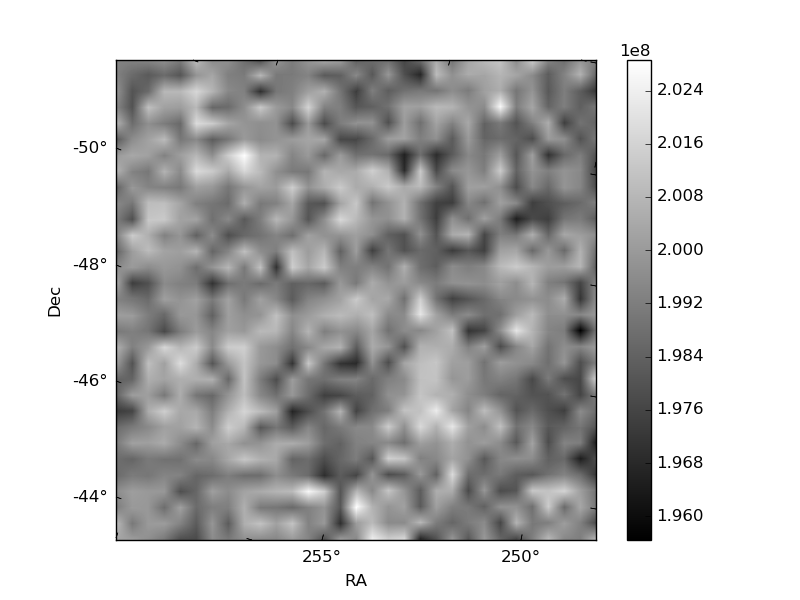
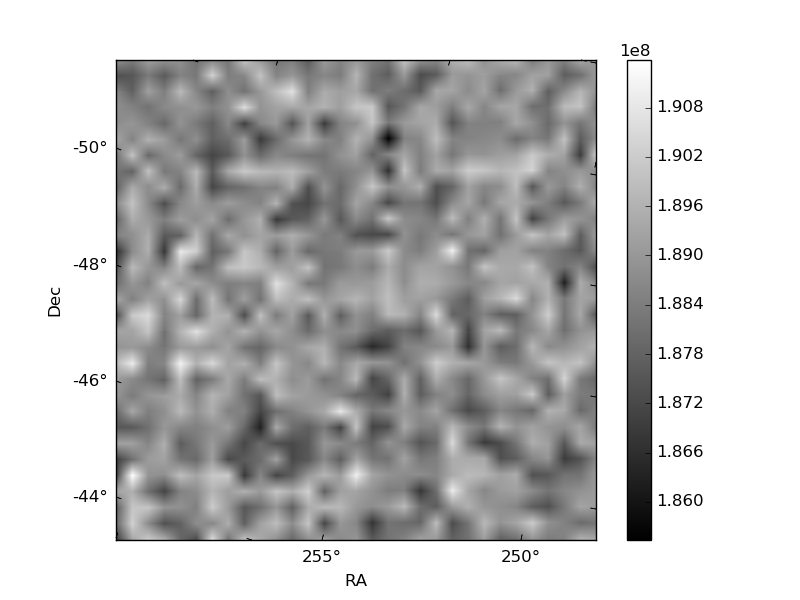
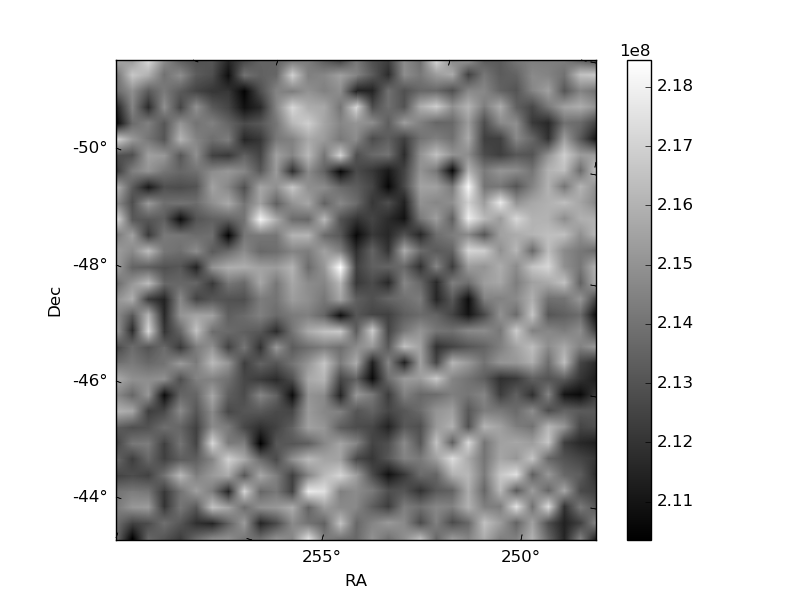
Histogram calculated using DETX and DETY for each event in the final _common_clean file
| Quadrant A | 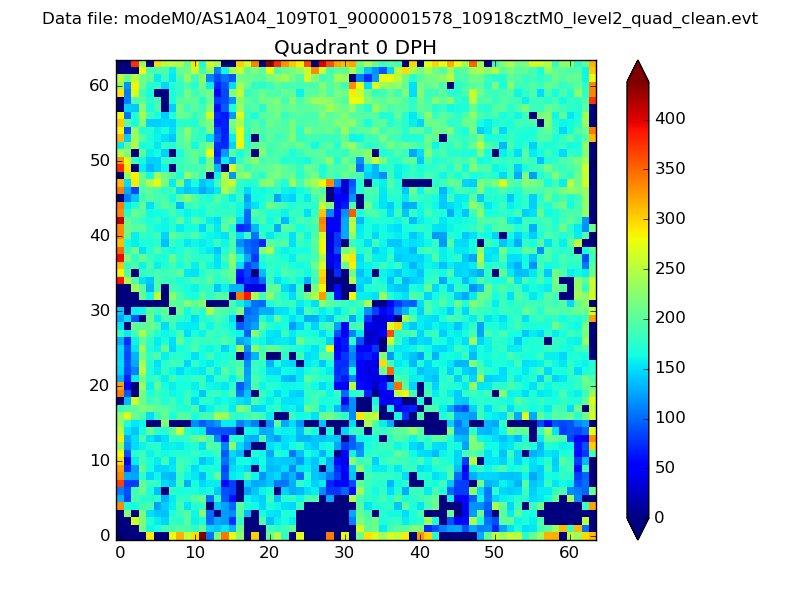 |
 |
Quadrant B |
|---|---|---|---|
| Quadrant D | 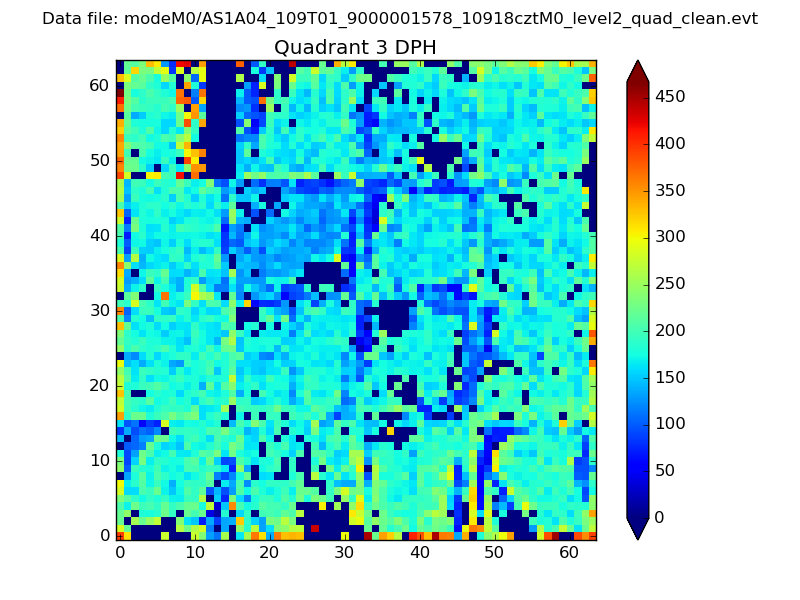 |
 |
Quadrant C |
| Plot type | Count rate plots | Images |
|---|---|---|
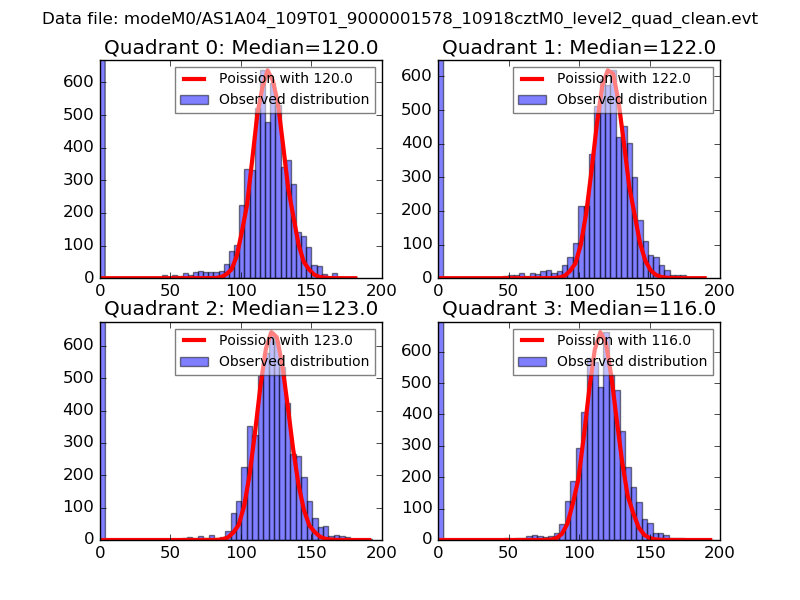
| Comparison with Poisson distribution Blue bars denote a histogram of data divided into 1 sec bins. Red curve is a Poisson curve with rate = median count rate of data. |
 |
 |
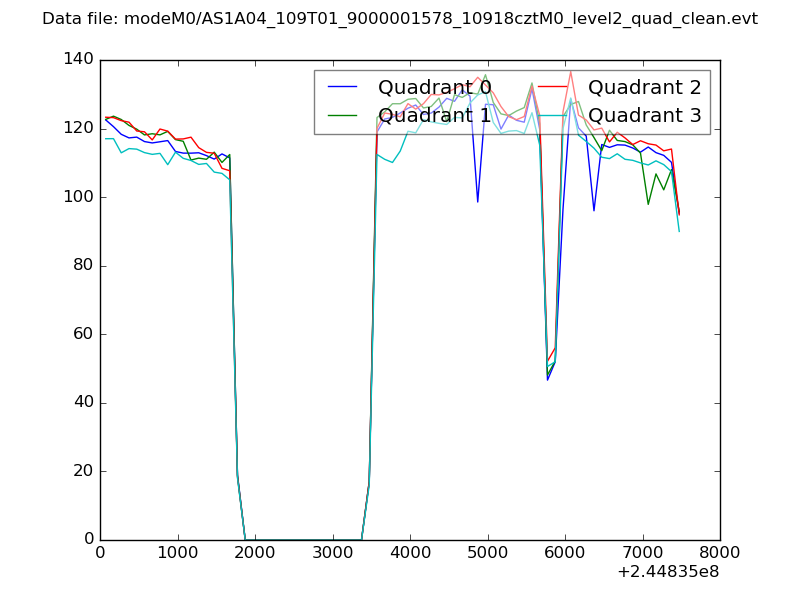
| Quadrant-wise count rates Data is divided into 100 sec bins |
 |
|
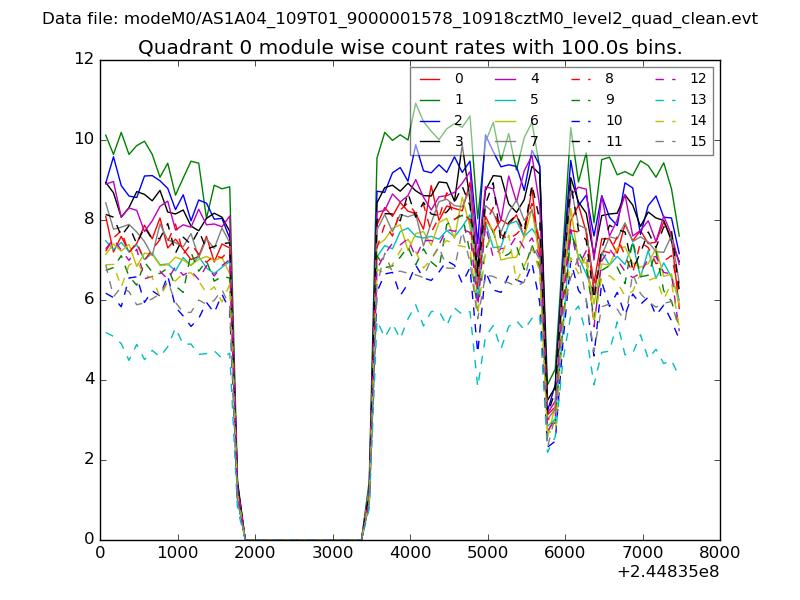
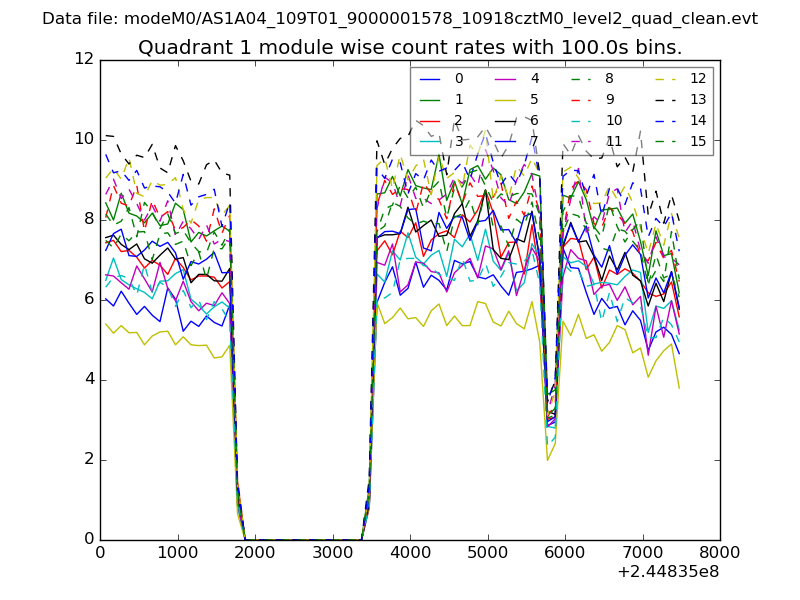
| Module-wise count rates for Quadrant A Data is divided into 100 sec bins |
 |
 |
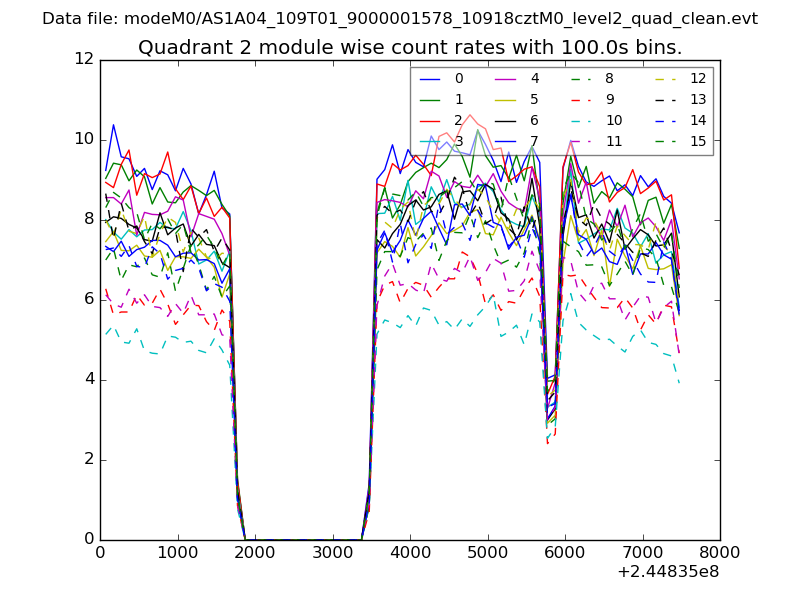
| Module-wise count rates for Quadrant B Data is divided into 100 sec bins |
 |
 |
| Module-wise count rates for Quadrant C Data is divided into 100 sec bins |
 |
 |
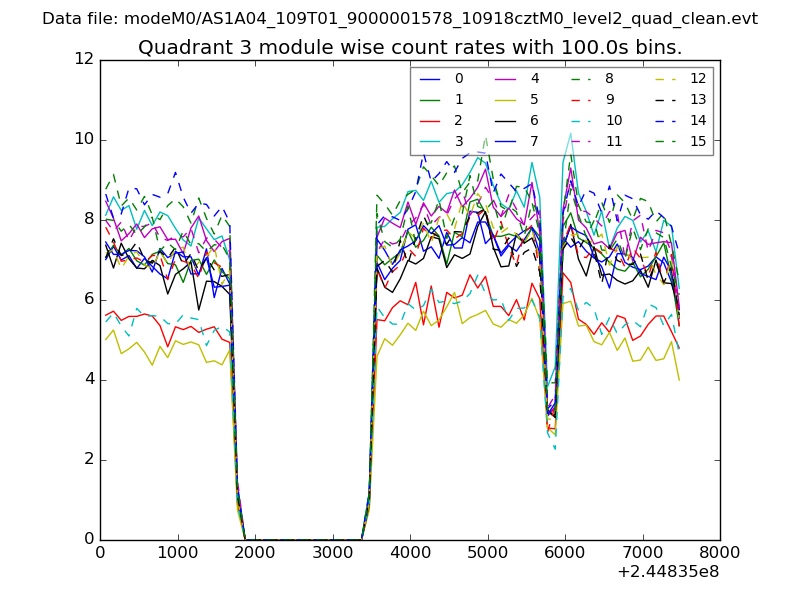
| Module-wise count rates for Quadrant D Data is divided into 100 sec bins |
 |
 |
| Parameter | Plot |
|---|---|
| CZT HV Monitor | 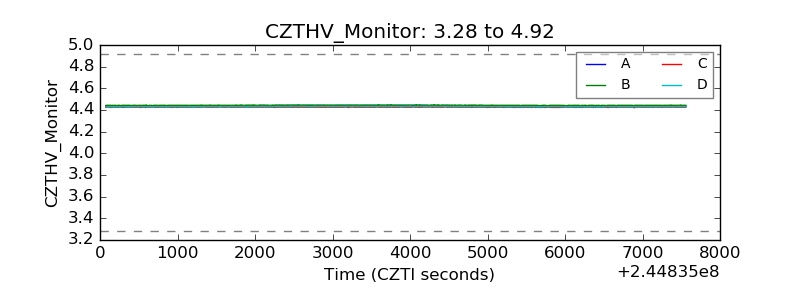 |
| D_VDD | 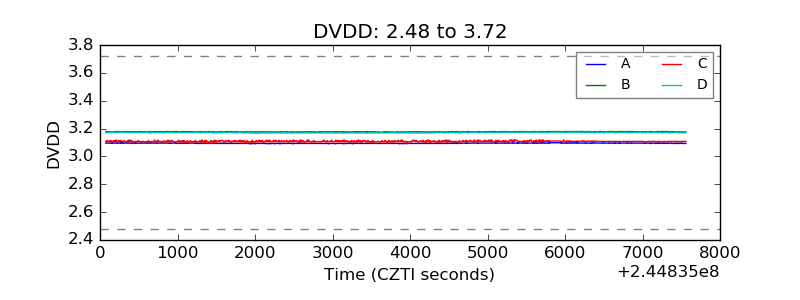 |
| Temperature 1 | 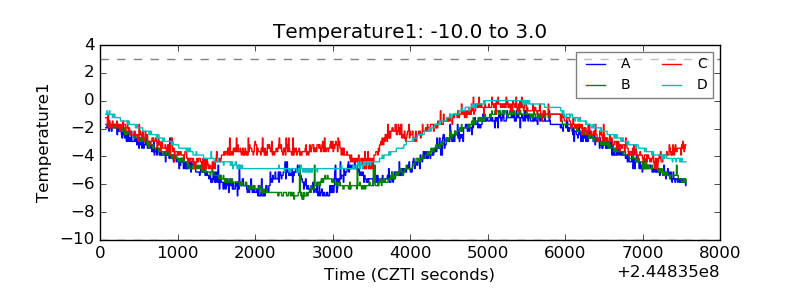 |
| Veto HV Monitor | 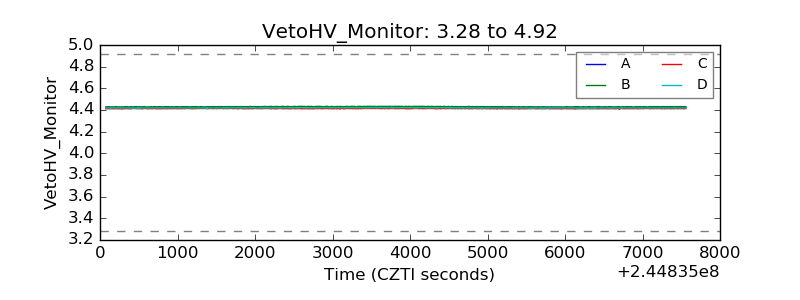 |
| Veto LLD |  |
| Alpha Counter | 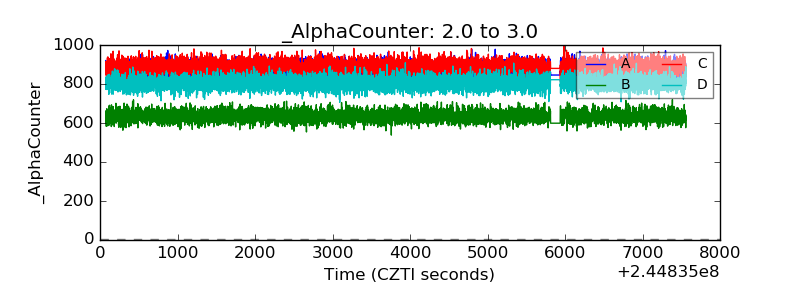 |
| _CPM_Rate | 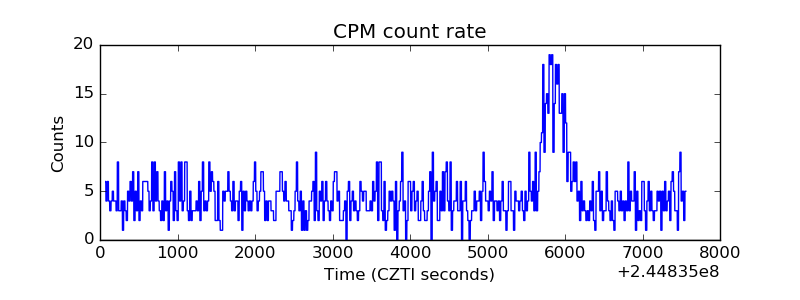 |
| CZT Counter | 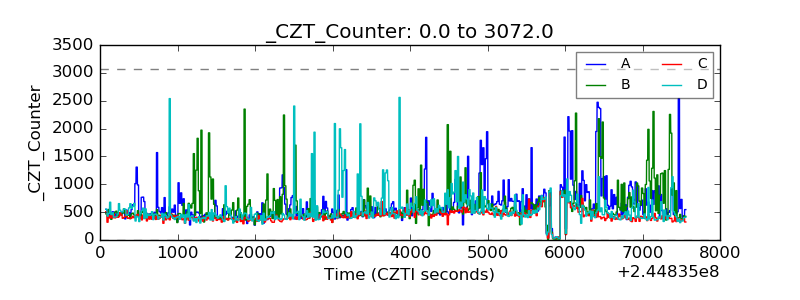 |
| +2.5 Volts monitor | 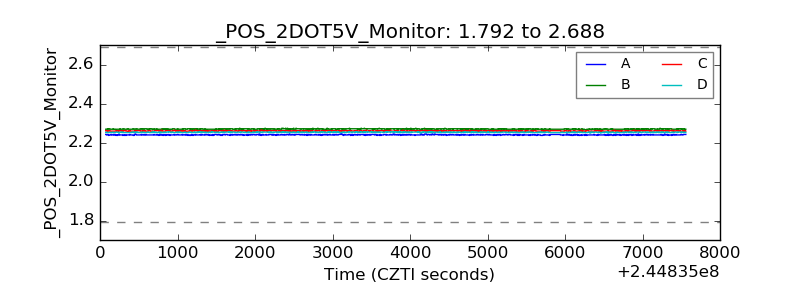 |
| +5 Volts monitor | 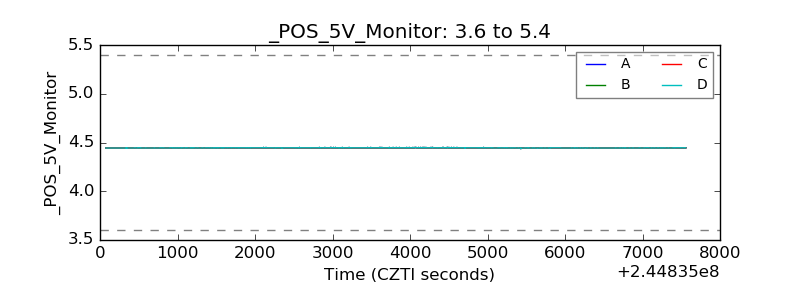 |
| _ROLL_ROT | 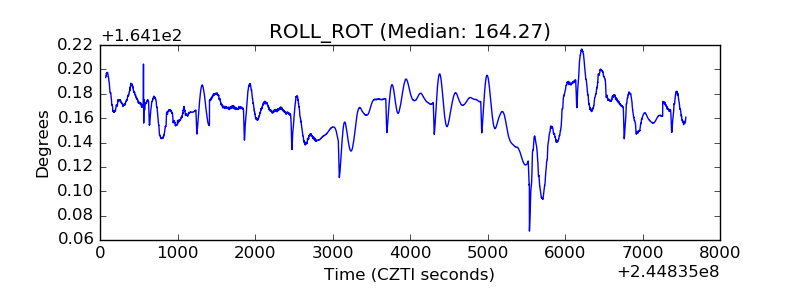 |
| _Roll_DEC | 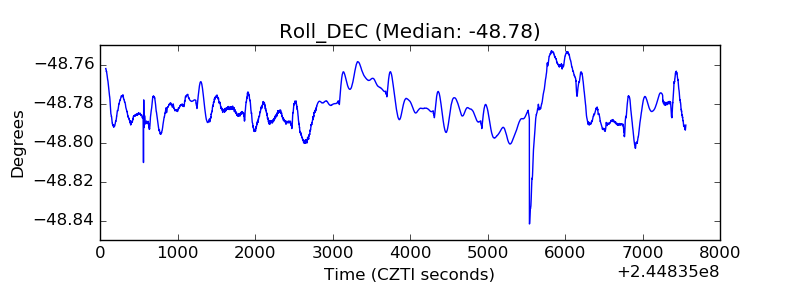 |
| _Roll_RA | 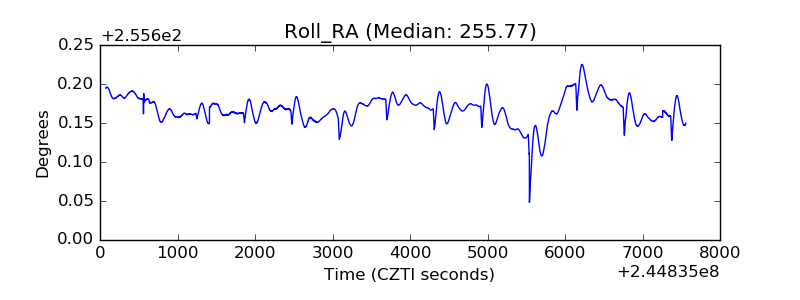 |
| Veto Counter | 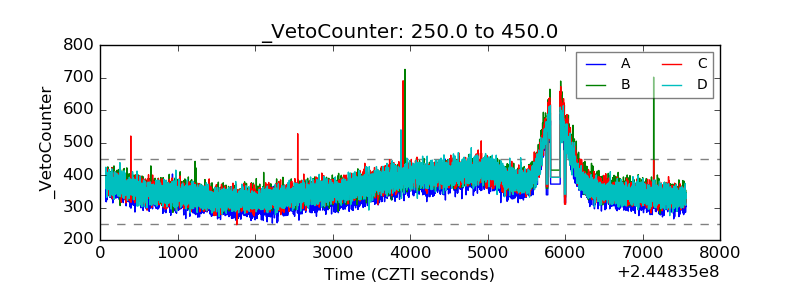 |