| Param | Original file | Final file |
|---|---|---|
| Filename | modeM0/AS1A04_109T01_9000001578_10921cztM0_level2.evt | modeM0/AS1A04_109T01_9000001578_10921cztM0_level2_quad_clean.evt |
| Size (bytes) | 762,932,160 | 107,121,600 |
| Size | 727.6 MB | 102.2 MB |
| Events in quadrant A | 7,953,786 | 599,017 |
| Events in quadrant B | 5,628,703 | 676,467 |
| Events in quadrant C | 3,947,170 | 686,372 |
| Events in quadrant D | 4,954,859 | 645,351 |
| Mode SS | |||
|---|---|---|---|
| Quadrant | BADHDUFLAG | Total packets | Discarded packets |
| A | 0 | 186 | 0 |
| B | 0 | 186 | 0 |
| C | 0 | 186 | 0 |
| D | 0 | 186 | 0 |
| Mode M9 | |||
|---|---|---|---|
| Quadrant | BADHDUFLAG | Total packets | Discarded packets |
| A | 0 | 6 | 0 |
| B | 0 | 6 | 0 |
| C | 0 | 6 | 0 |
| D | 0 | 7 | 0 |
| Mode M0 | |||
|---|---|---|---|
| Quadrant | BADHDUFLAG | Total packets | Discarded packets |
| A | 0 | 29903 | 10 |
| B | 0 | 22905 | 4 |
| C | 0 | 18528 | 4 |
| D | 0 | 21120 | 2 |
| Quadrant | Total seconds | Saturated seconds | Saturation percentage |
|---|---|---|---|
| A | 9168 | 1297 | 14.147033% |
| B | 9170 | 363 | 3.958561% |
| C | 9170 | 28 | 0.305344% |
| D | 9171 | 117 | 1.275761% |
Noise dominated data is calculated using 1-second bins in cleaned event files. If a bin has >2000 counts, and if more than 50% of those come from <1% of pixels, then it is considered to be noise-dominated and hence unusable.
| Quadrant | # 1 sec bins | Bins with >0 counts | Bins with >2000 counts | High rate bins dominated by noise | Noise dominated (total time) | Noise dominated (detector-on time) | Marked lightcurve |
|---|---|---|---|---|---|---|---|
| A | 9762 | 9172 | 1068 | 1068 | 10.94% | 11.64% | 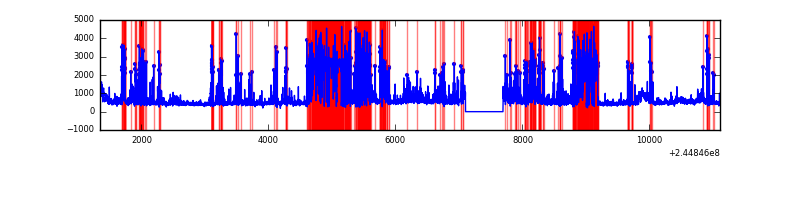 |
| B | 9762 | 9172 | 216 | 216 | 2.21% | 2.35% | 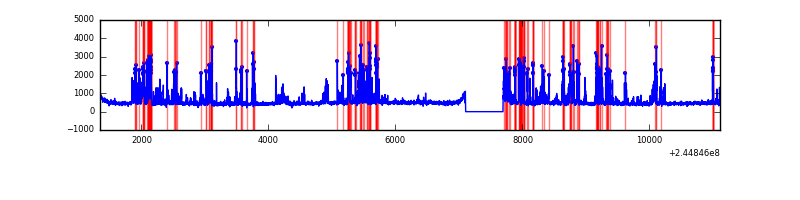 |
| C | 9762 | 9172 | 0 | 0 | 0.00% | 0.00% | 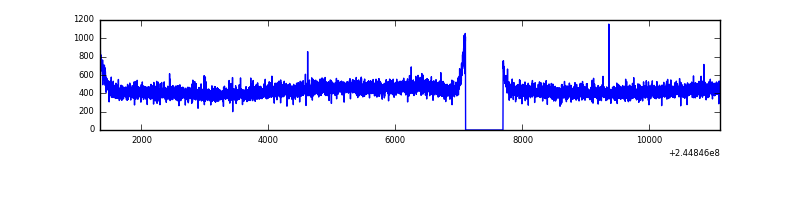 |
| D | 9762 | 9172 | 80 | 80 | 0.82% | 0.87% | 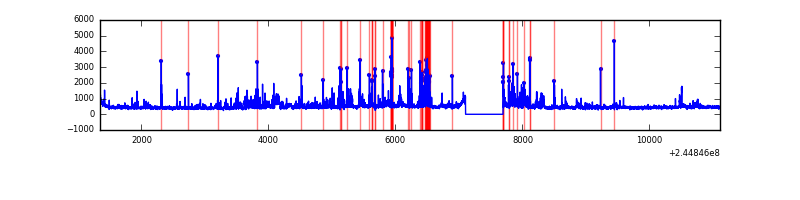 |
Top three noisy pixels from each quadrant. If the there are fewer than three noisy pixels in the level2.evt file, extra rows are filled as -1
| Pixel properties | Quadrant properties | ||||||
|---|---|---|---|---|---|---|---|
| Quadrant | DetID | PixID | Counts | Sigma | Mean | Median | Sigma |
| A | 13 | 251 | 2036047 | 10651.35 | 951 | 930 | 191.1 |
| A | 8 | 5 | 1723642 | 9016.29 | 951 | 930 | 191.1 |
| A | 13 | 210 | 216124 | 1126.28 | 951 | 930 | 191.1 |
| B | 4 | 239 | 1494848 | 7551.12 | 1033 | 1006 | 197.8 |
| B | 0 | 214 | 30474 | 148.96 | 1033 | 1006 | 197.8 |
| B | 12 | 111 | 21259 | 102.38 | 1033 | 1006 | 197.8 |
| C | 0 | 207 | 7843 | 29.09 | 1009 | 1014 | 234.8 |
| C | 13 | 61 | 7508 | 27.66 | 1009 | 1014 | 234.8 |
| C | 8 | 222 | 4824 | 16.23 | 1009 | 1014 | 234.8 |
| D | 1 | 52 | 560793 | 2333.59 | 996 | 969 | 239.9 |
| D | 5 | 222 | 168843 | 699.77 | 996 | 969 | 239.9 |
| D | 8 | 195 | 156727 | 649.27 | 996 | 969 | 239.9 |
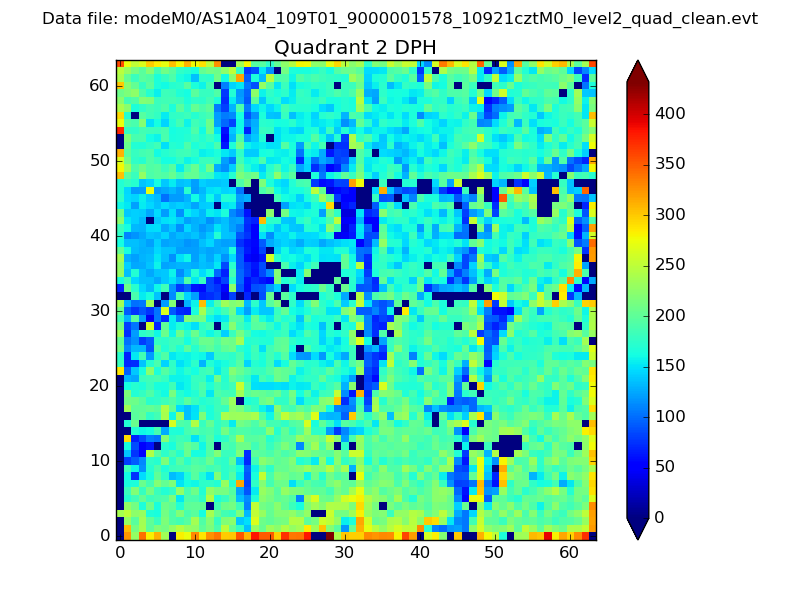
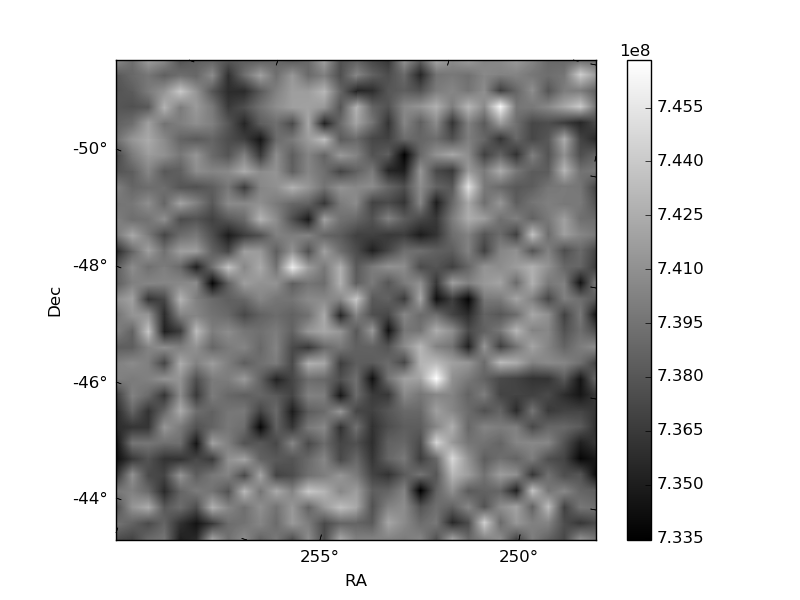
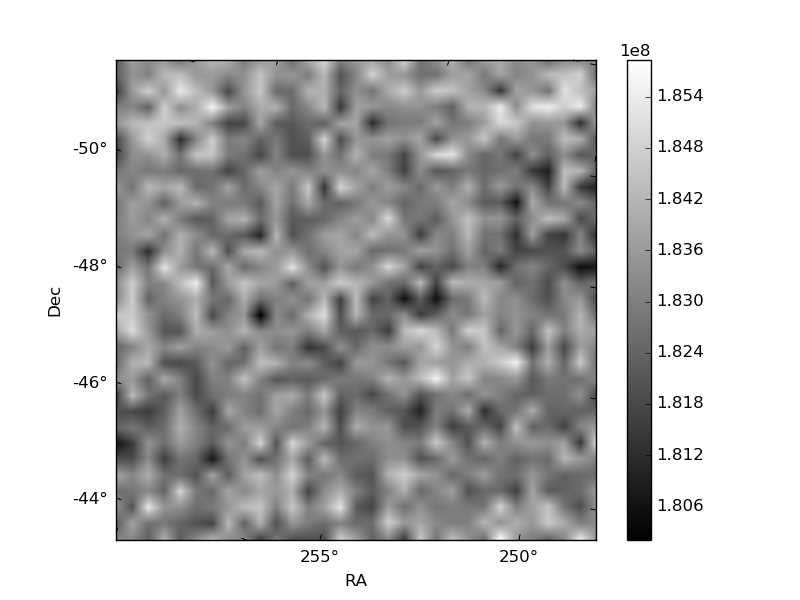
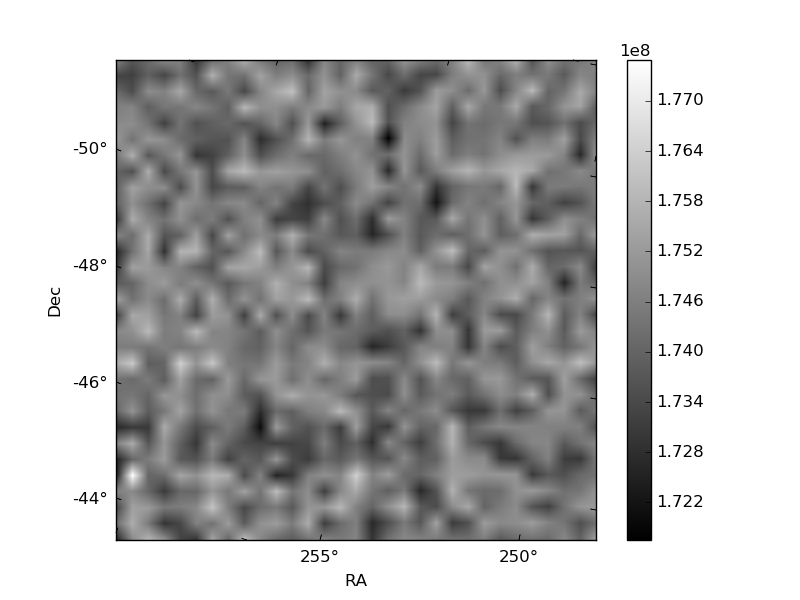
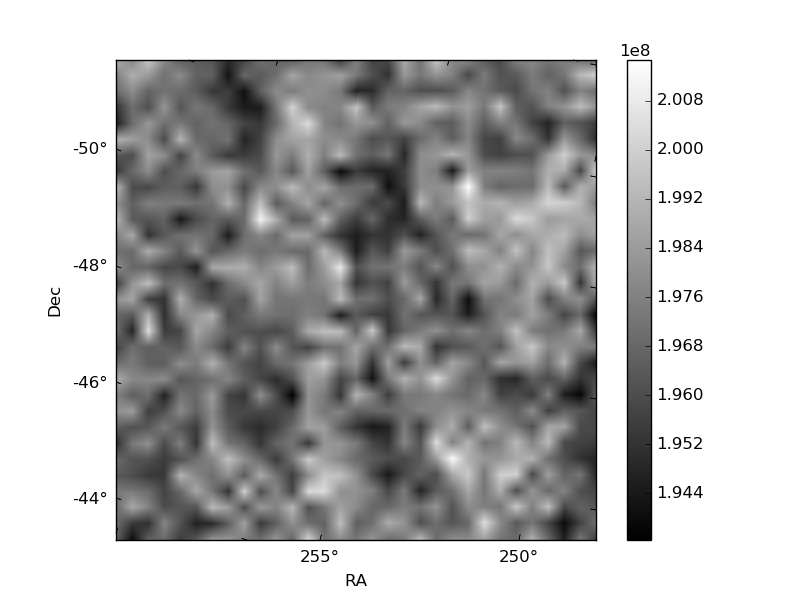
Histogram calculated using DETX and DETY for each event in the final _common_clean file
| Quadrant A | 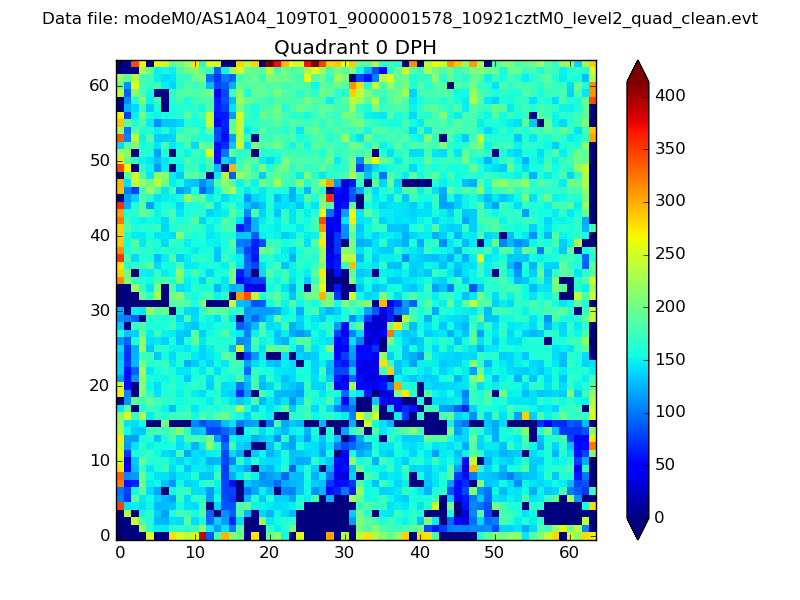 |
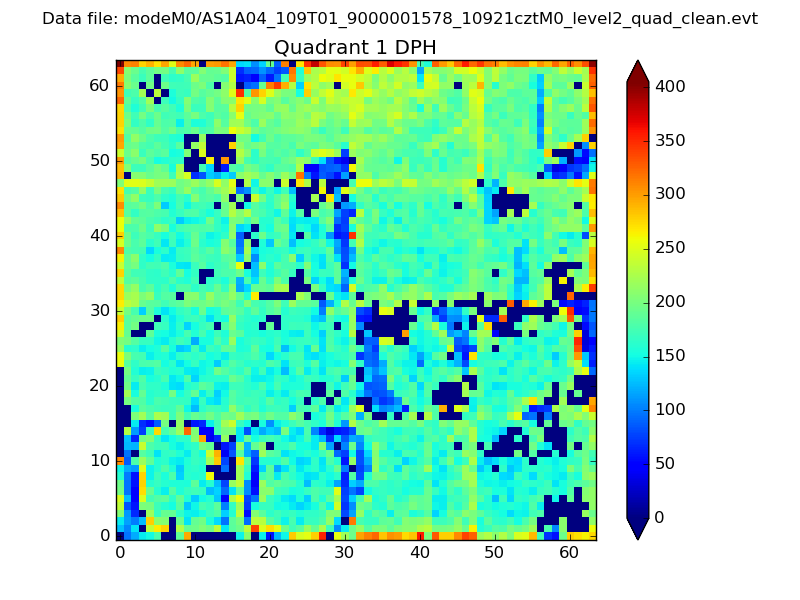 |
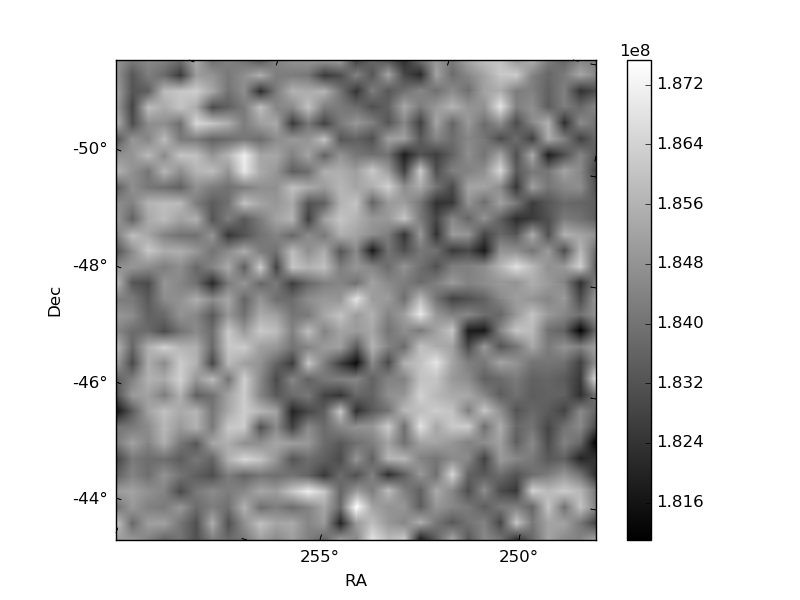
Quadrant B |
|---|---|---|---|
| Quadrant D | 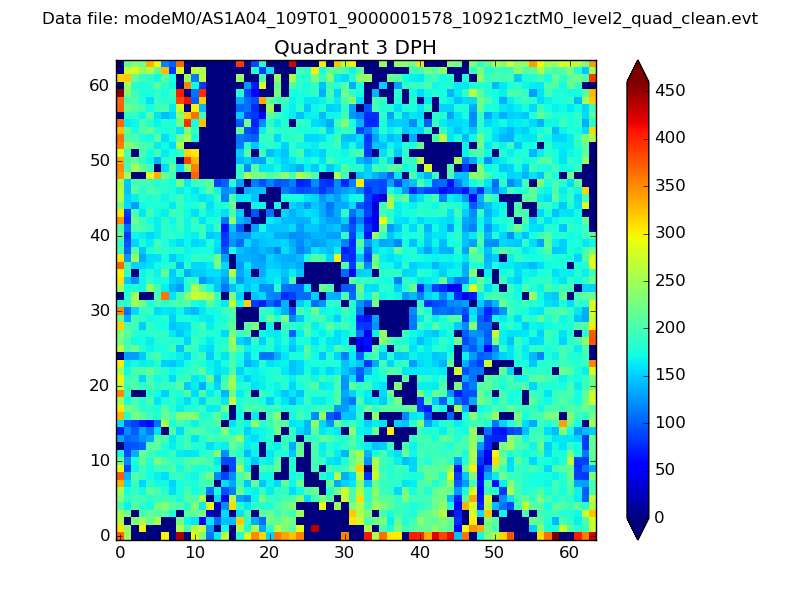 |
 |
Quadrant C |
| Plot type | Count rate plots | Images |
|---|---|---|
| Comparison with Poisson distribution Blue bars denote a histogram of data divided into 1 sec bins. Red curve is a Poisson curve with rate = median count rate of data. |
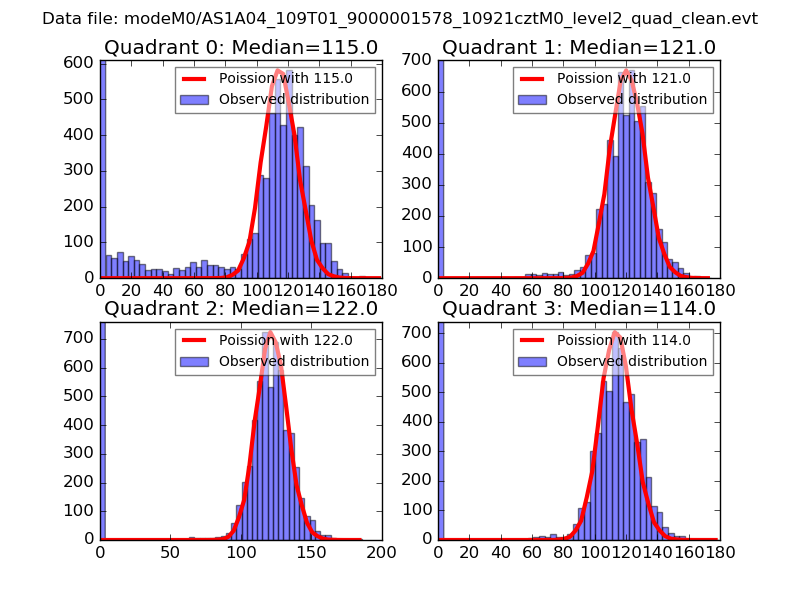 |
 |
| Quadrant-wise count rates Data is divided into 100 sec bins |
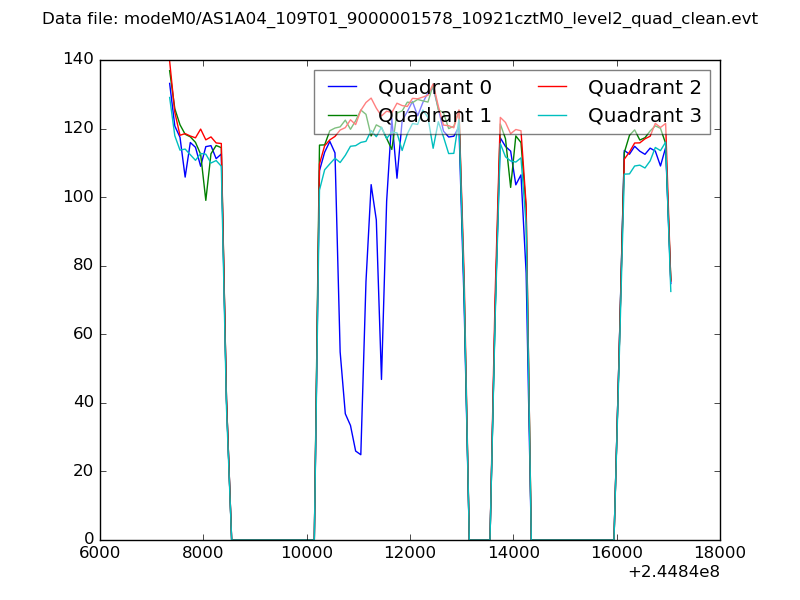 |
|
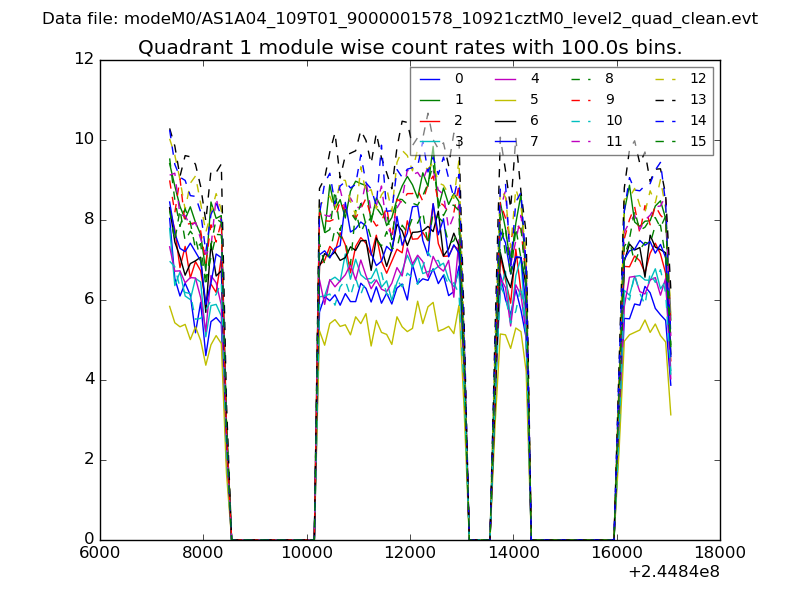
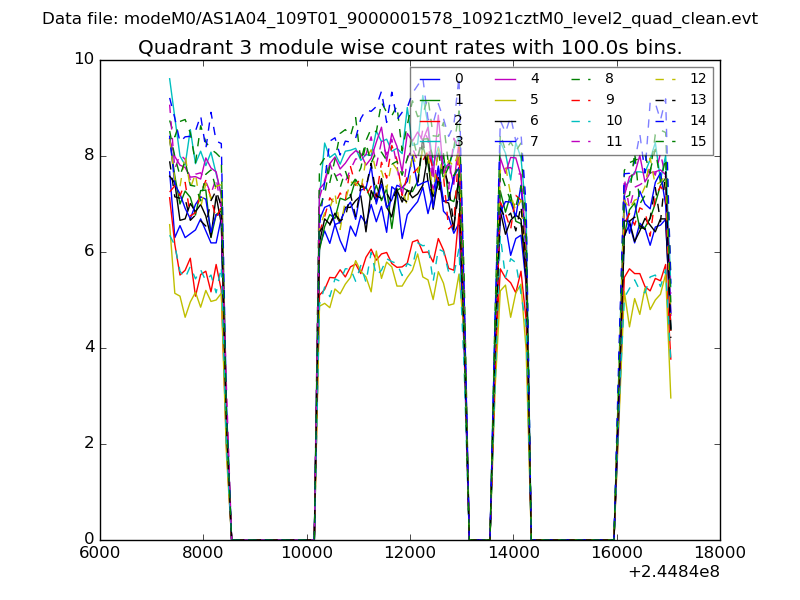
| Module-wise count rates for Quadrant A Data is divided into 100 sec bins |
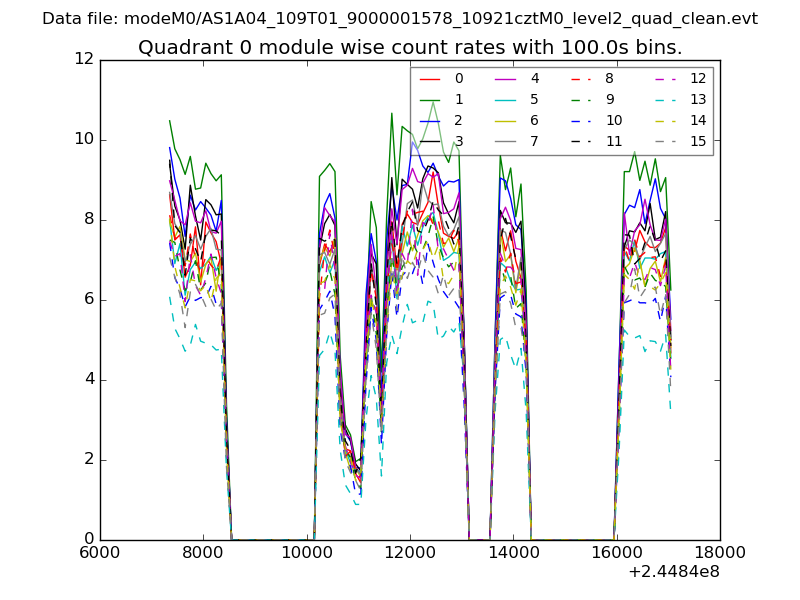 |
 |
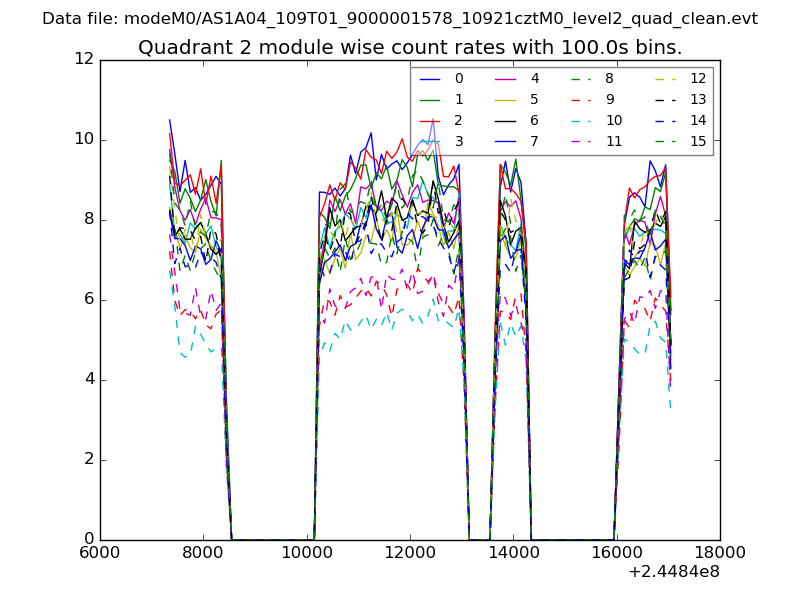
| Module-wise count rates for Quadrant B Data is divided into 100 sec bins |
 |
 |
| Module-wise count rates for Quadrant C Data is divided into 100 sec bins |
 |
 |
| Module-wise count rates for Quadrant D Data is divided into 100 sec bins |
 |
 |
| Parameter | Plot |
|---|---|
| CZT HV Monitor | 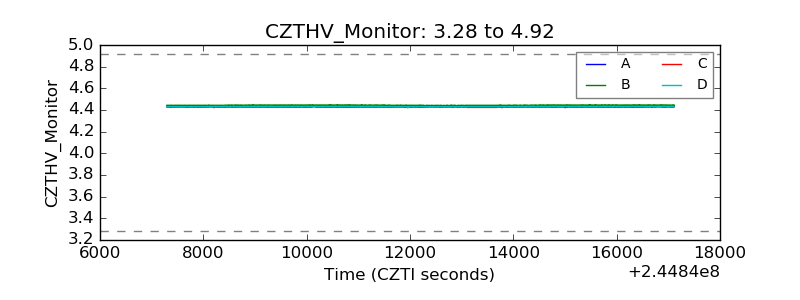 |
| D_VDD | 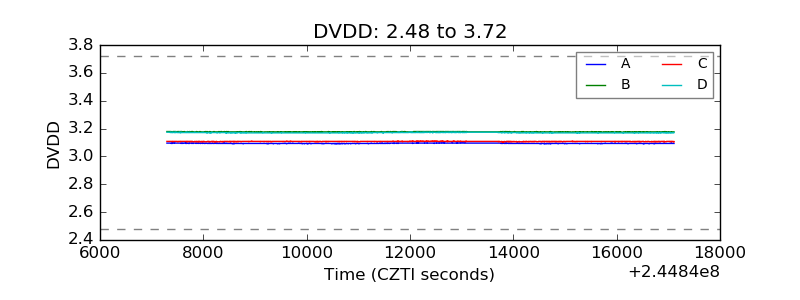 |
| Temperature 1 | 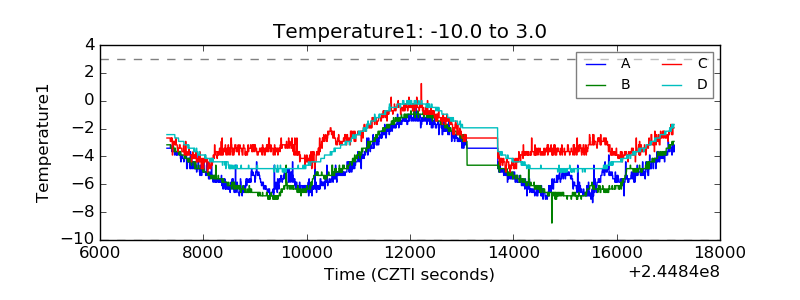 |
| Veto HV Monitor | 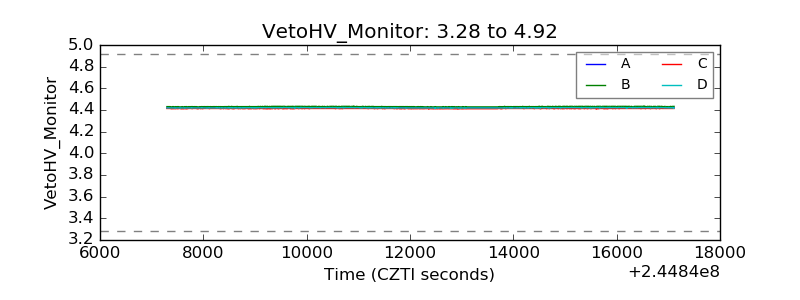 |
| Veto LLD | 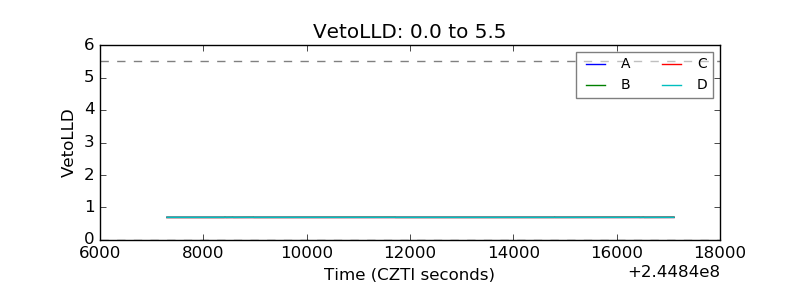 |
| Alpha Counter | 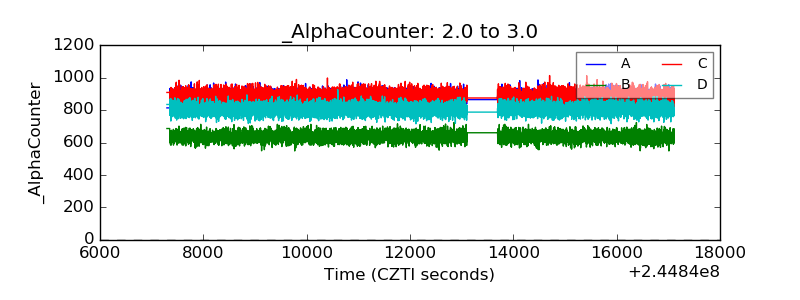 |
| _CPM_Rate | 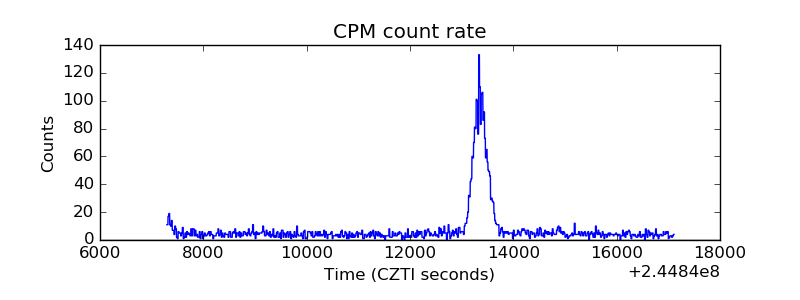 |
| CZT Counter | 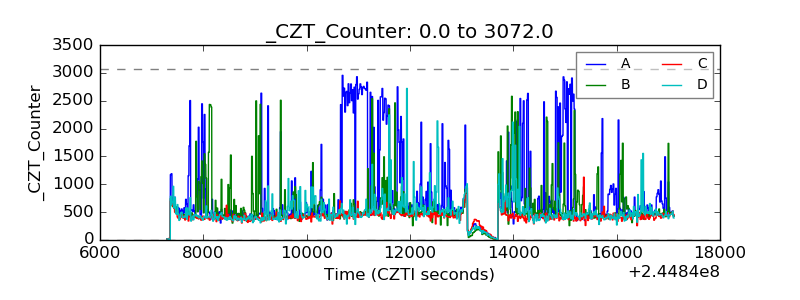 |
| +2.5 Volts monitor |  |
| +5 Volts monitor |  |
| _ROLL_ROT | 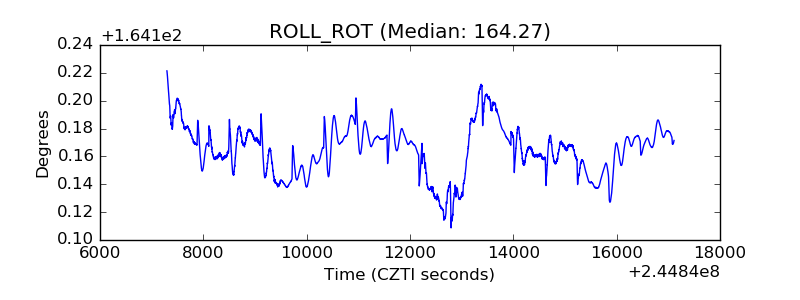 |
| _Roll_DEC | 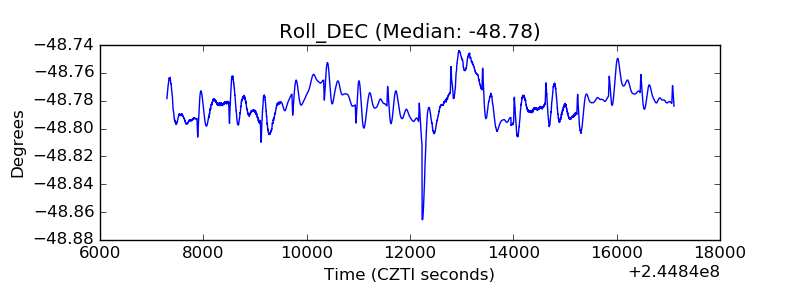 |
| _Roll_RA | 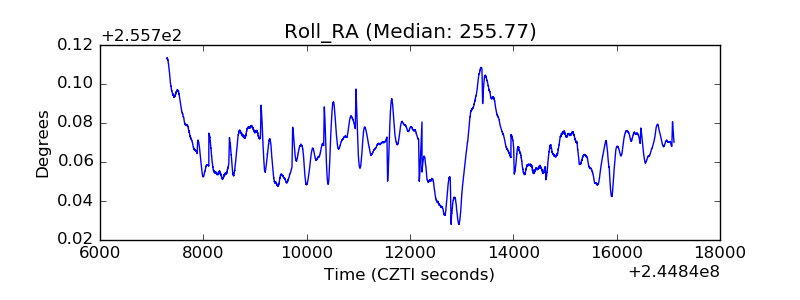 |
| Veto Counter | 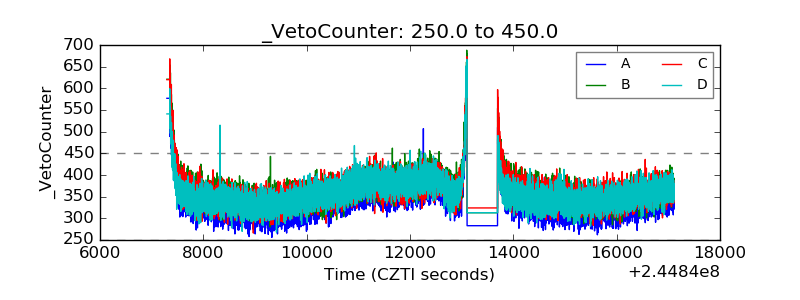 |