| Param | Original file | Final file |
|---|---|---|
| Filename | modeM0/AS1A04_109T01_9000001578_10922cztM0_level2.evt | modeM0/AS1A04_109T01_9000001578_10922cztM0_level2_quad_clean.evt |
| Size (bytes) | 733,953,600 | 113,195,520 |
| Size | 700.0 MB | 108.0 MB |
| Events in quadrant A | 7,142,725 | 681,955 |
| Events in quadrant B | 5,496,786 | 709,871 |
| Events in quadrant C | 4,094,008 | 720,799 |
| Events in quadrant D | 4,877,037 | 682,531 |
| Mode SS | |||
|---|---|---|---|
| Quadrant | BADHDUFLAG | Total packets | Discarded packets |
| A | 0 | 186 | 0 |
| B | 0 | 186 | 0 |
| C | 0 | 186 | 0 |
| D | 0 | 186 | 0 |
| Mode M9 | |||
|---|---|---|---|
| Quadrant | BADHDUFLAG | Total packets | Discarded packets |
| A | 0 | 16 | 0 |
| B | 0 | 16 | 0 |
| C | 0 | 16 | 0 |
| D | 0 | 16 | 0 |
| Mode M0 | |||
|---|---|---|---|
| Quadrant | BADHDUFLAG | Total packets | Discarded packets |
| A | 0 | 27199 | 3 |
| B | 0 | 22182 | 2 |
| C | 0 | 18564 | 2 |
| D | 0 | 20717 | 2 |
| Quadrant | Total seconds | Saturated seconds | Saturation percentage |
|---|---|---|---|
| A | 9120 | 757 | 8.300439% |
| B | 9120 | 367 | 4.024123% |
| C | 9120 | 68 | 0.745614% |
| D | 9120 | 136 | 1.491228% |
Noise dominated data is calculated using 1-second bins in cleaned event files. If a bin has >2000 counts, and if more than 50% of those come from <1% of pixels, then it is considered to be noise-dominated and hence unusable.
| Quadrant | # 1 sec bins | Bins with >0 counts | Bins with >2000 counts | High rate bins dominated by noise | Noise dominated (total time) | Noise dominated (detector-on time) | Marked lightcurve |
|---|---|---|---|---|---|---|---|
| A | 10725 | 9122 | 459 | 459 | 4.28% | 5.03% | 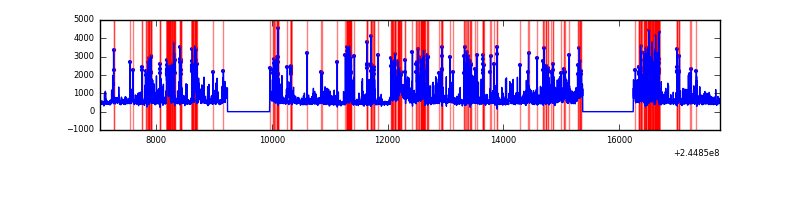 |
| B | 10725 | 9122 | 173 | 173 | 1.61% | 1.90% | 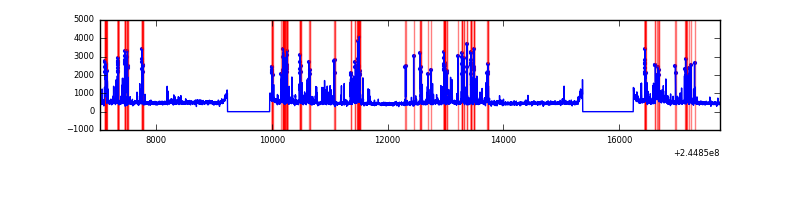 |
| C | 10725 | 9122 | 0 | 0 | 0.00% | 0.00% | 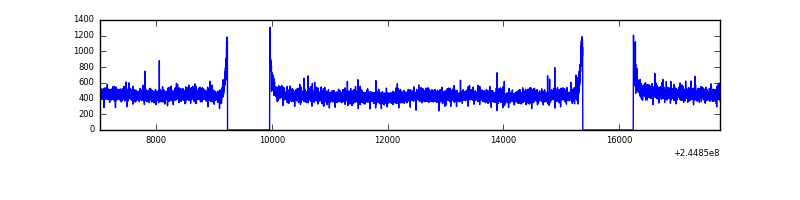 |
| D | 10725 | 9122 | 62 | 62 | 0.58% | 0.68% |  |
Top three noisy pixels from each quadrant. If the there are fewer than three noisy pixels in the level2.evt file, extra rows are filled as -1
| Pixel properties | Quadrant properties | ||||||
|---|---|---|---|---|---|---|---|
| Quadrant | DetID | PixID | Counts | Sigma | Mean | Median | Sigma |
| A | 8 | 5 | 1587554 | 7505.72 | 1044 | 1020 | 211.4 |
| A | 13 | 251 | 503810 | 2378.64 | 1044 | 1020 | 211.4 |
| A | 15 | 223 | 503562 | 2377.47 | 1044 | 1020 | 211.4 |
| B | 4 | 239 | 1141572 | 5571.09 | 1072 | 1046 | 204.7 |
| B | 4 | 81 | 45943 | 219.31 | 1072 | 1046 | 204.7 |
| B | 15 | 204 | 42639 | 203.17 | 1072 | 1046 | 204.7 |
| C | 13 | 61 | 7827 | 27.83 | 1047 | 1047 | 243.6 |
| C | 8 | 222 | 6064 | 20.59 | 1047 | 1047 | 243.6 |
| C | 5 | 207 | 3728 | 11.0 | 1047 | 1047 | 243.6 |
| D | 1 | 52 | 393909 | 1575.56 | 1038 | 1007 | 249.4 |
| D | 8 | 195 | 241504 | 964.4 | 1038 | 1007 | 249.4 |
| D | 10 | 253 | 77244 | 305.71 | 1038 | 1007 | 249.4 |
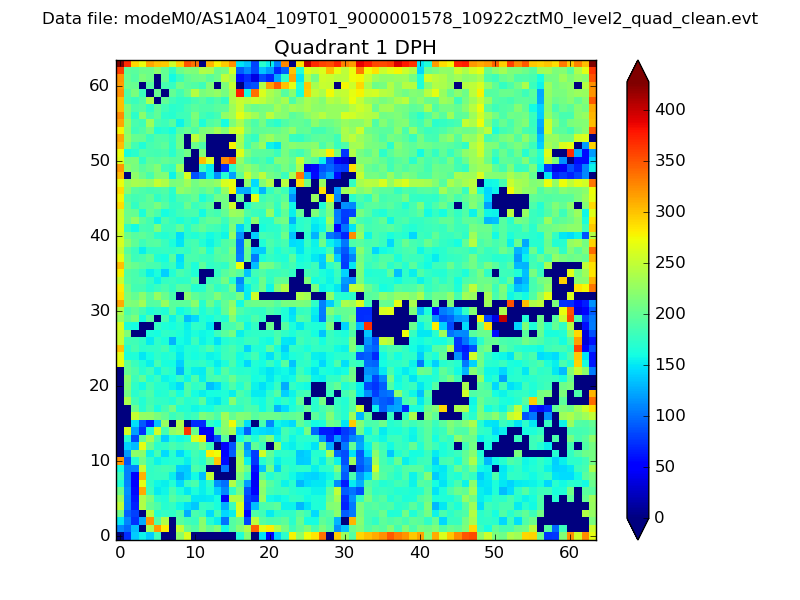
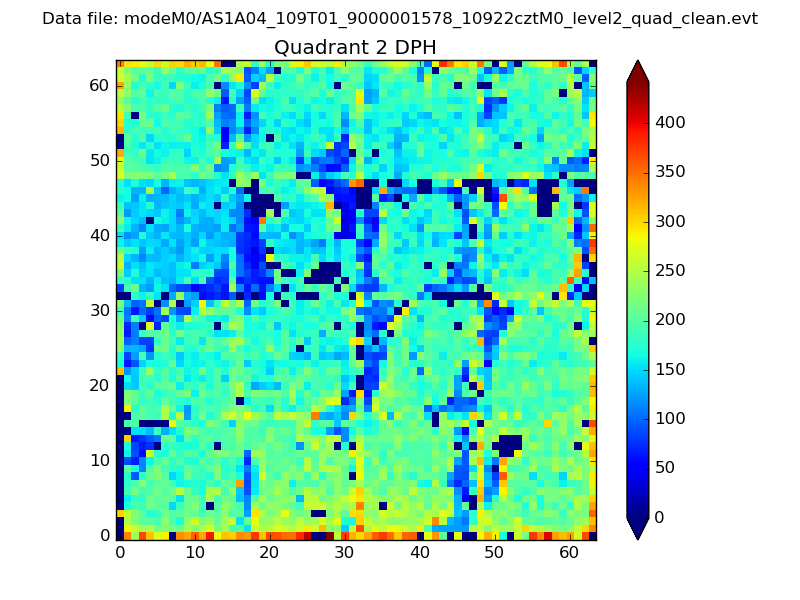
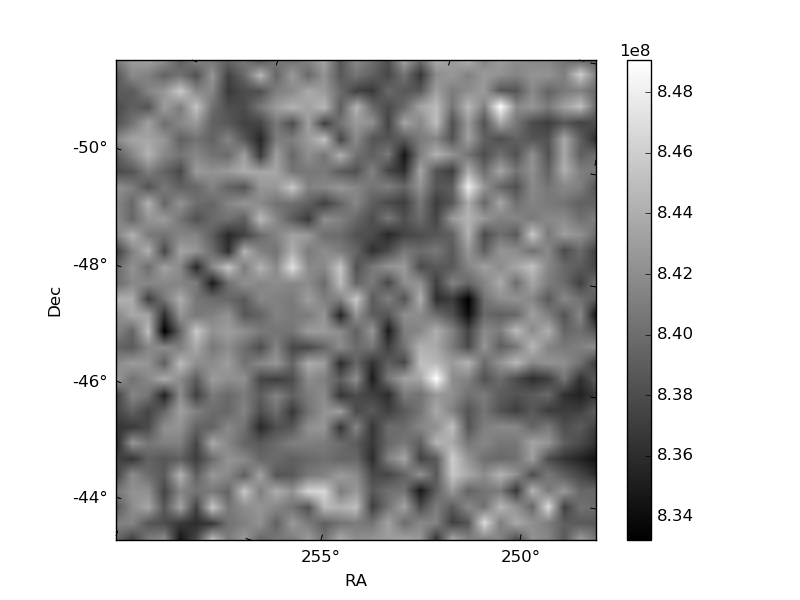
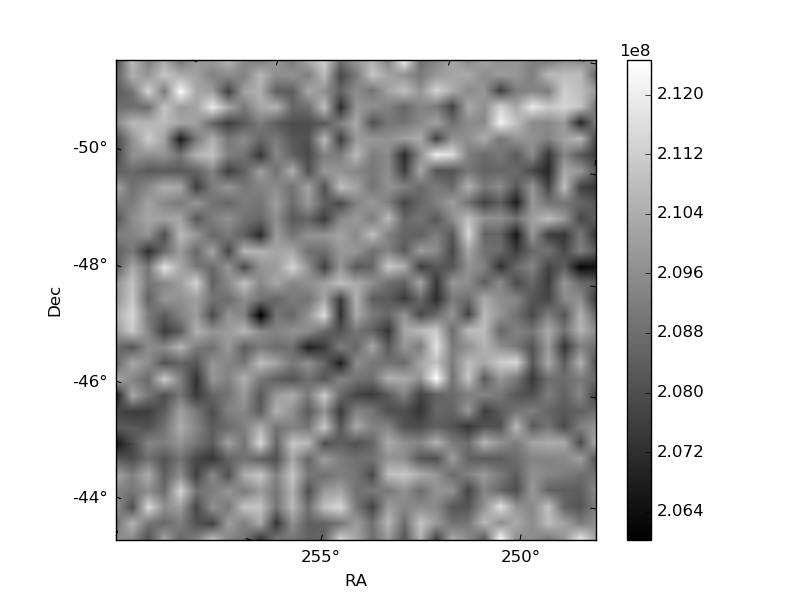
Histogram calculated using DETX and DETY for each event in the final _common_clean file
| Quadrant A | 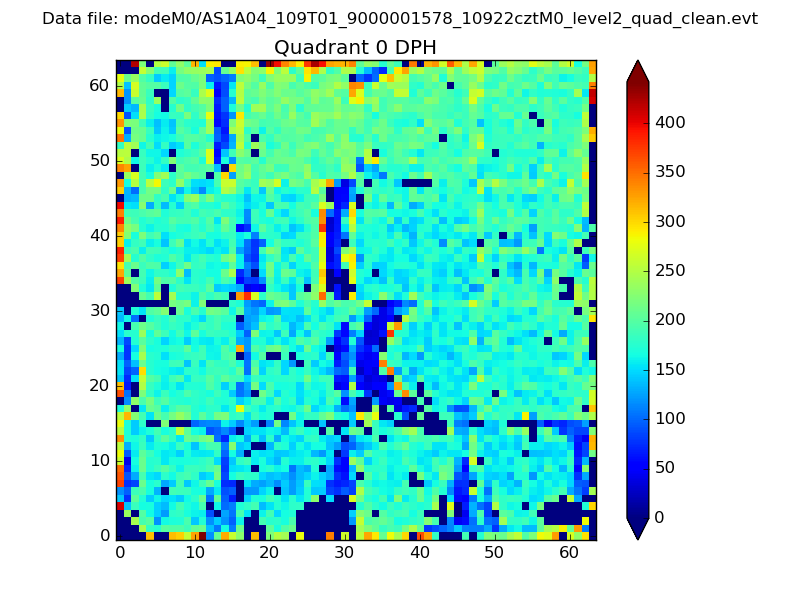 |
 |
Quadrant B |
|---|---|---|---|
| Quadrant D | 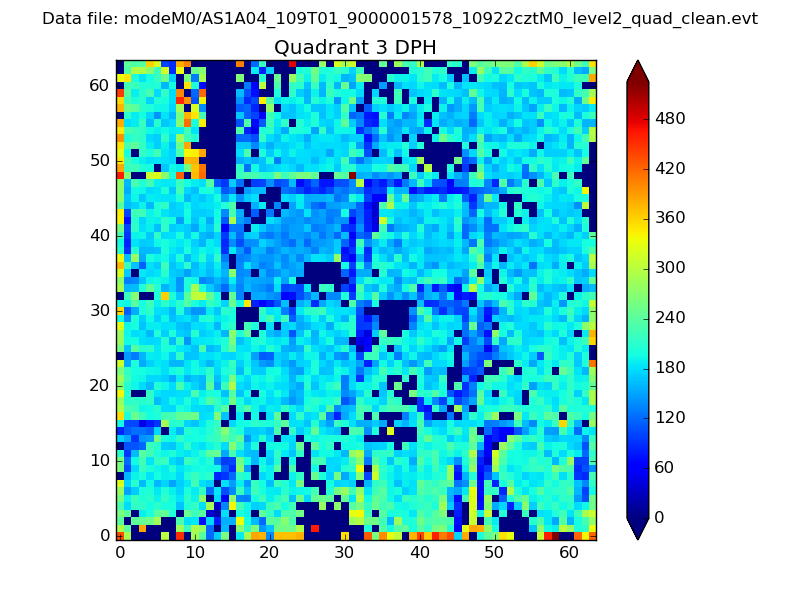 |
 |
Quadrant C |
| Plot type | Count rate plots | Images |
|---|---|---|
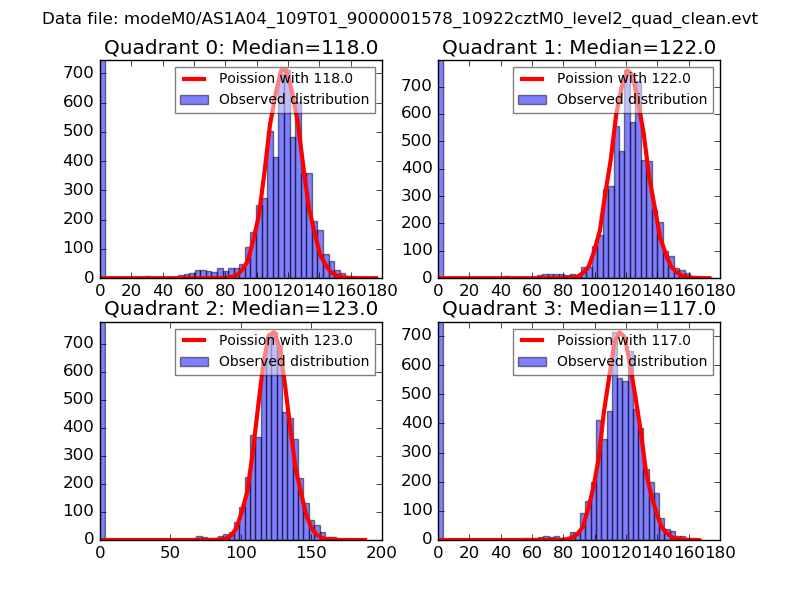
| Comparison with Poisson distribution Blue bars denote a histogram of data divided into 1 sec bins. Red curve is a Poisson curve with rate = median count rate of data. |
 |
 |
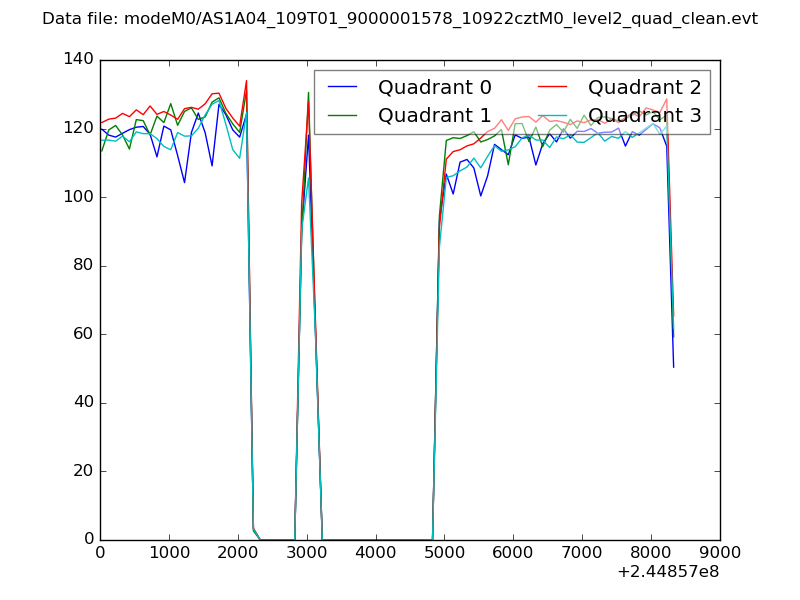
| Quadrant-wise count rates Data is divided into 100 sec bins |
 |
|
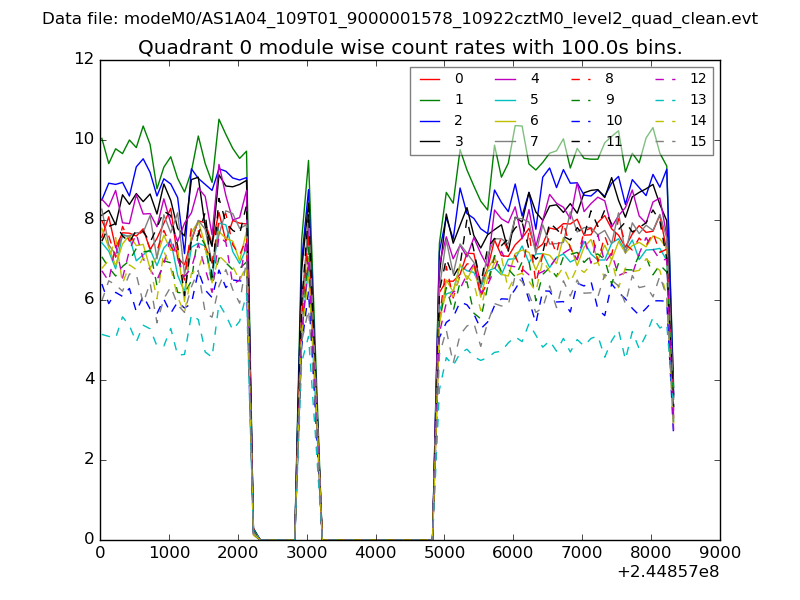
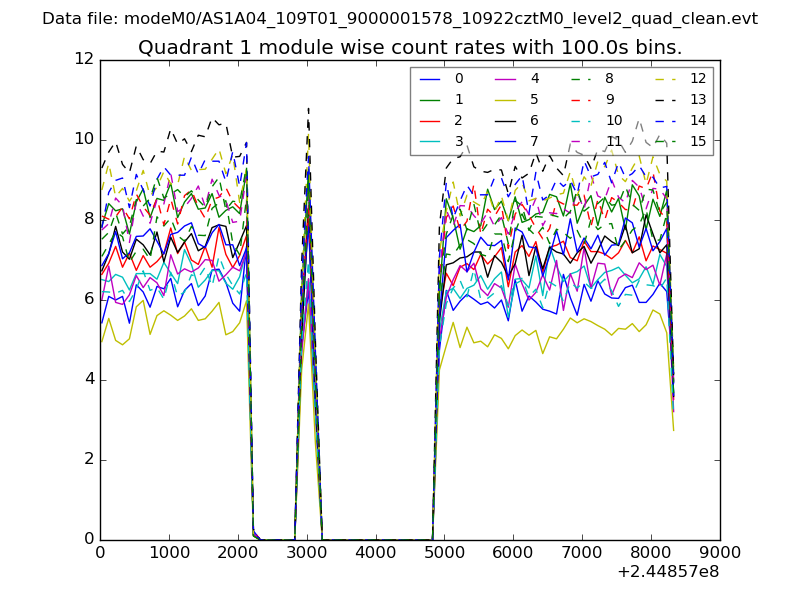
| Module-wise count rates for Quadrant A Data is divided into 100 sec bins |
 |
 |
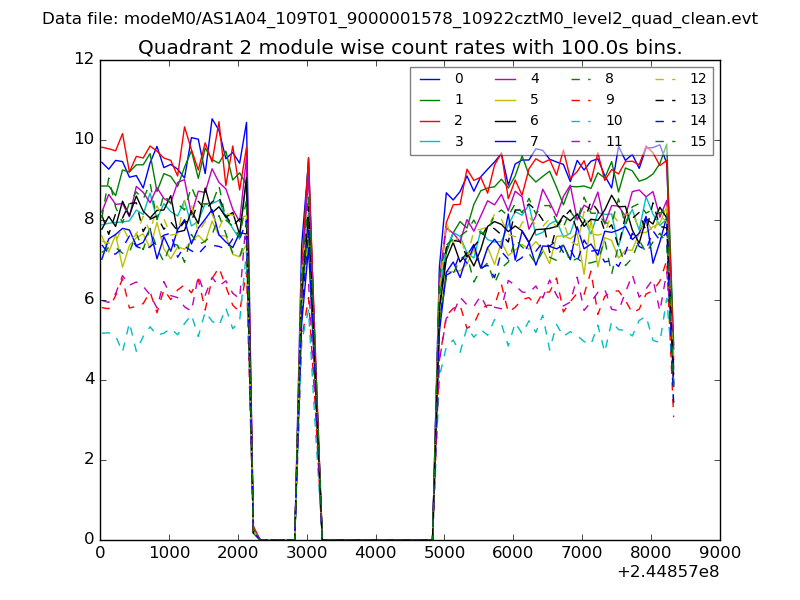
| Module-wise count rates for Quadrant B Data is divided into 100 sec bins |
 |
 |
| Module-wise count rates for Quadrant C Data is divided into 100 sec bins |
 |
 |
| Module-wise count rates for Quadrant D Data is divided into 100 sec bins |
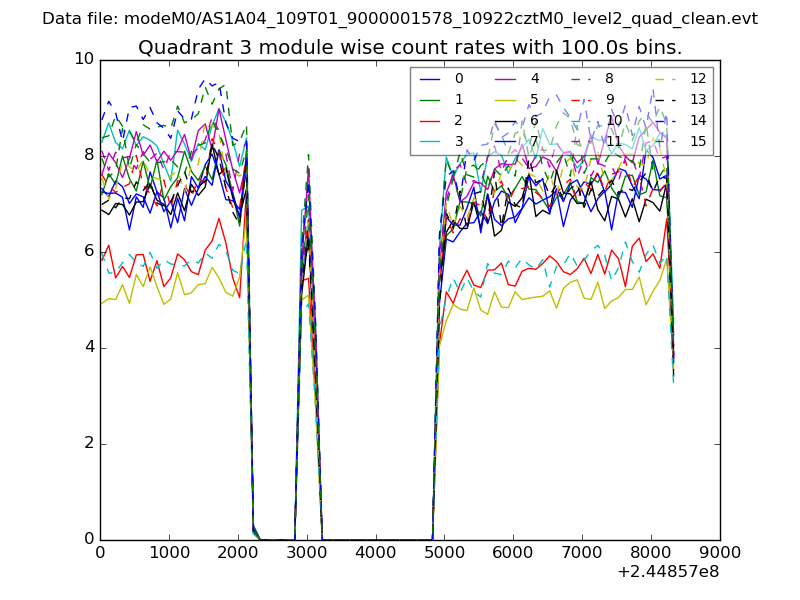 |
 |
| Parameter | Plot |
|---|---|
| CZT HV Monitor | 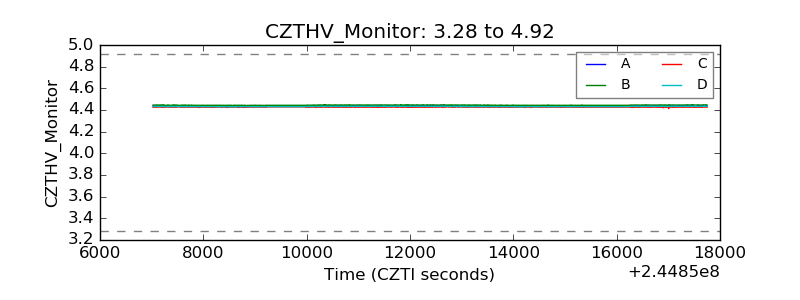 |
| D_VDD | 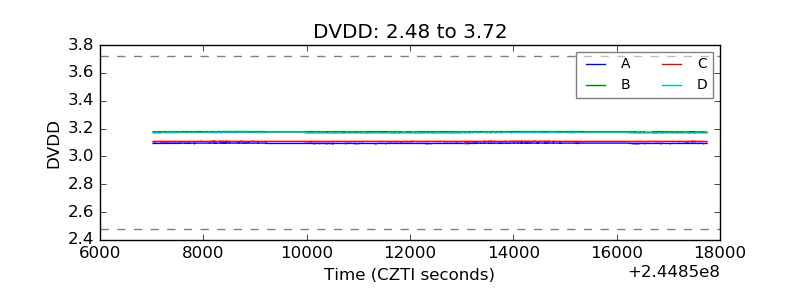 |
| Temperature 1 | 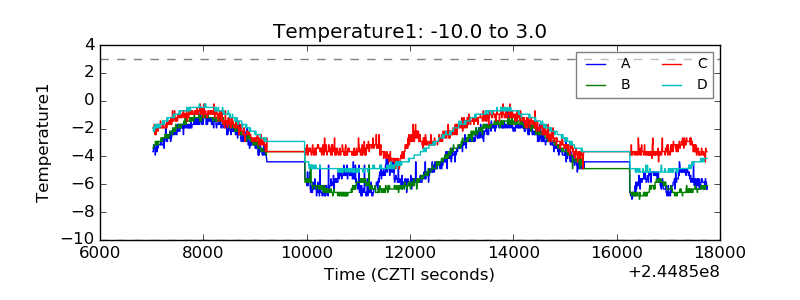 |
| Veto HV Monitor |  |
| Veto LLD | 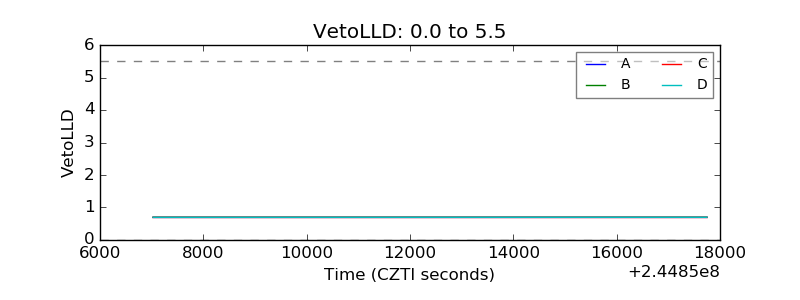 |
| Alpha Counter | 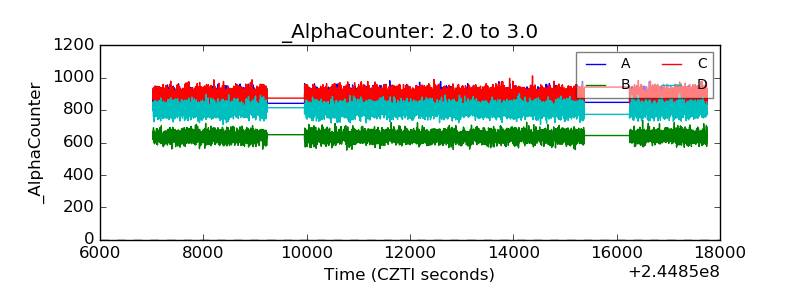 |
| _CPM_Rate | 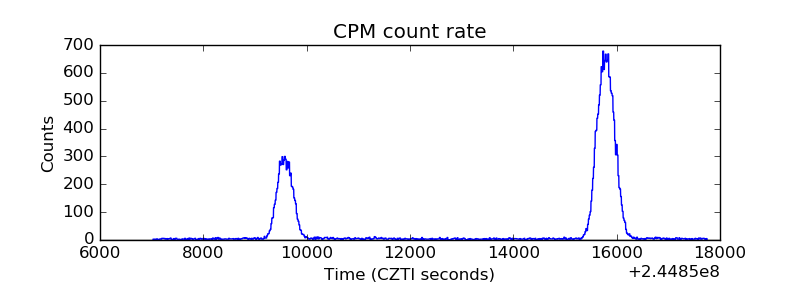 |
| CZT Counter | 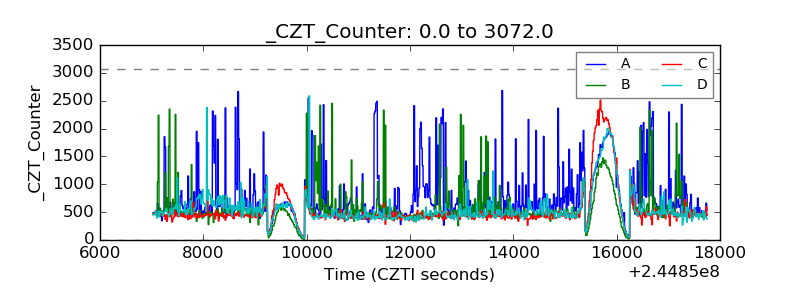 |
| +2.5 Volts monitor |  |
| +5 Volts monitor |  |
| _ROLL_ROT | 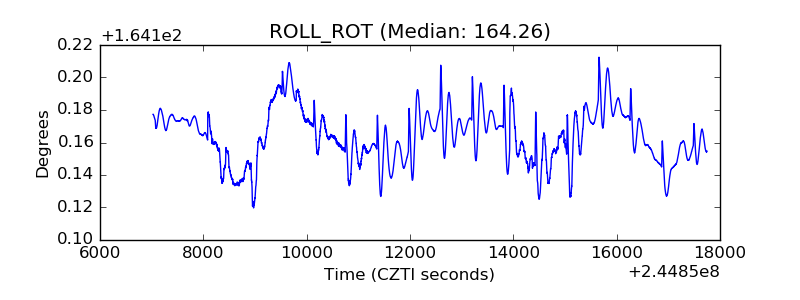 |
| _Roll_DEC | 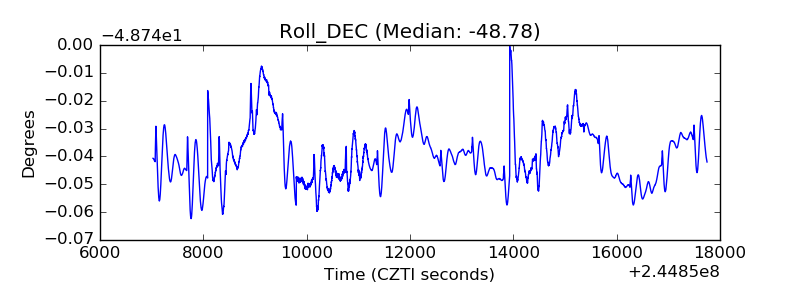 |
| _Roll_RA | 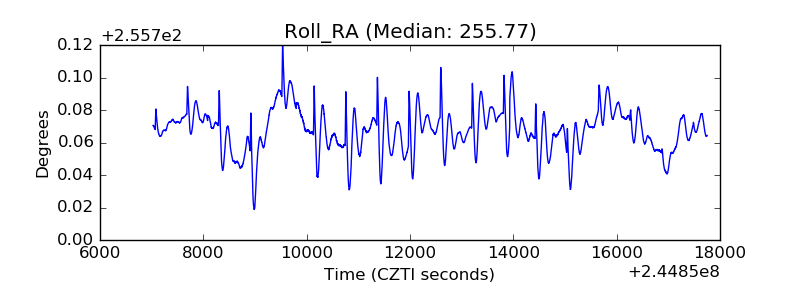 |
| Veto Counter | 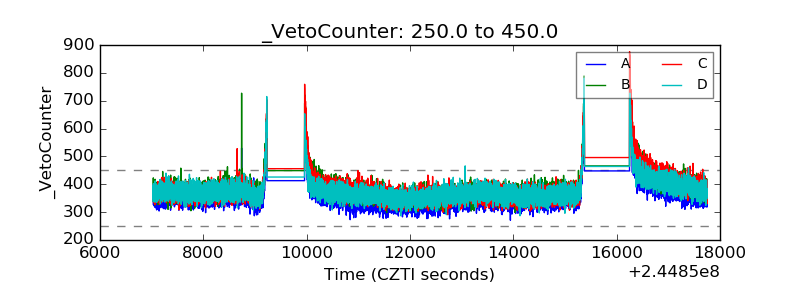 |