| Param | Original file | Final file |
|---|---|---|
| Filename | modeM0/AS1A04_109T01_9000001578_10925cztM0_level2.evt | modeM0/AS1A04_109T01_9000001578_10925cztM0_level2_quad_clean.evt |
| Size (bytes) | 518,368,320 | 93,908,160 |
| Size | 494.4 MB | 89.6 MB |
| Events in quadrant A | 4,418,690 | 596,619 |
| Events in quadrant B | 4,136,881 | 606,176 |
| Events in quadrant C | 3,096,409 | 614,398 |
| Events in quadrant D | 3,608,294 | 575,634 |
| Mode SS | |||
|---|---|---|---|
| Quadrant | BADHDUFLAG | Total packets | Discarded packets |
| A | 0 | 130 | 0 |
| B | 0 | 130 | 0 |
| C | 0 | 130 | 0 |
| D | 0 | 130 | 0 |
| Mode M9 | |||
|---|---|---|---|
| Quadrant | BADHDUFLAG | Total packets | Discarded packets |
| A | 0 | 14 | 0 |
| B | 0 | 14 | 0 |
| C | 0 | 14 | 0 |
| D | 0 | 15 | 0 |
| Mode M0 | |||
|---|---|---|---|
| Quadrant | BADHDUFLAG | Total packets | Discarded packets |
| A | 0 | 17445 | 3 |
| B | 0 | 16402 | 2 |
| C | 0 | 13492 | 2 |
| D | 0 | 15052 | 2 |
| Quadrant | Total seconds | Saturated seconds | Saturation percentage |
|---|---|---|---|
| A | 6468 | 208 | 3.215832% |
| B | 6468 | 311 | 4.808287% |
| C | 6468 | 68 | 1.051330% |
| D | 6468 | 237 | 3.664193% |
Noise dominated data is calculated using 1-second bins in cleaned event files. If a bin has >2000 counts, and if more than 50% of those come from <1% of pixels, then it is considered to be noise-dominated and hence unusable.
| Quadrant | # 1 sec bins | Bins with >0 counts | Bins with >2000 counts | High rate bins dominated by noise | Noise dominated (total time) | Noise dominated (detector-on time) | Marked lightcurve |
|---|---|---|---|---|---|---|---|
| A | 7608 | 6468 | 91 | 91 | 1.20% | 1.41% | 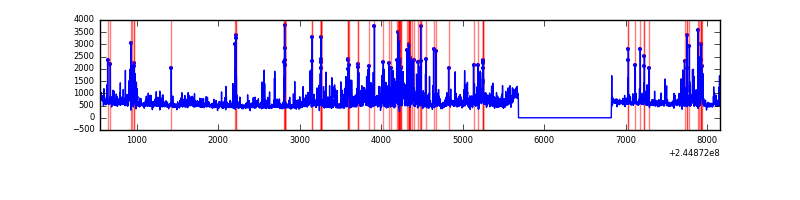 |
| B | 7608 | 6468 | 147 | 147 | 1.93% | 2.27% | 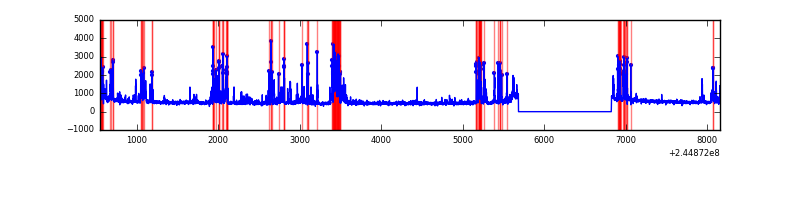 |
| C | 7608 | 6468 | 0 | 0 | 0.00% | 0.00% | 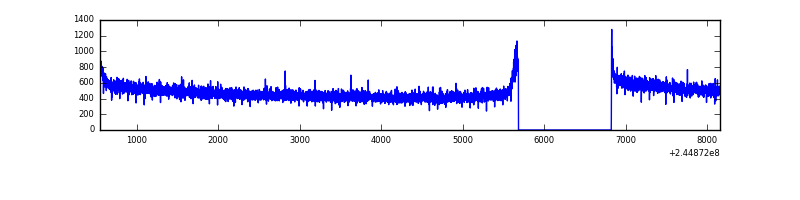 |
| D | 7608 | 6468 | 153 | 153 | 2.01% | 2.37% |  |
Top three noisy pixels from each quadrant. If the there are fewer than three noisy pixels in the level2.evt file, extra rows are filled as -1
| Pixel properties | Quadrant properties | ||||||
|---|---|---|---|---|---|---|---|
| Quadrant | DetID | PixID | Counts | Sigma | Mean | Median | Sigma |
| A | 8 | 5 | 913922 | 5638.79 | 805 | 789 | 161.9 |
| A | 13 | 251 | 160137 | 984.01 | 805 | 789 | 161.9 |
| A | 15 | 223 | 105164 | 644.54 | 805 | 789 | 161.9 |
| B | 4 | 239 | 941162 | 6237.85 | 799 | 780 | 150.8 |
| B | 11 | 51 | 32330 | 209.28 | 799 | 780 | 150.8 |
| B | 0 | 214 | 21378 | 136.63 | 799 | 780 | 150.8 |
| C | 13 | 61 | 5864 | 27.82 | 793 | 799 | 182.0 |
| C | 8 | 222 | 3229 | 13.35 | 793 | 799 | 182.0 |
| C | 5 | 207 | 2464 | 9.15 | 793 | 799 | 182.0 |
| D | 1 | 52 | 268206 | 1426.45 | 783 | 759 | 187.5 |
| D | 5 | 97 | 160170 | 850.23 | 783 | 759 | 187.5 |
| D | 13 | 104 | 96595 | 511.15 | 783 | 759 | 187.5 |
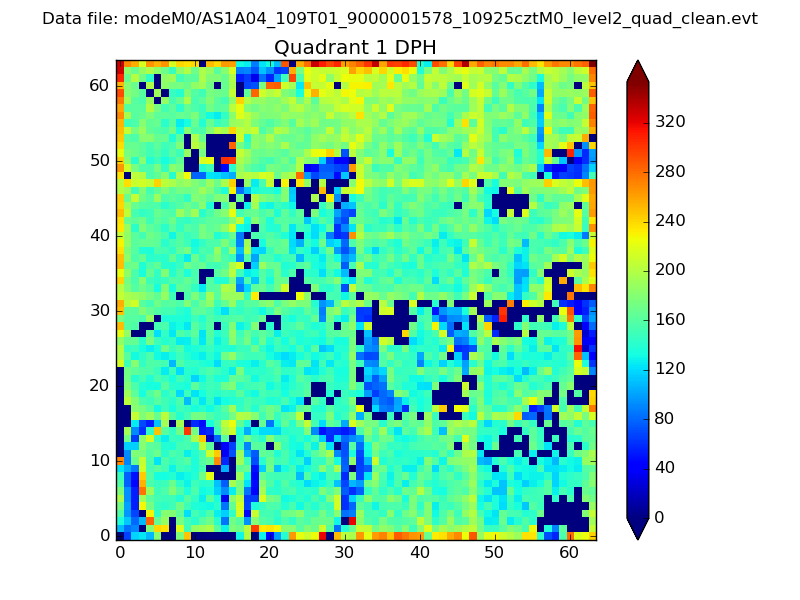
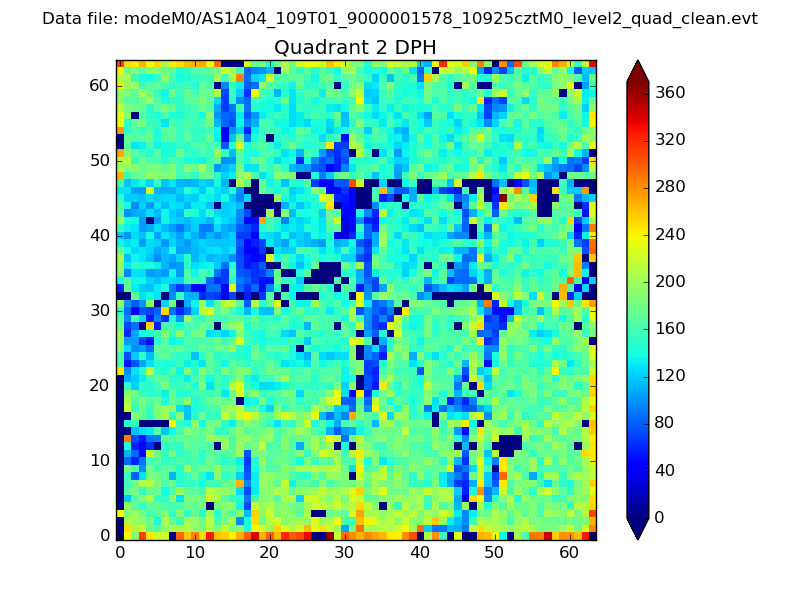
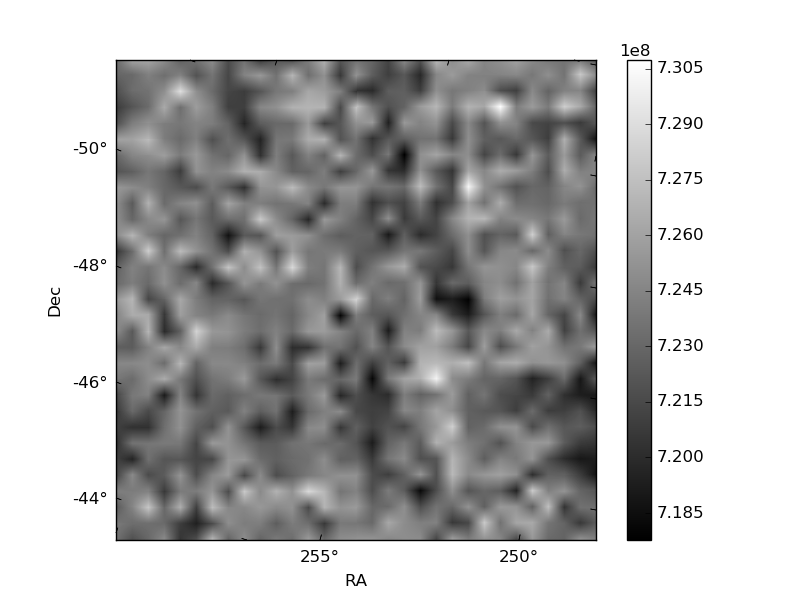
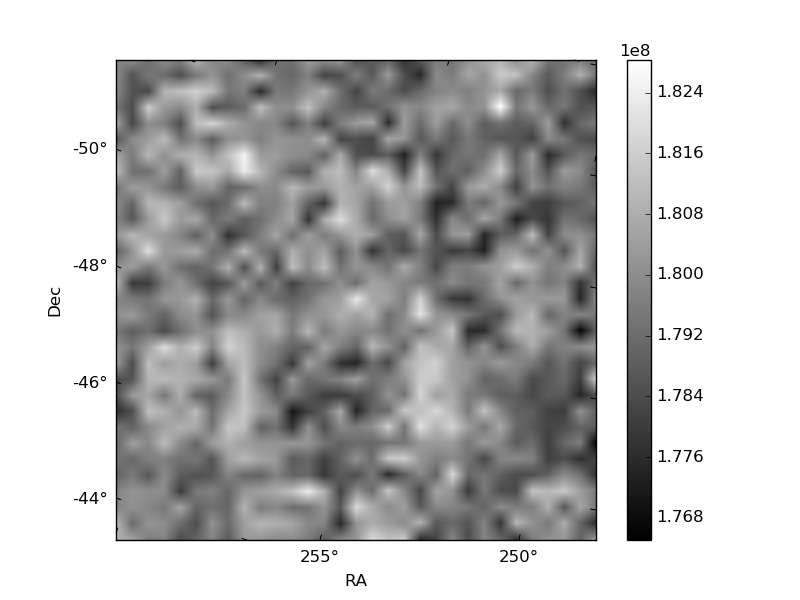
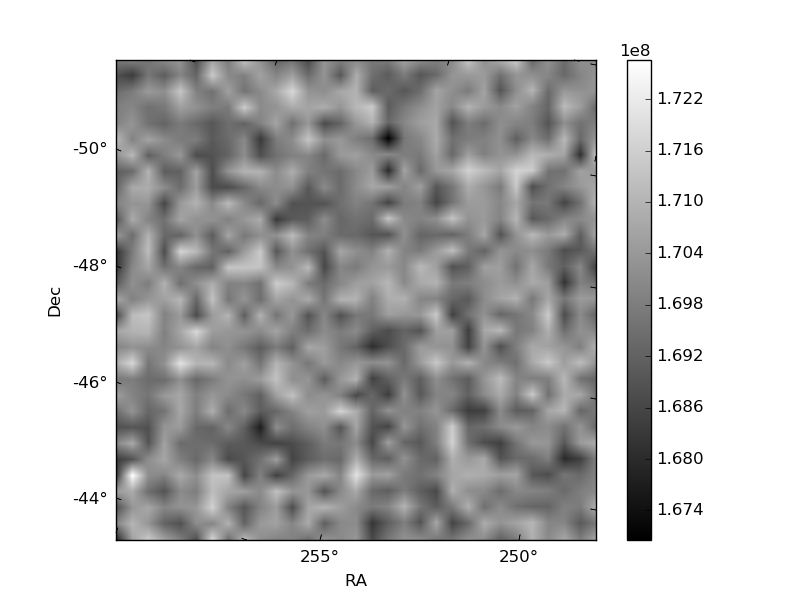
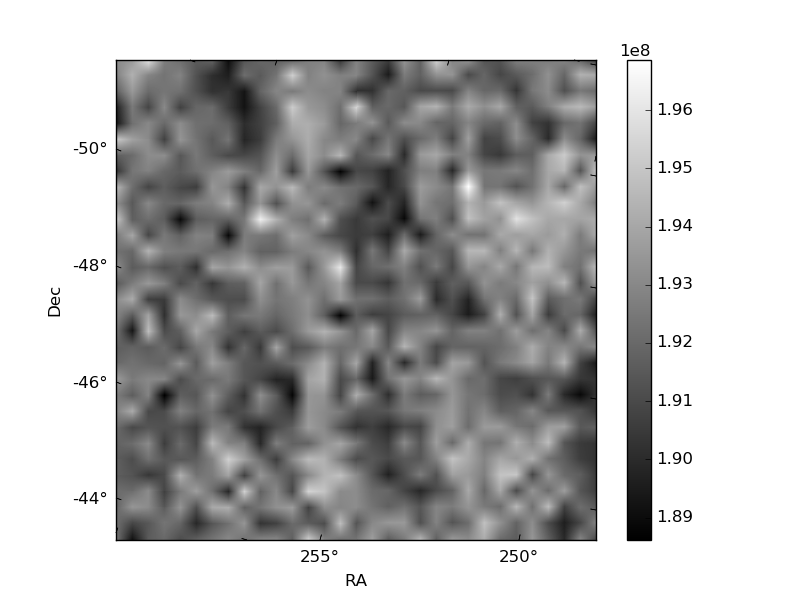
Histogram calculated using DETX and DETY for each event in the final _common_clean file
| Quadrant A | 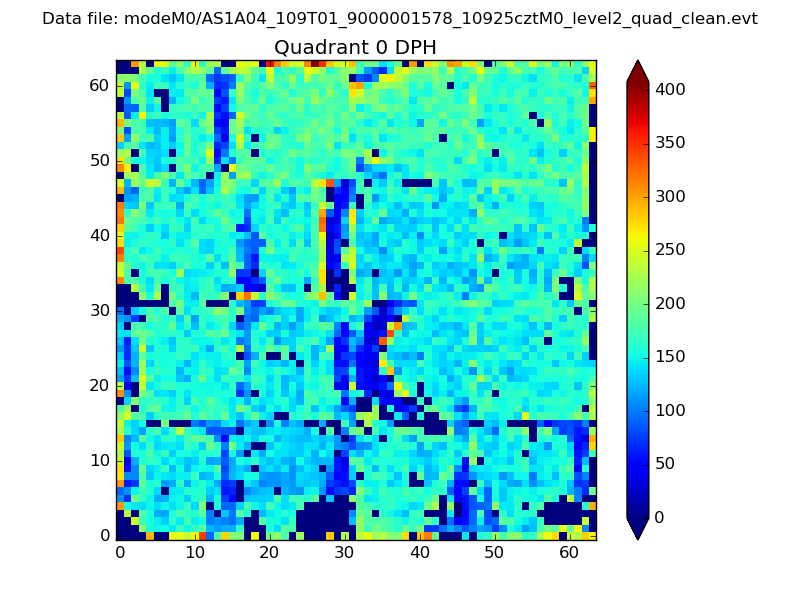 |
 |
Quadrant B |
|---|---|---|---|
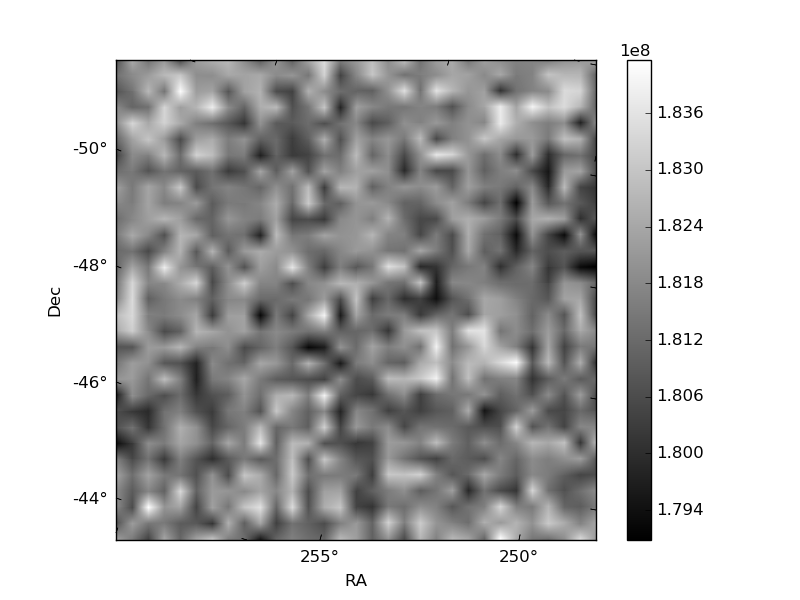
| Quadrant D | 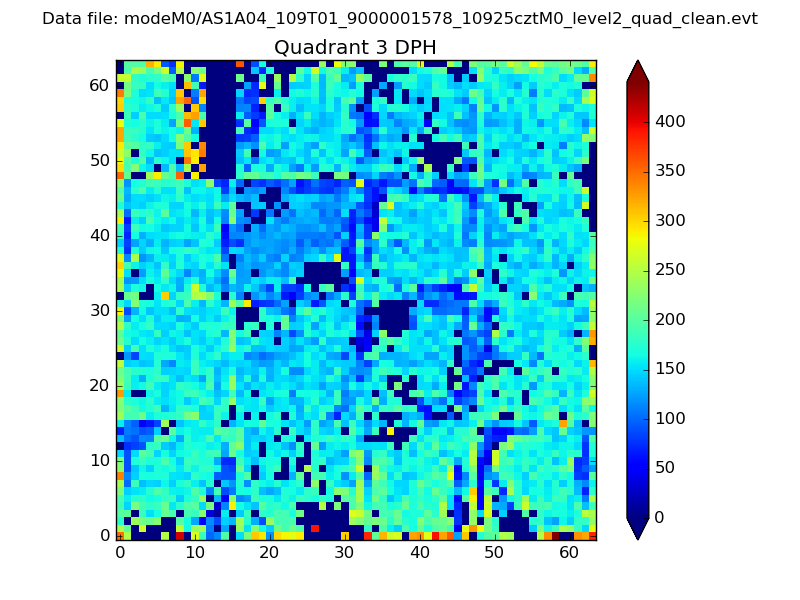 |
 |
Quadrant C |
| Plot type | Count rate plots | Images |
|---|---|---|
| Comparison with Poisson distribution Blue bars denote a histogram of data divided into 1 sec bins. Red curve is a Poisson curve with rate = median count rate of data. |
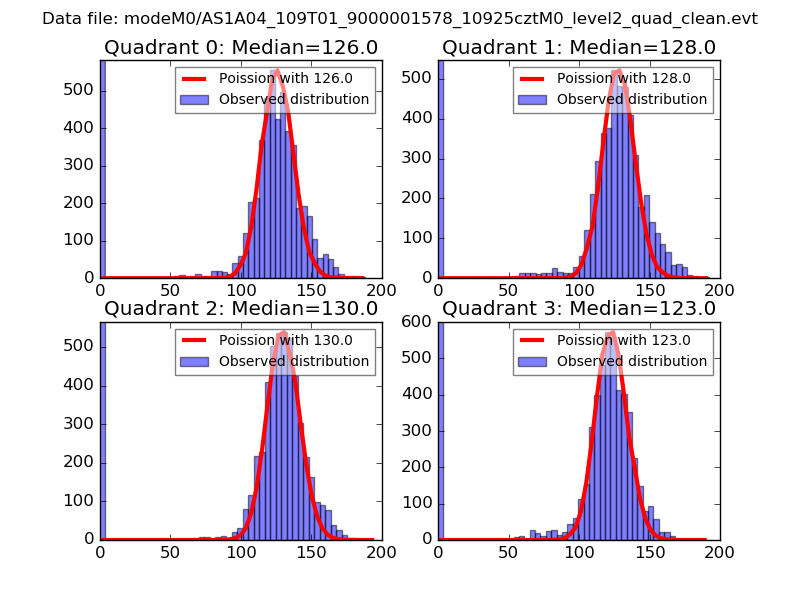 |
 |
| Quadrant-wise count rates Data is divided into 100 sec bins |
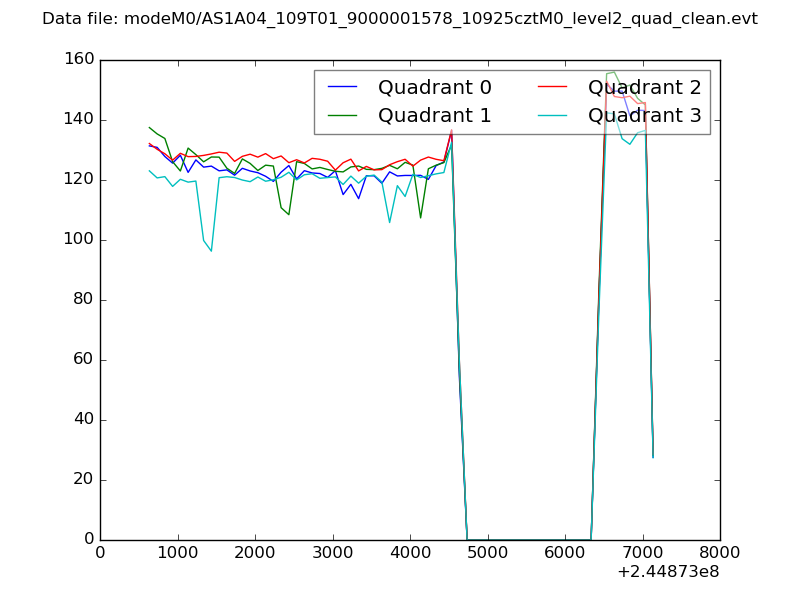 |
|
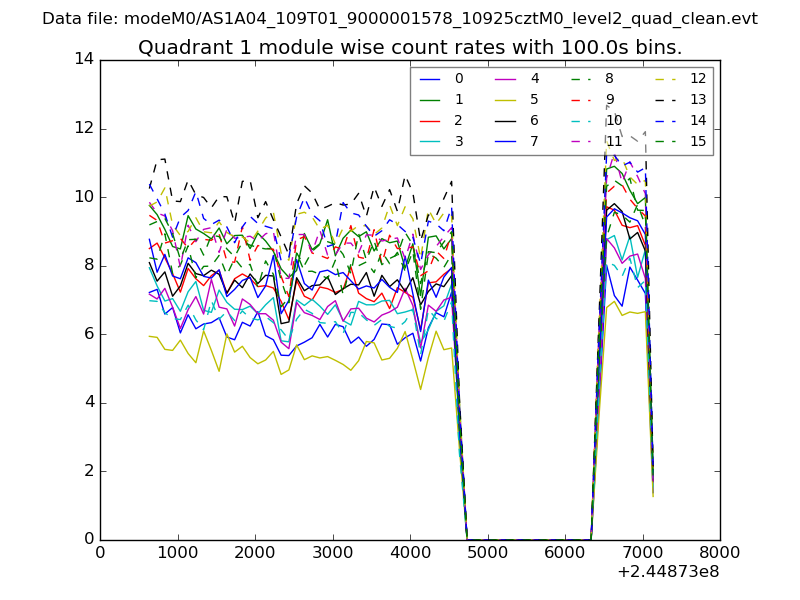
| Module-wise count rates for Quadrant A Data is divided into 100 sec bins |
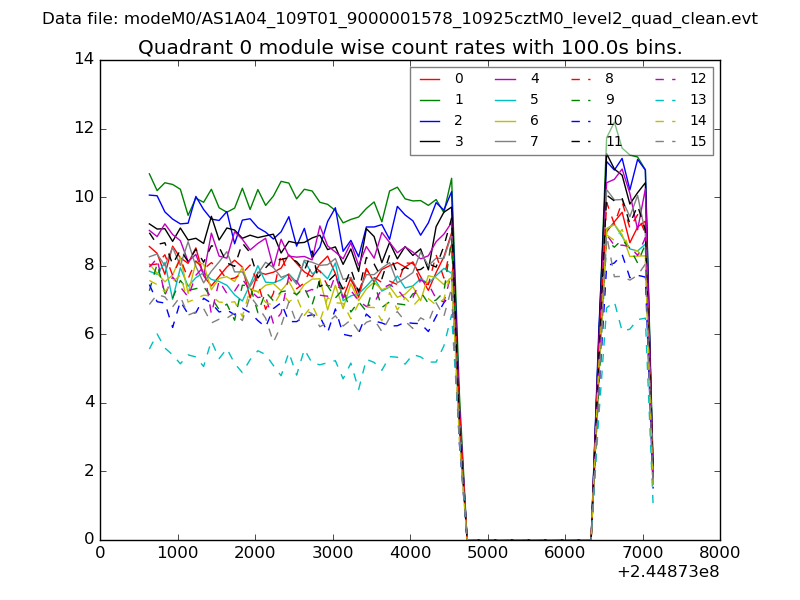 |
 |
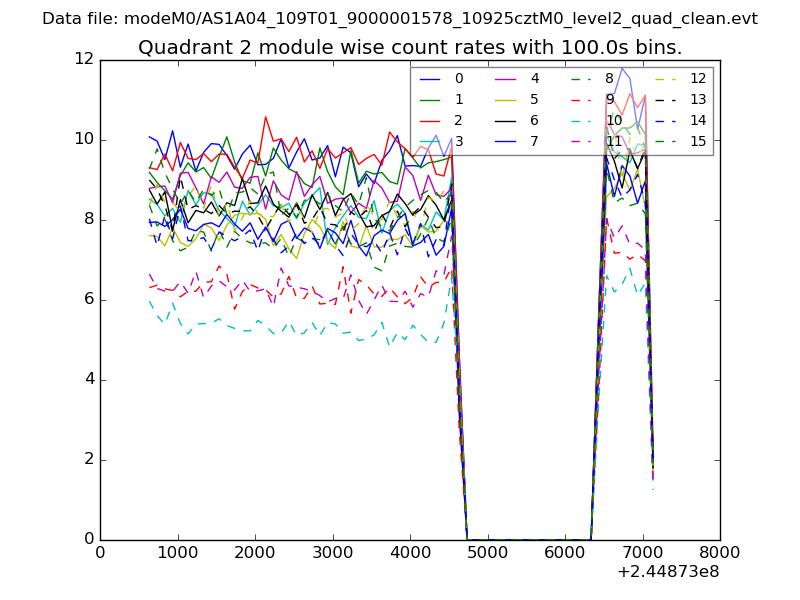
| Module-wise count rates for Quadrant B Data is divided into 100 sec bins |
 |
 |
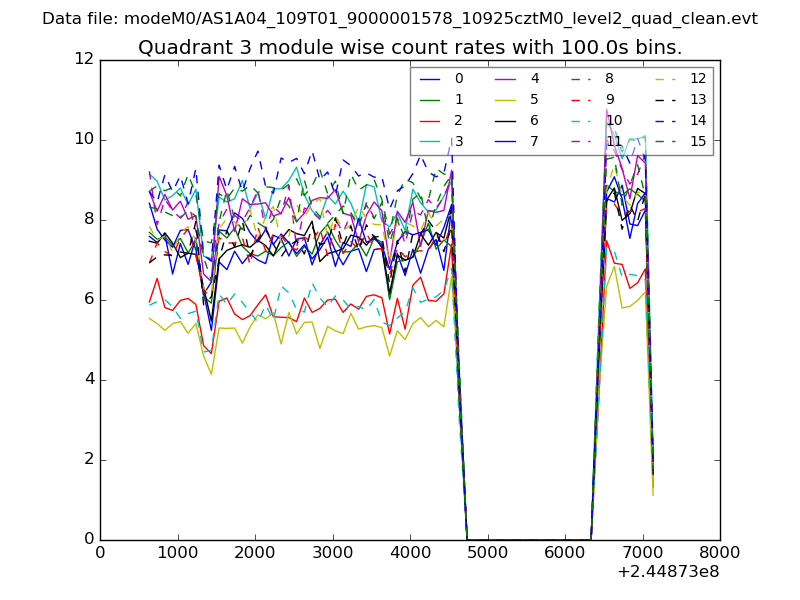
| Module-wise count rates for Quadrant C Data is divided into 100 sec bins |
 |
 |
| Module-wise count rates for Quadrant D Data is divided into 100 sec bins |
 |
 |
| Parameter | Plot |
|---|---|
| CZT HV Monitor | 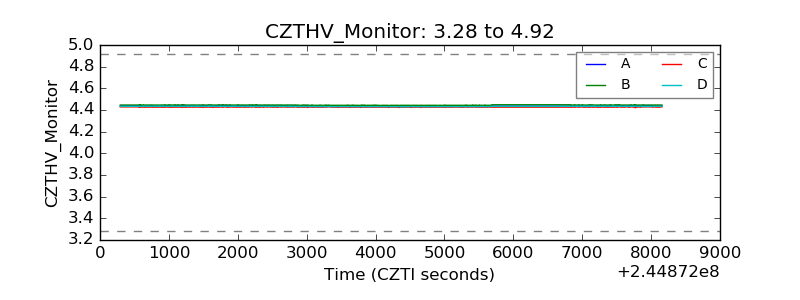 |
| D_VDD | 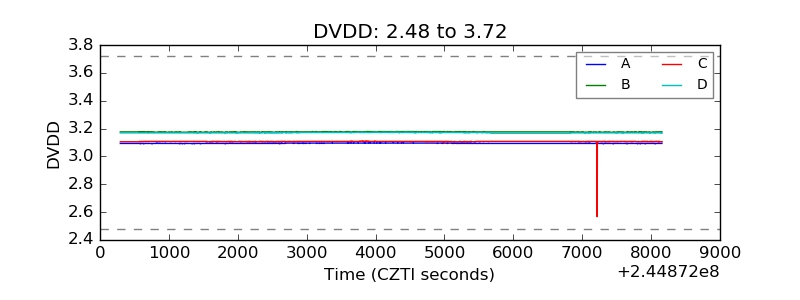 |
| Temperature 1 | 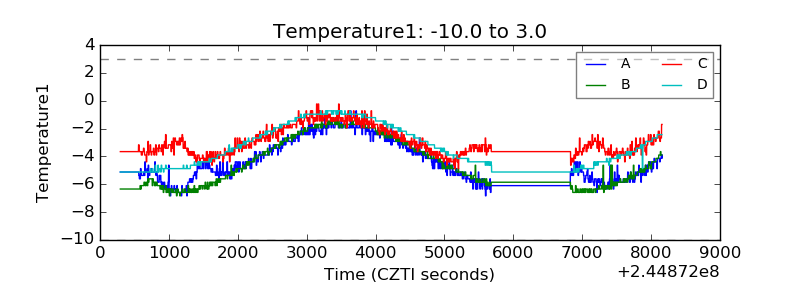 |
| Veto HV Monitor | 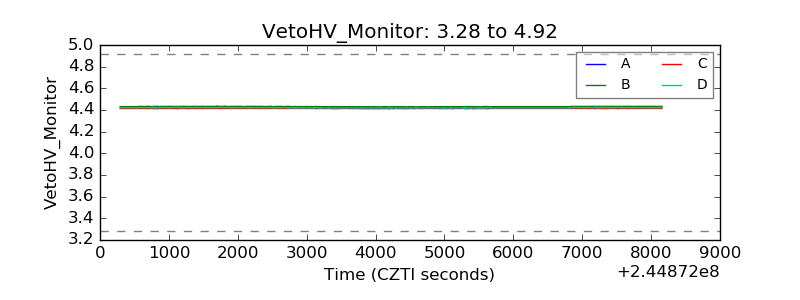 |
| Veto LLD | 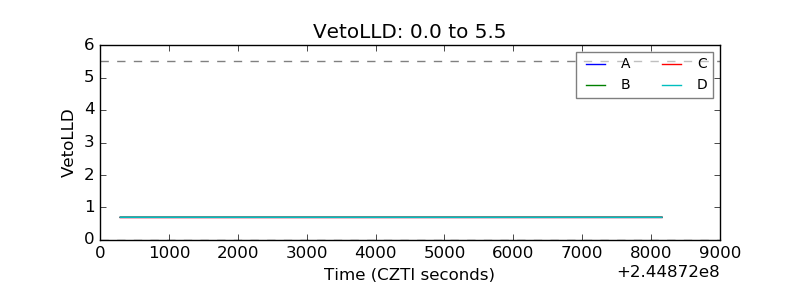 |
| Alpha Counter | 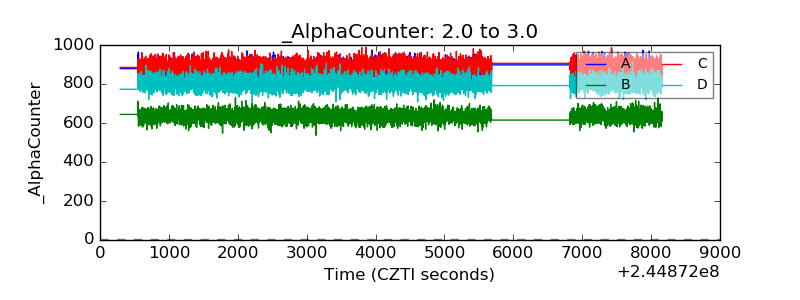 |
| _CPM_Rate | 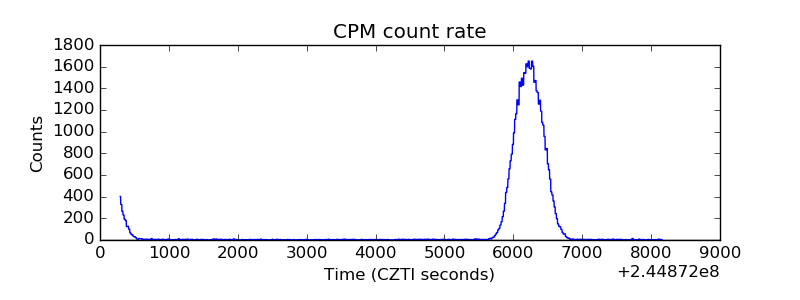 |
| CZT Counter | 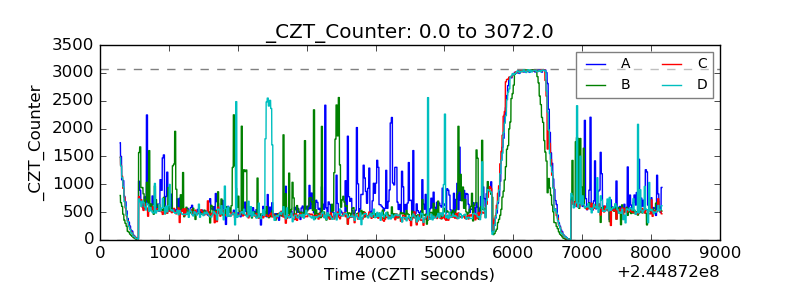 |
| +2.5 Volts monitor | 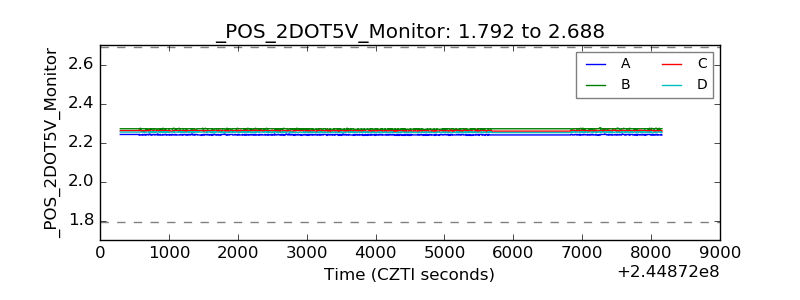 |
| +5 Volts monitor |  |
| _ROLL_ROT | 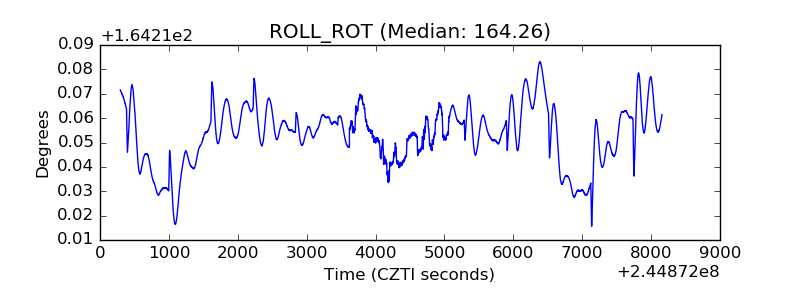 |
| _Roll_DEC | 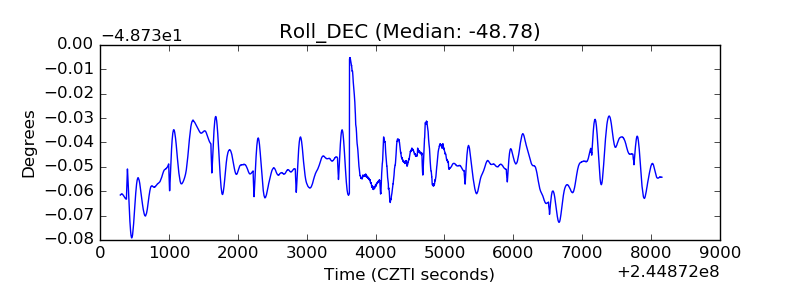 |
| _Roll_RA | 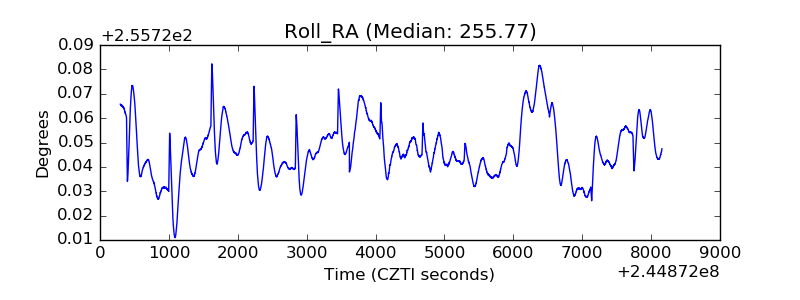 |
| Veto Counter | 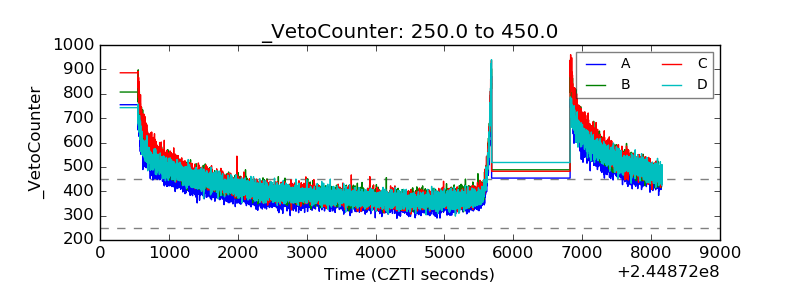 |