| Param | Original file | Final file |
|---|---|---|
| Filename | modeM0/AS1A04_109T01_9000001578_10926cztM0_level2.evt | modeM0/AS1A04_109T01_9000001578_10926cztM0_level2_quad_clean.evt |
| Size (bytes) | 255,712,320 | 52,836,480 |
| Size | 243.9 MB | 50.4 MB |
| Events in quadrant A | 2,285,979 | 338,962 |
| Events in quadrant B | 1,913,710 | 350,848 |
| Events in quadrant C | 1,519,013 | 353,776 |
| Events in quadrant D | 1,810,910 | 333,025 |
| Mode SS | |||
|---|---|---|---|
| Quadrant | BADHDUFLAG | Total packets | Discarded packets |
| A | 0 | 62 | 0 |
| B | 0 | 62 | 0 |
| C | 0 | 62 | 0 |
| D | 0 | 62 | 0 |
| Mode M0 | |||
|---|---|---|---|
| Quadrant | BADHDUFLAG | Total packets | Discarded packets |
| A | 0 | 8881 | 0 |
| B | 0 | 7644 | 0 |
| C | 0 | 6535 | 0 |
| D | 0 | 7323 | 0 |
| Quadrant | Total seconds | Saturated seconds | Saturation percentage |
|---|---|---|---|
| A | 3141 | 148 | 4.711875% |
| B | 3141 | 106 | 3.374721% |
| C | 3141 | 4 | 0.127348% |
| D | 3141 | 46 | 1.464502% |
Noise dominated data is calculated using 1-second bins in cleaned event files. If a bin has >2000 counts, and if more than 50% of those come from <1% of pixels, then it is considered to be noise-dominated and hence unusable.
| Quadrant | # 1 sec bins | Bins with >0 counts | Bins with >2000 counts | High rate bins dominated by noise | Noise dominated (total time) | Noise dominated (detector-on time) | Marked lightcurve |
|---|---|---|---|---|---|---|---|
| A | 3141 | 3141 | 100 | 100 | 3.18% | 3.18% | 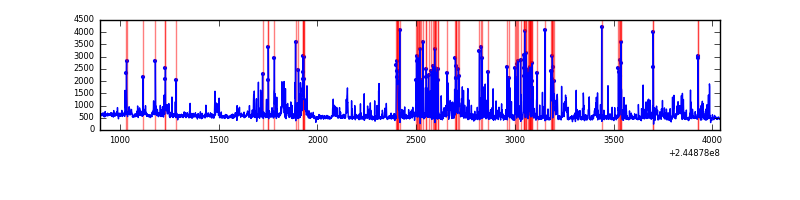 |
| B | 3141 | 3141 | 58 | 58 | 1.85% | 1.85% | 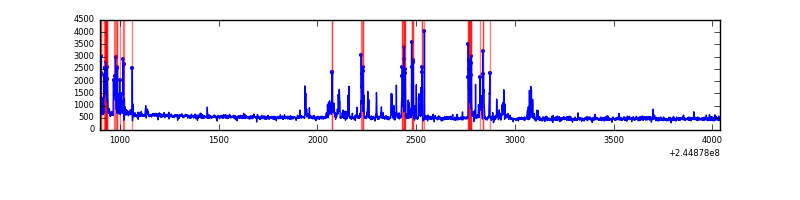 |
| C | 3141 | 3141 | 0 | 0 | 0.00% | 0.00% |  |
| D | 3141 | 3141 | 37 | 37 | 1.18% | 1.18% | 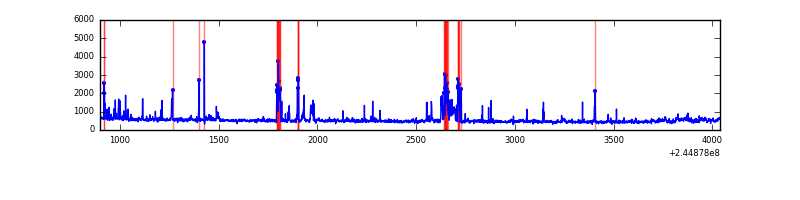 |
Top three noisy pixels from each quadrant. If the there are fewer than three noisy pixels in the level2.evt file, extra rows are filled as -1
| Pixel properties | Quadrant properties | ||||||
|---|---|---|---|---|---|---|---|
| Quadrant | DetID | PixID | Counts | Sigma | Mean | Median | Sigma |
| A | 8 | 5 | 421738 | 5296.55 | 394 | 388 | 79.6 |
| A | 15 | 223 | 211948 | 2659.4 | 394 | 388 | 79.6 |
| A | 15 | 239 | 85059 | 1064.35 | 394 | 388 | 79.6 |
| B | 4 | 239 | 347382 | 4677.61 | 393 | 385 | 74.2 |
| B | 0 | 214 | 11985 | 156.37 | 393 | 385 | 74.2 |
| B | 11 | 51 | 9656 | 124.98 | 393 | 385 | 74.2 |
| C | 13 | 61 | 3040 | 29.45 | 389 | 391 | 90.0 |
| C | 8 | 222 | 1428 | 11.53 | 389 | 391 | 90.0 |
| C | 12 | 4 | 1168 | 8.64 | 389 | 391 | 90.0 |
| D | 5 | 97 | 174585 | 1873.77 | 389 | 378 | 93.0 |
| D | 8 | 195 | 48967 | 522.62 | 389 | 378 | 93.0 |
| D | 13 | 249 | 46401 | 495.02 | 389 | 378 | 93.0 |
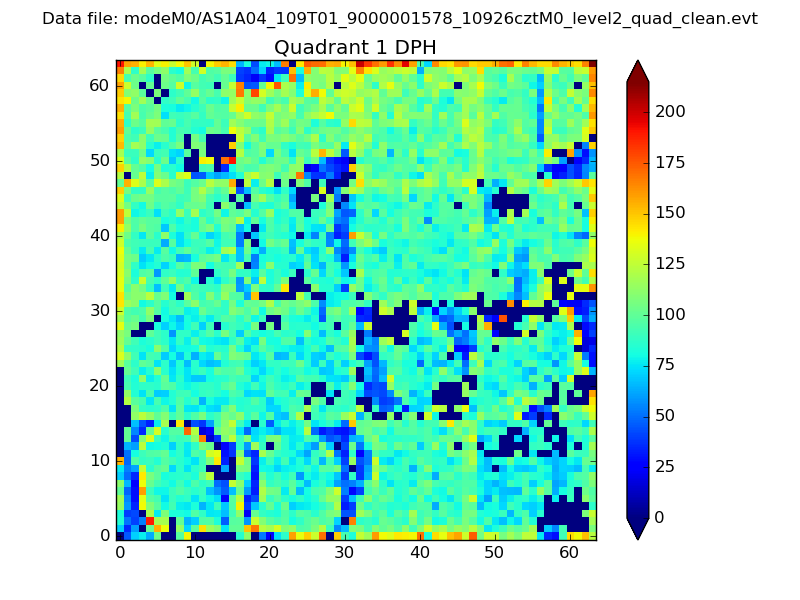
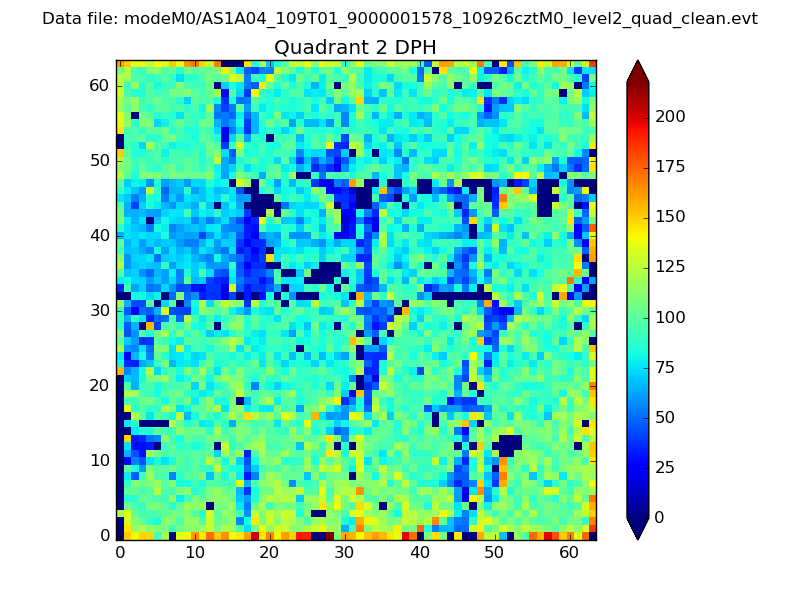
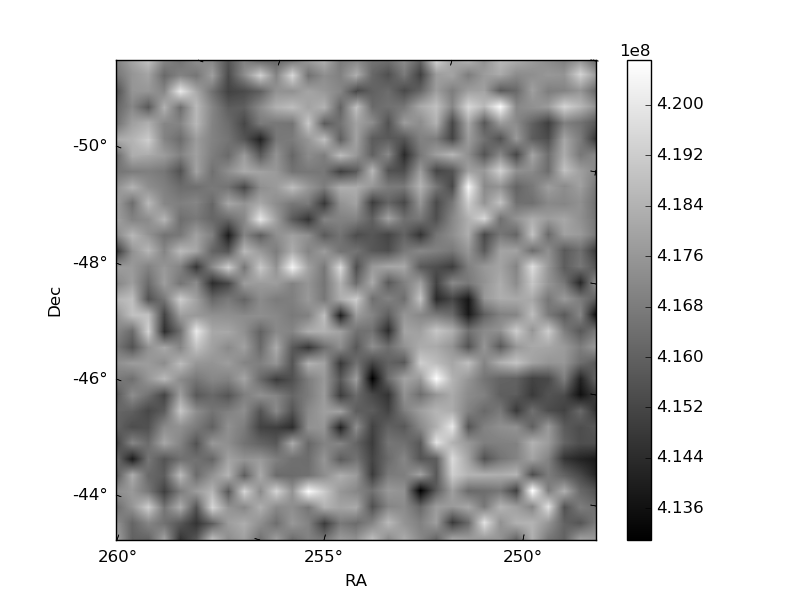
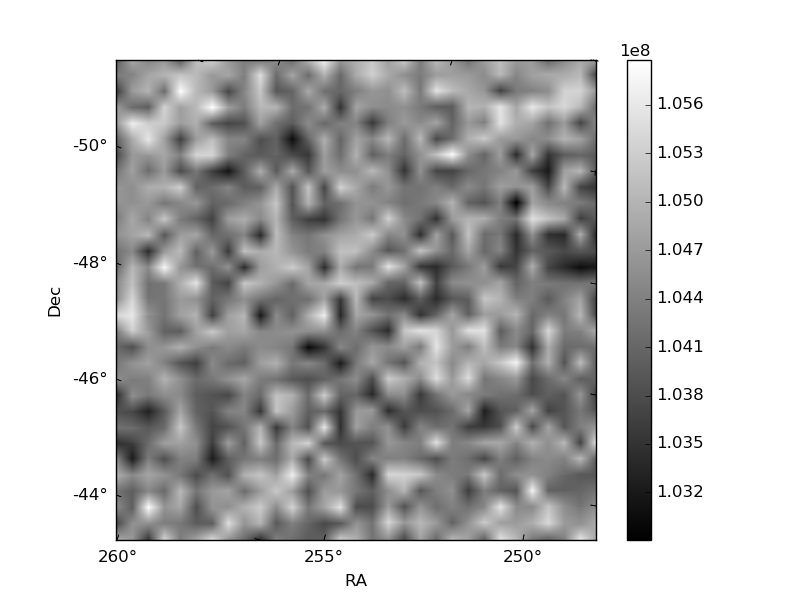
Histogram calculated using DETX and DETY for each event in the final _common_clean file
| Quadrant A | 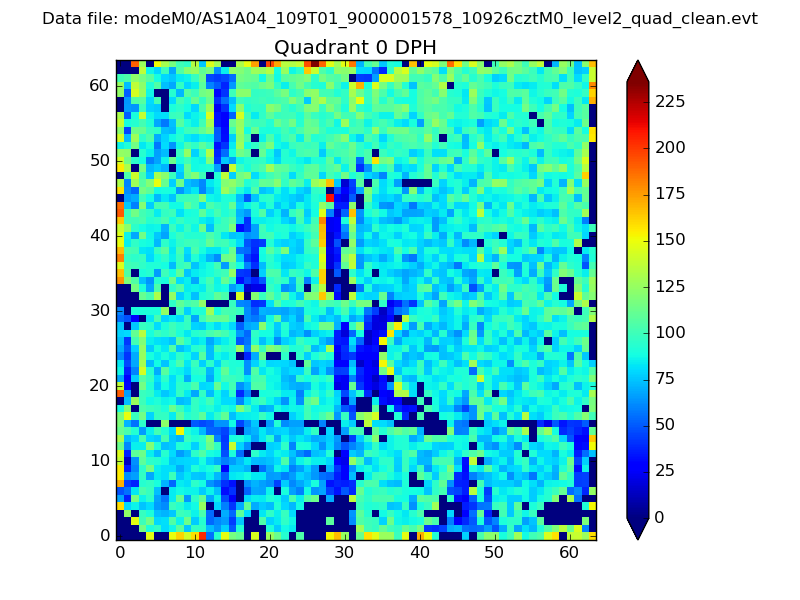 |
 |
Quadrant B |
|---|---|---|---|
| Quadrant D | 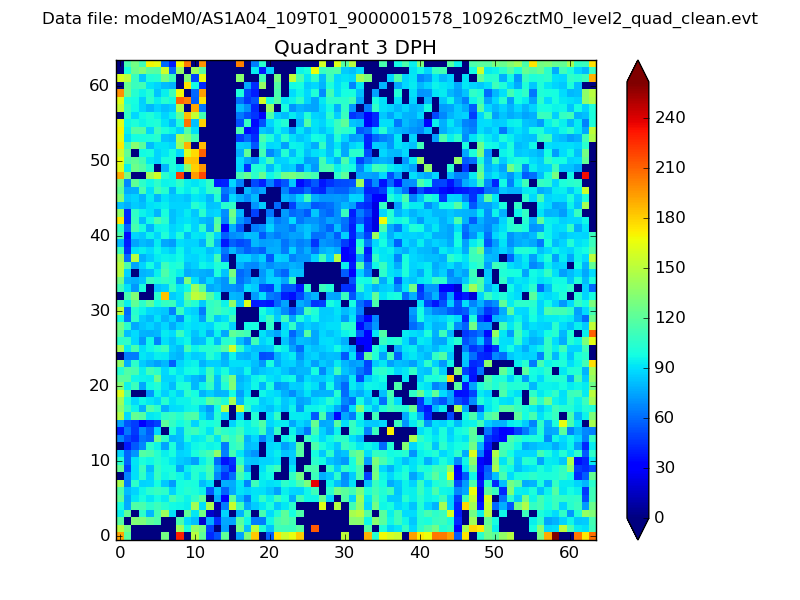 |
 |
Quadrant C |
| Plot type | Count rate plots | Images |
|---|---|---|
| Comparison with Poisson distribution Blue bars denote a histogram of data divided into 1 sec bins. Red curve is a Poisson curve with rate = median count rate of data. |
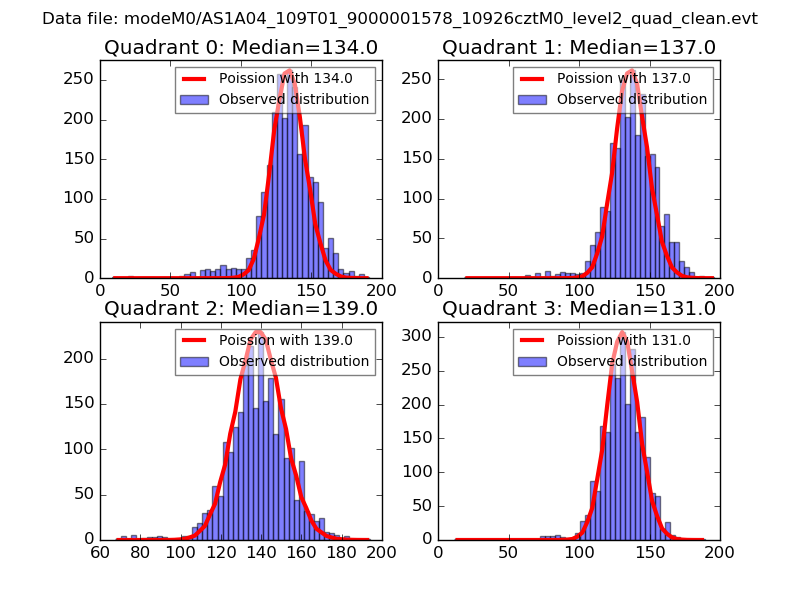 |
 |
| Quadrant-wise count rates Data is divided into 100 sec bins |
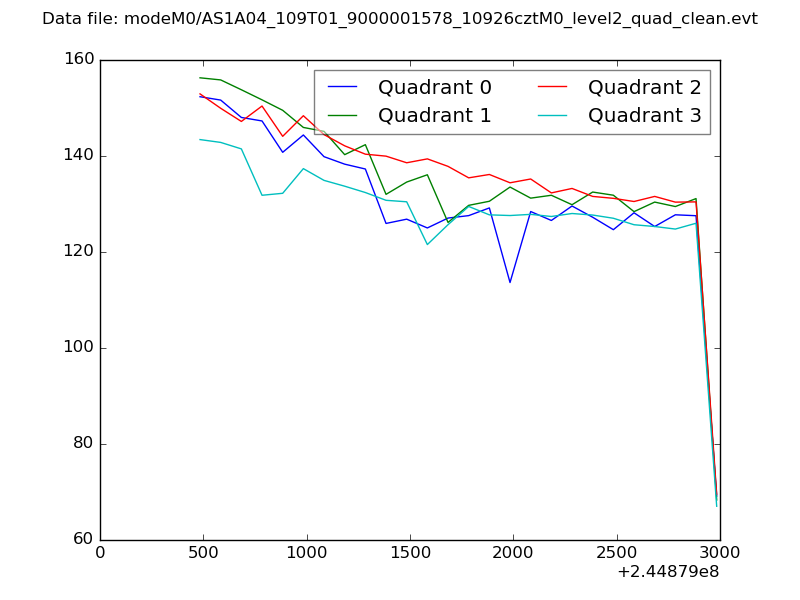 |
|
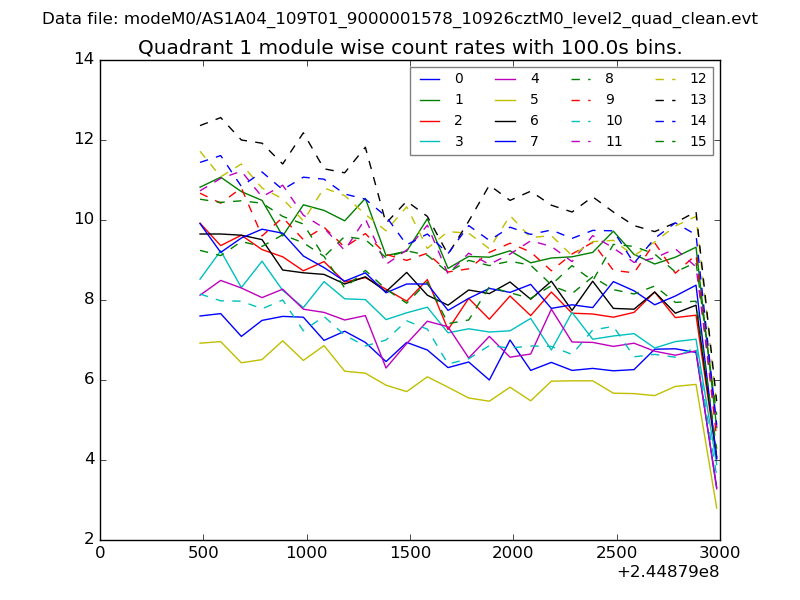
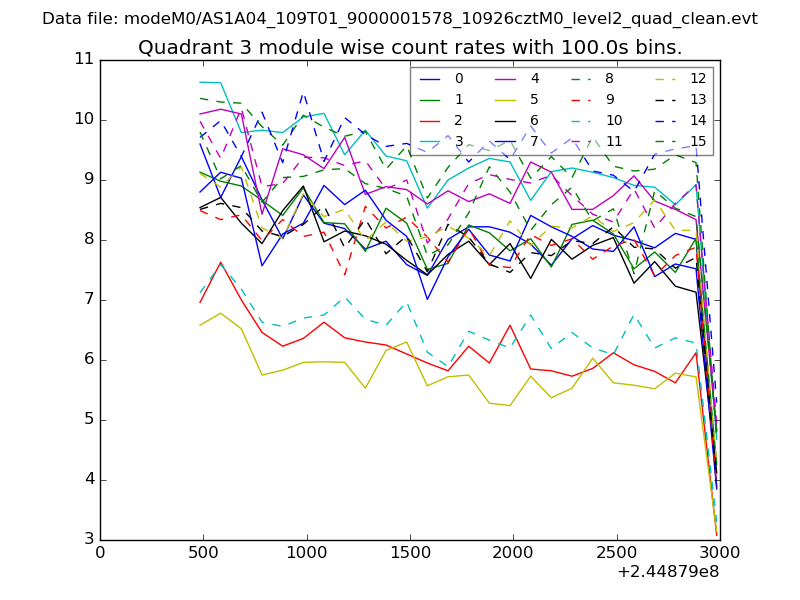
| Module-wise count rates for Quadrant A Data is divided into 100 sec bins |
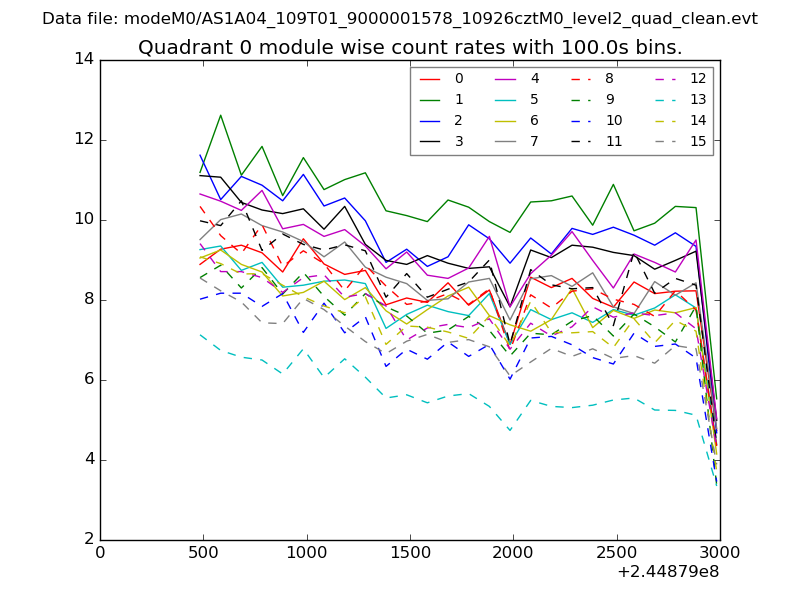 |
 |
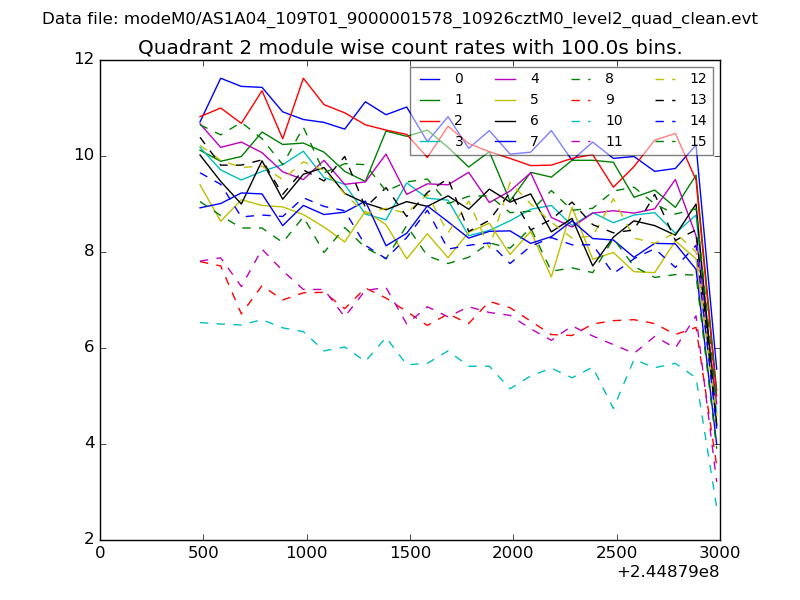
| Module-wise count rates for Quadrant B Data is divided into 100 sec bins |
 |
 |
| Module-wise count rates for Quadrant C Data is divided into 100 sec bins |
 |
 |
| Module-wise count rates for Quadrant D Data is divided into 100 sec bins |
 |
 |
| Parameter | Plot |
|---|---|
| CZT HV Monitor | 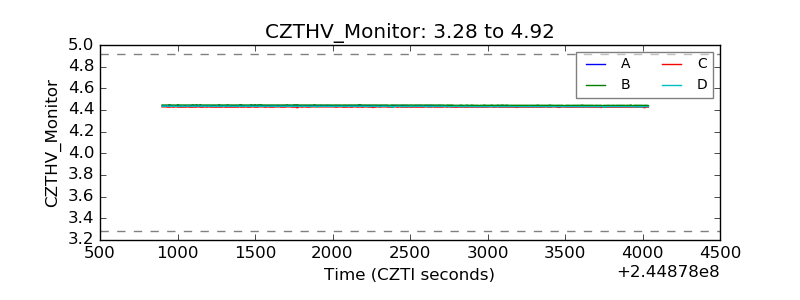 |
| D_VDD | 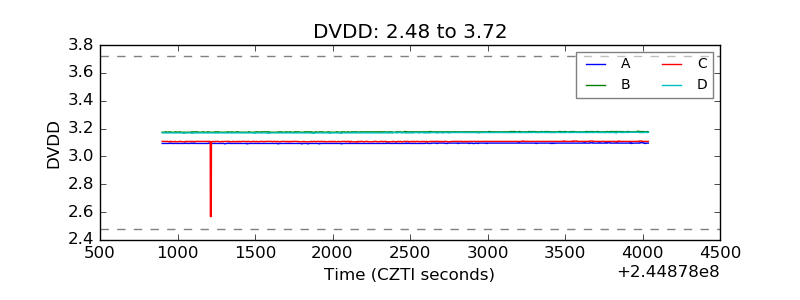 |
| Temperature 1 | 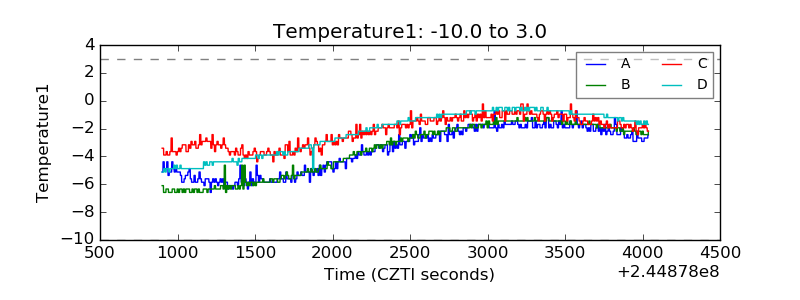 |
| Veto HV Monitor | 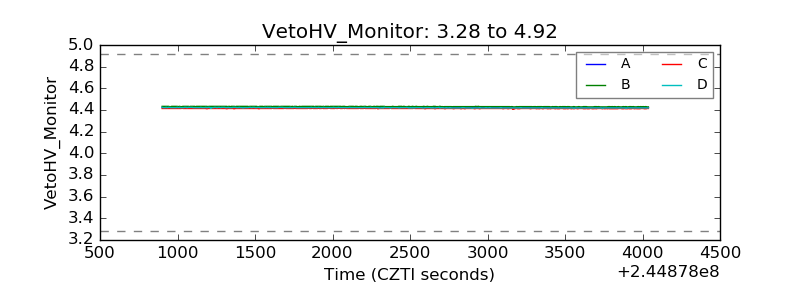 |
| Veto LLD | 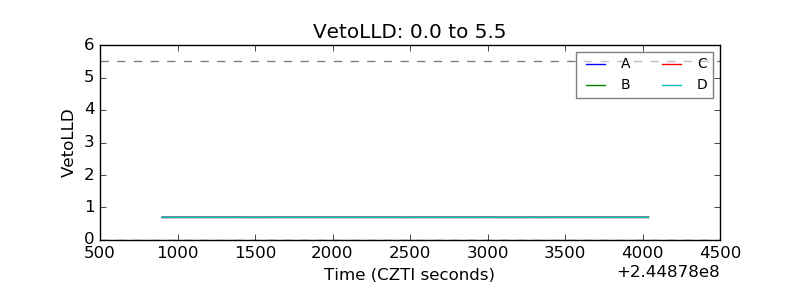 |
| Alpha Counter | 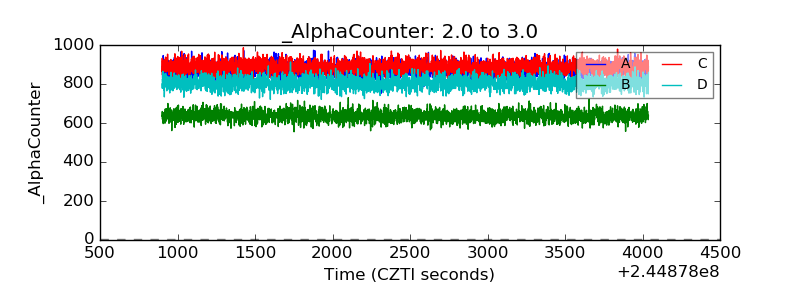 |
| _CPM_Rate | 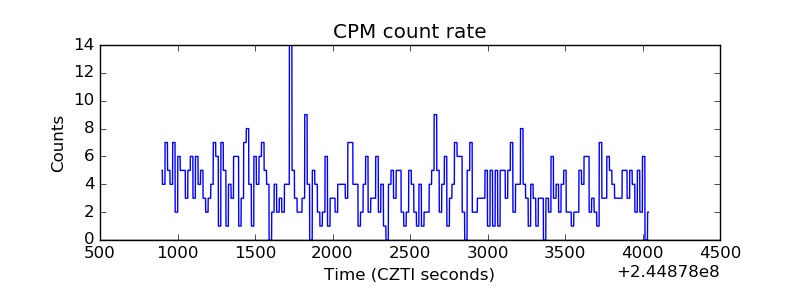 |
| CZT Counter |  |
| +2.5 Volts monitor |  |
| +5 Volts monitor |  |
| _ROLL_ROT | 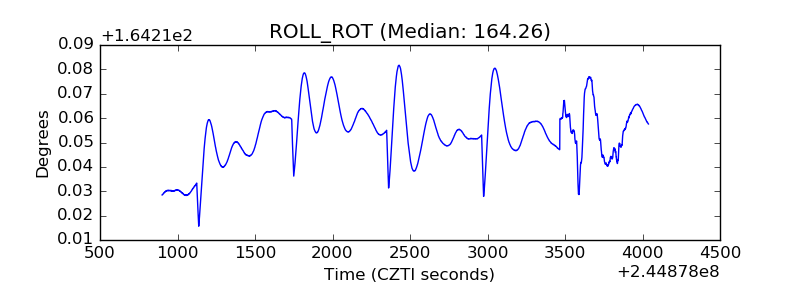 |
| _Roll_DEC | 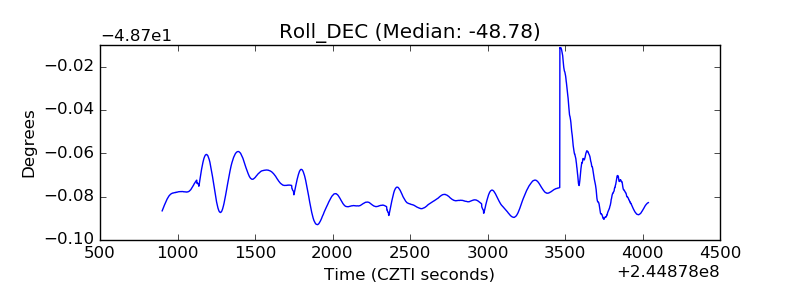 |
| _Roll_RA |  |
| Veto Counter | 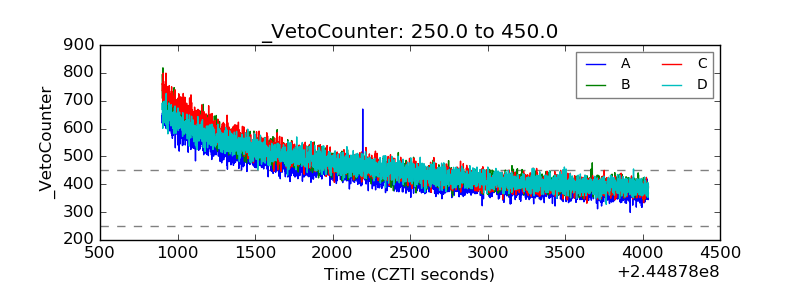 |