| Param | Original file | Final file |
|---|---|---|
| Filename | modeM0/AS1G08_036T01_9000001584cztM0_level2.fits | modeM0/AS1G08_036T01_9000001584cztM0_level2_quad_clean.evt |
| Size (bytes) | 195,344,640 | 178,865,280 |
| Size | 186.3 MB | 170.6 MB |
| Events in quadrant A | 1,166,918 | 1,020,512 |
| Events in quadrant B | 1,112,464 | 1,000,267 |
| Events in quadrant C | 1,160,022 | 1,000,153 |
| Events in quadrant D | 965,520 | 884,762 |
| Mode M0 | |||
|---|---|---|---|
| Quadrant | BADHDUFLAG | Total packets | Discarded packets |
| A | 0 | 49062 | 0 |
| B | 0 | 58455 | 0 |
| C | 0 | 44387 | 0 |
| D | 0 | 59814 | 0 |
| Mode M9 | |||
|---|---|---|---|
| Quadrant | BADHDUFLAG | Total packets | Discarded packets |
| A | 0 | 21 | 0 |
| B | 0 | 21 | 0 |
| C | 0 | 21 | 0 |
| D | 0 | 21 | 0 |
| Mode SS | |||
|---|---|---|---|
| Quadrant | BADHDUFLAG | Total packets | Discarded packets |
| A | 0 | 450 | 0 |
| B | 0 | 450 | 0 |
| C | 0 | 450 | 0 |
| D | 0 | 450 | 0 |
| Quadrant | Total seconds | Saturated seconds | Saturation percentage |
|---|---|---|---|
| A | 21927 | 383 | 1.746705% |
| B | 21929 | 1090 | 4.970587% |
| C | 21929 | 84 | 0.383054% |
| D | 21930 | 1311 | 5.978112% |
Noise dominated data is calculated using 1-second bins in cleaned event files. If a bin has >2000 counts, and if more than 50% of those come from <1% of pixels, then it is considered to be noise-dominated and hence unusable.
| Quadrant | # 1 sec bins | Bins with >0 counts | Bins with >2000 counts | High rate bins dominated by noise | Noise dominated (total time) | Noise dominated (detector-on time) | Marked lightcurve |
|---|---|---|---|---|---|---|---|
| A | 24211 | 21926 | 0 | 0 | 0.00% | 0.00% | 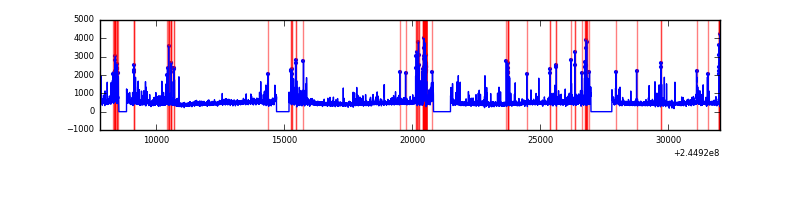 |
| B | 24211 | 21930 | 0 | 0 | 0.00% | 0.00% | 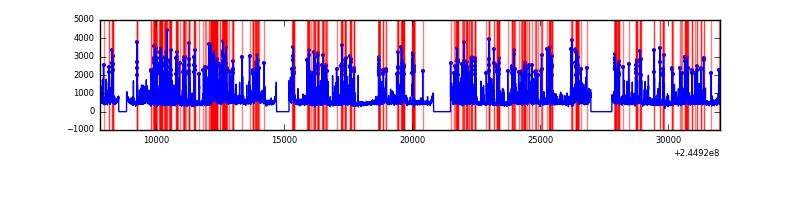 |
| C | 24211 | 21929 | 0 | 0 | 0.00% | 0.00% | 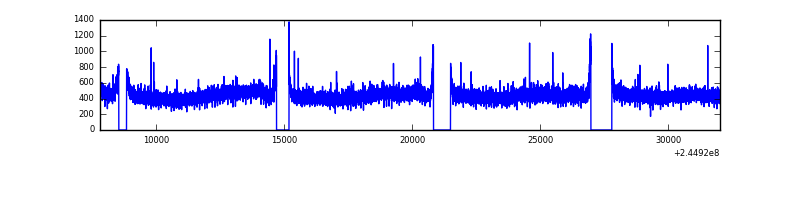 |
| D | 24211 | 21767 | 0 | 0 | 0.00% | 0.00% | 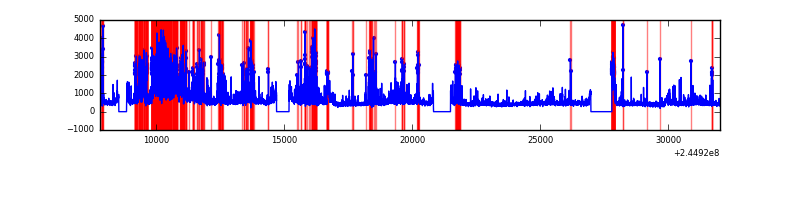 |
Top three noisy pixels from each quadrant. If the there are fewer than three noisy pixels in the level2.evt file, extra rows are filled as -1
| Pixel properties | Quadrant properties | ||||||
|---|---|---|---|---|---|---|---|
| Quadrant | DetID | PixID | Counts | Sigma | Mean | Median | Sigma |
| A | 0 | 29 | 1135 | 10.95 | 303 | 283 | 77.8 |
| A | 7 | 110 | 942 | 8.47 | 303 | 283 | 77.8 |
| A | 0 | 30 | 892 | 7.82 | 303 | 283 | 77.8 |
| B | 2 | 9 | 970 | 11.49 | 293 | 278 | 60.2 |
| B | 14 | 254 | 796 | 8.6 | 293 | 278 | 60.2 |
| B | 3 | 17 | 726 | 7.44 | 293 | 278 | 60.2 |
| C | 12 | 241 | 814 | 6.53 | 306 | 283 | 81.3 |
| C | 2 | 191 | 788 | 6.21 | 306 | 283 | 81.3 |
| C | 3 | 126 | 778 | 6.09 | 306 | 283 | 81.3 |
| D | 6 | 231 | 736 | 6.45 | 276 | 250 | 75.3 |
| D | 7 | 5 | 693 | 5.88 | 276 | 250 | 75.3 |
| D | 3 | 14 | 692 | 5.87 | 276 | 250 | 75.3 |
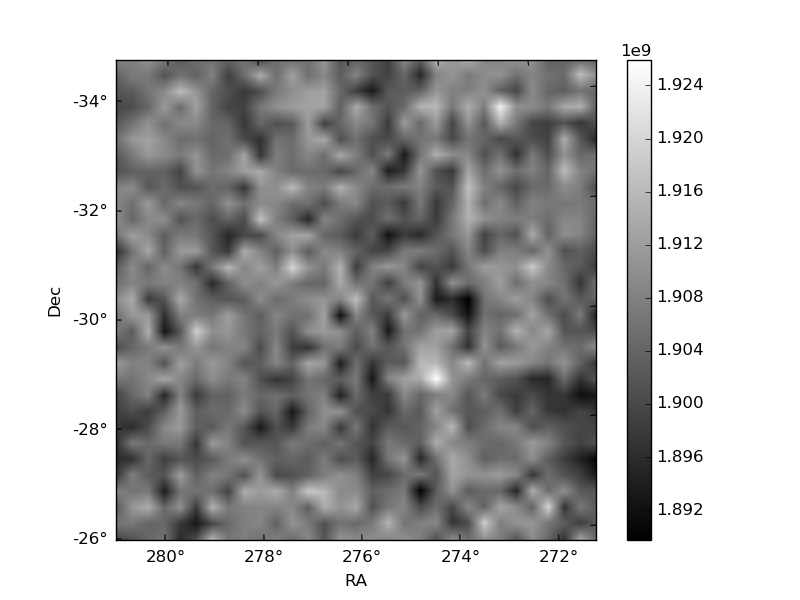
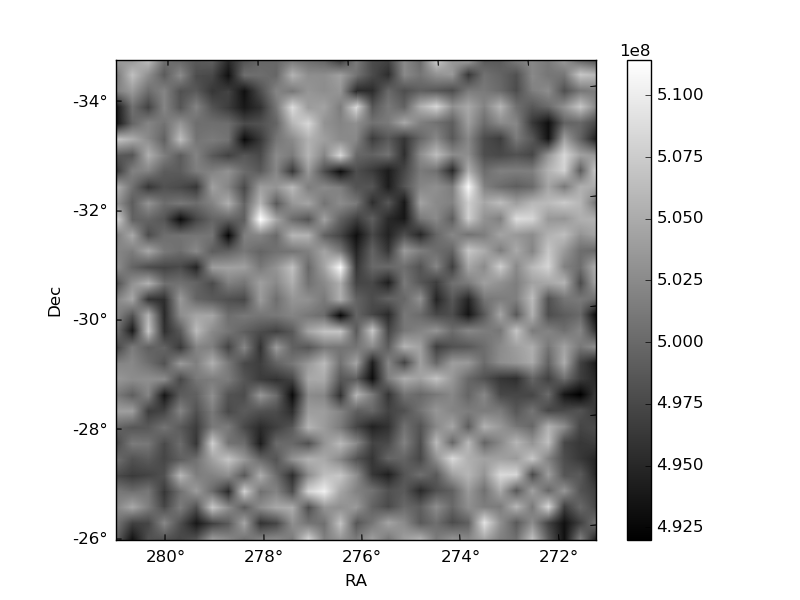
Histogram calculated using DETX and DETY for each event in the final _common_clean file
| Quadrant A | 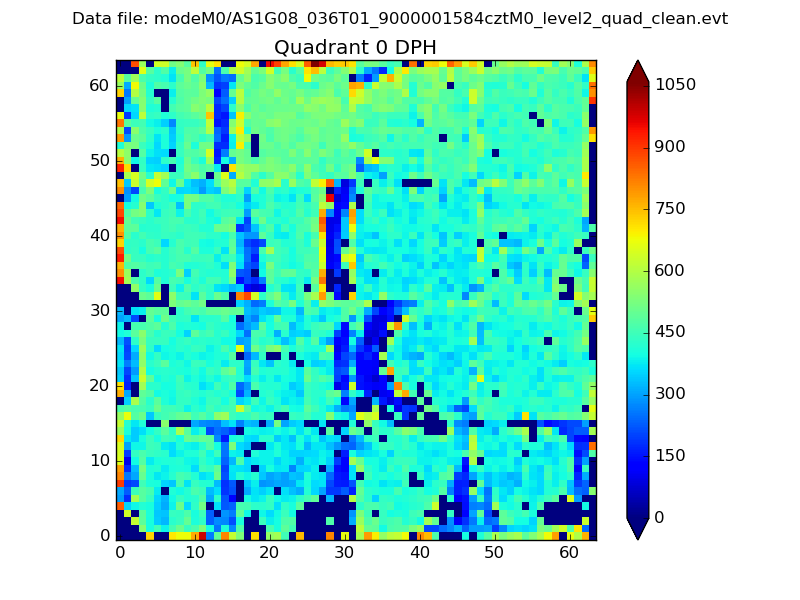 |
 |
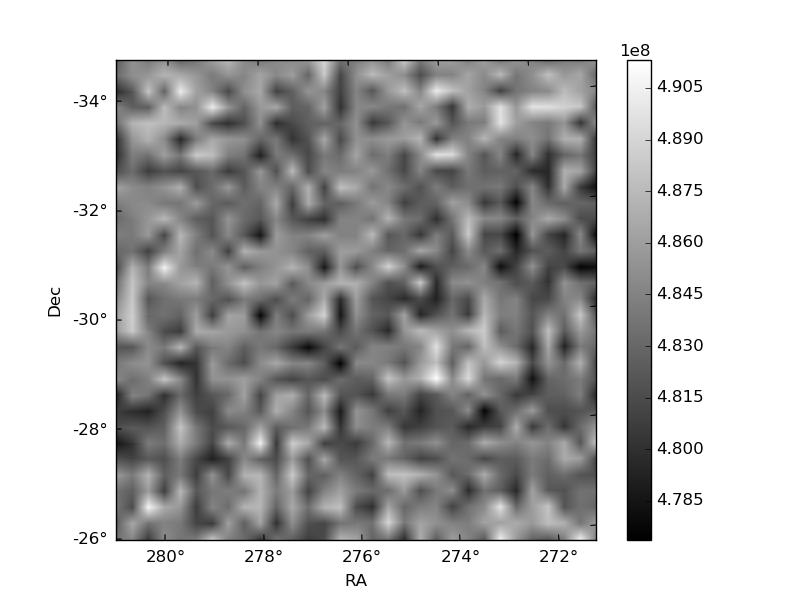
Quadrant B |
|---|---|---|---|
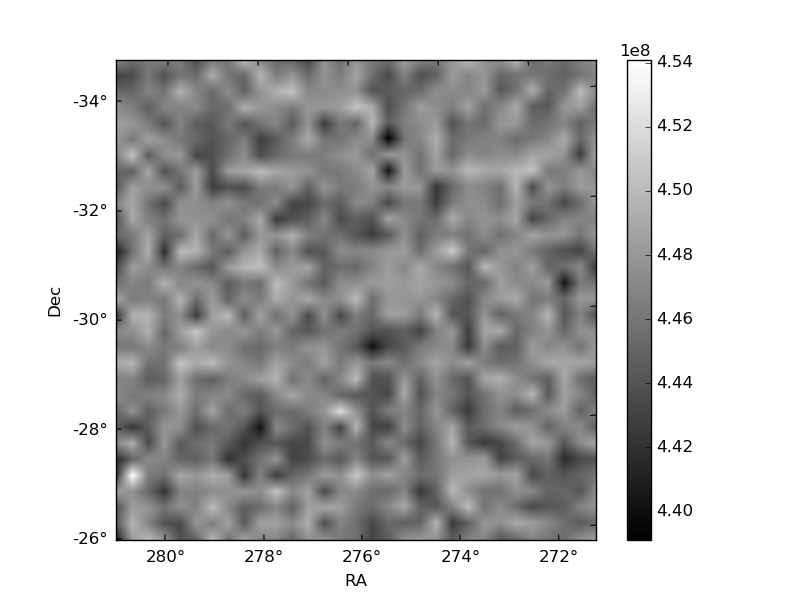
| Quadrant D | 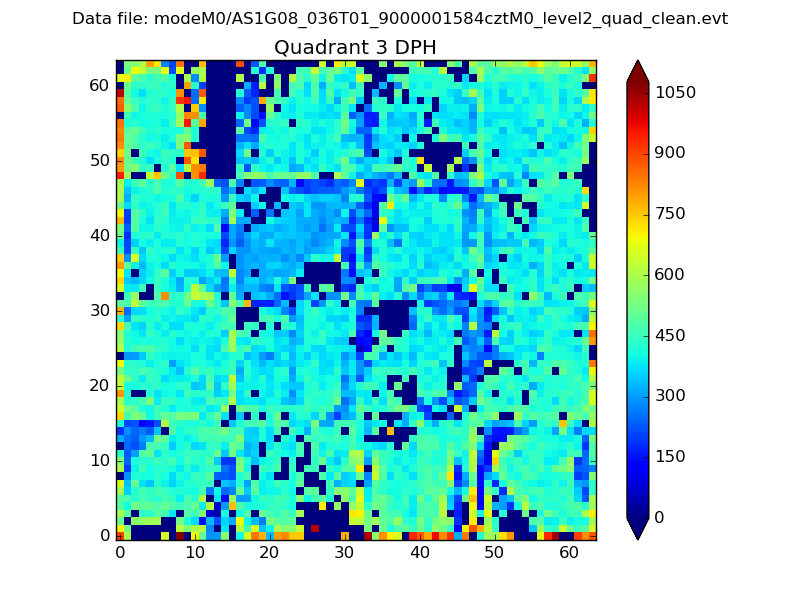 |
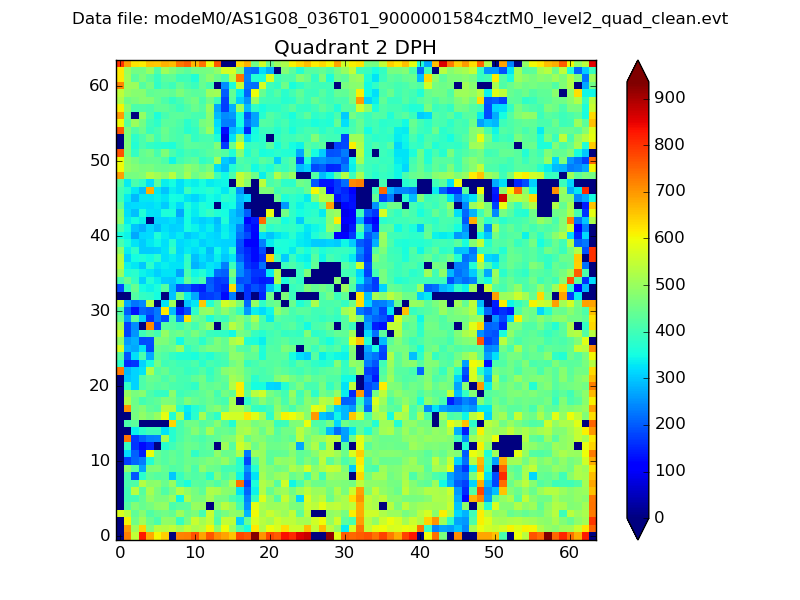 |
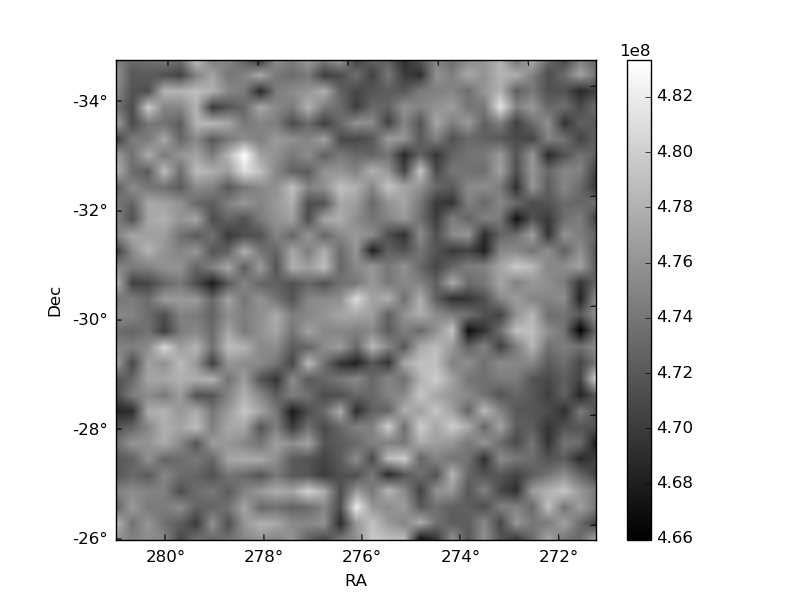
Quadrant C |
| Plot type | Count rate plots | Images |
|---|---|---|
| Comparison with Poisson distribution Blue bars denote a histogram of data divided into 1 sec bins. Red curve is a Poisson curve with rate = median count rate of data. |
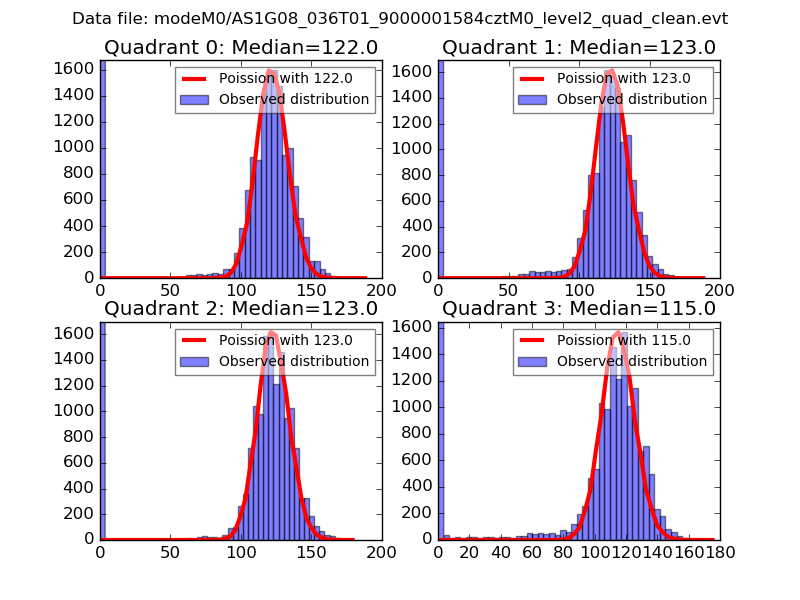 |
 |
| Quadrant-wise count rates Data is divided into 100 sec bins |
 |
|
| Module-wise count rates for Quadrant A Data is divided into 100 sec bins |
 |
 |
| Module-wise count rates for Quadrant B Data is divided into 100 sec bins |
 |
 |
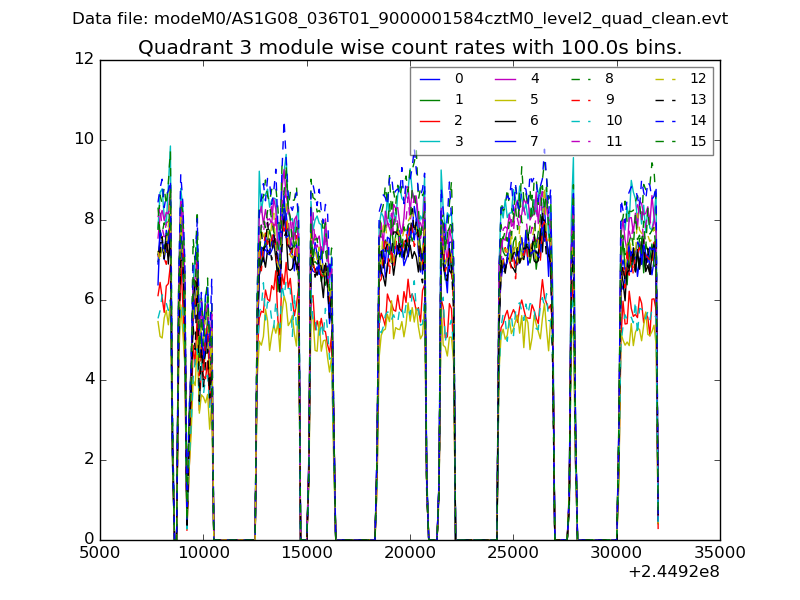
| Module-wise count rates for Quadrant C Data is divided into 100 sec bins |
 |
 |
| Module-wise count rates for Quadrant D Data is divided into 100 sec bins |
 |
 |
| Parameter | Plot |
|---|---|
| CZT HV Monitor |  |
| D_VDD | 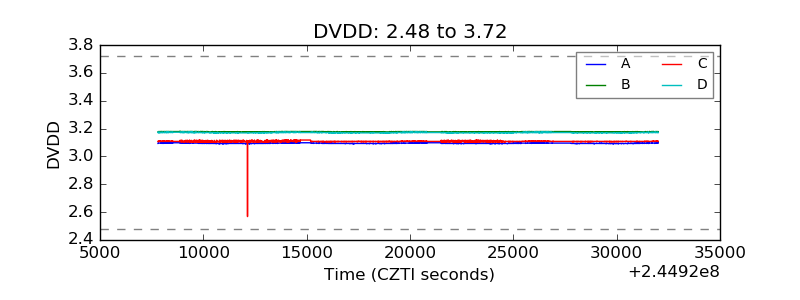 |
| Temperature 1 | 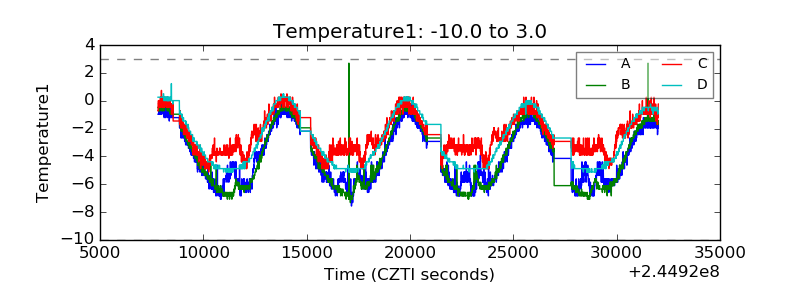 |
| Veto HV Monitor |  |
| Veto LLD | 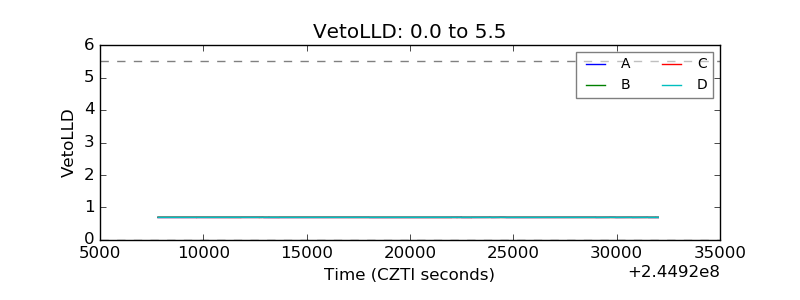 |
| Alpha Counter |  |
| _CPM_Rate | 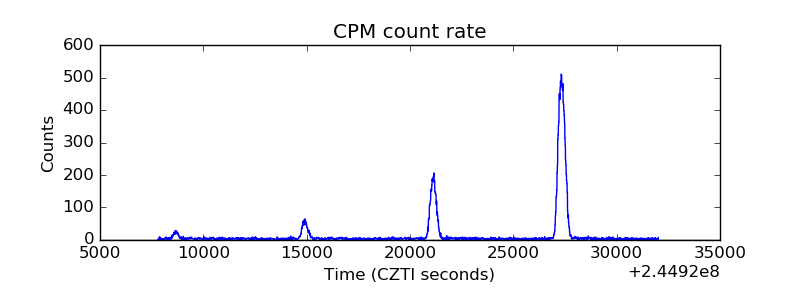 |
| CZT Counter | 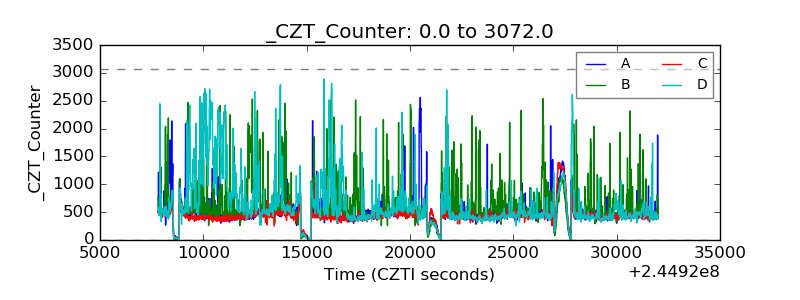 |
| +2.5 Volts monitor |  |
| +5 Volts monitor | 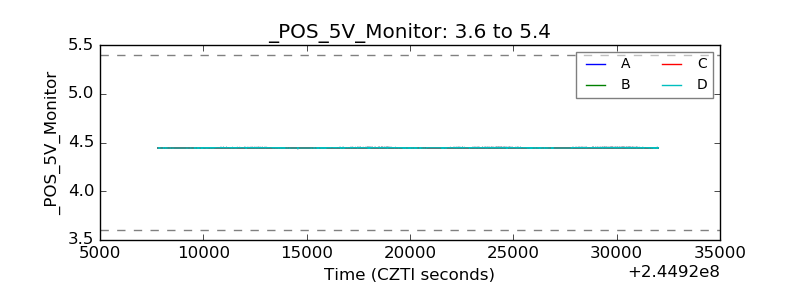 |
| _ROLL_ROT | 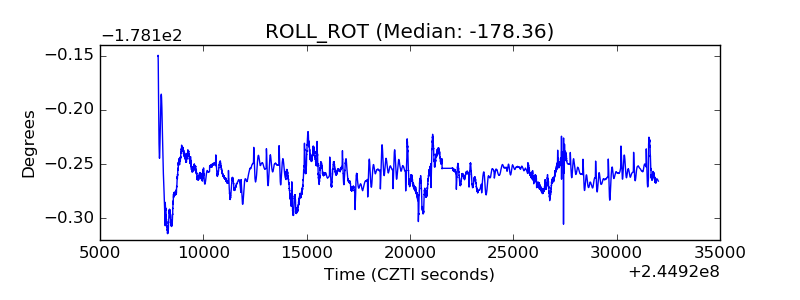 |
| _Roll_DEC | 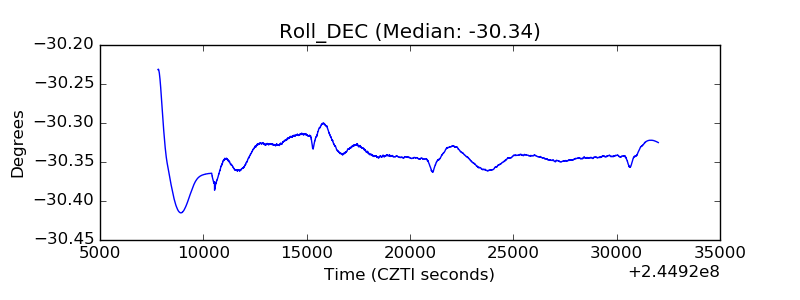 |
| _Roll_RA | 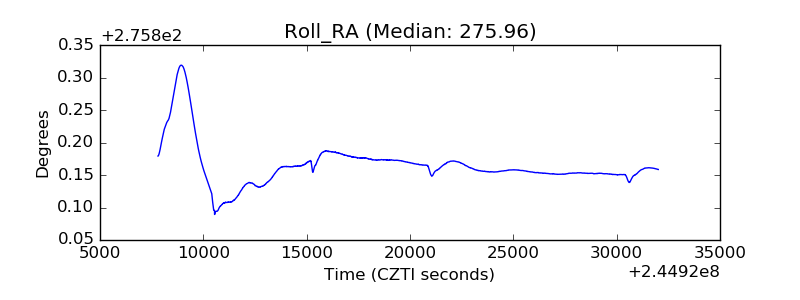 |
| Veto Counter | 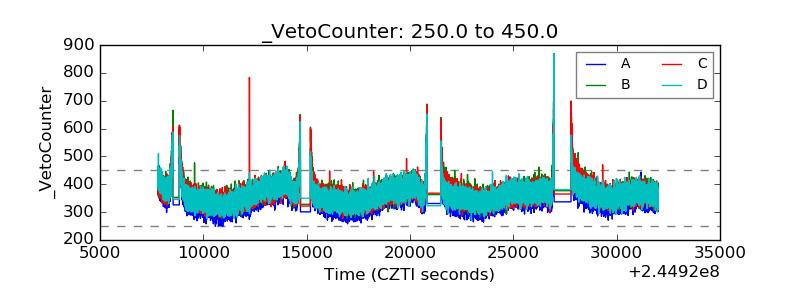 |