| Param | Original file | Final file |
|---|---|---|
| Filename | modeM0/AS1G08_036T01_9000001584_10936cztM0_level2.evt | modeM0/AS1G08_036T01_9000001584_10936cztM0_level2_quad_clean.evt |
| Size (bytes) | 1,437,295,680 | 205,300,800 |
| Size | 1.3 GB | 195.8 MB |
| Events in quadrant A | 9,269,683 | 1,267,283 |
| Events in quadrant B | 12,351,464 | 1,268,175 |
| Events in quadrant C | 7,858,159 | 1,282,736 |
| Events in quadrant D | 12,837,579 | 1,161,664 |
| Mode M0 | |||
|---|---|---|---|
| Quadrant | BADHDUFLAG | Total packets | Discarded packets |
| A | 0 | 39642 | 4 |
| B | 0 | 48490 | 3 |
| C | 0 | 36263 | 3 |
| D | 0 | 50654 | 3 |
| Mode M9 | |||
|---|---|---|---|
| Quadrant | BADHDUFLAG | Total packets | Discarded packets |
| A | 0 | 18 | 0 |
| B | 0 | 18 | 0 |
| C | 0 | 18 | 0 |
| D | 0 | 18 | 0 |
| Mode SS | |||
|---|---|---|---|
| Quadrant | BADHDUFLAG | Total packets | Discarded packets |
| A | 0 | 368 | 0 |
| B | 0 | 368 | 0 |
| C | 0 | 368 | 0 |
| D | 0 | 368 | 0 |
| Quadrant | Total seconds | Saturated seconds | Saturation percentage |
|---|---|---|---|
| A | 17938 | 292 | 1.627829% |
| B | 17938 | 985 | 5.491136% |
| C | 17938 | 78 | 0.434831% |
| D | 17938 | 1213 | 6.762181% |
Noise dominated data is calculated using 1-second bins in cleaned event files. If a bin has >2000 counts, and if more than 50% of those come from <1% of pixels, then it is considered to be noise-dominated and hence unusable.
| Quadrant | # 1 sec bins | Bins with >0 counts | Bins with >2000 counts | High rate bins dominated by noise | Noise dominated (total time) | Noise dominated (detector-on time) | Marked lightcurve |
|---|---|---|---|---|---|---|---|
| A | 19914 | 17941 | 124 | 124 | 0.62% | 0.69% |  |
| B | 19914 | 17941 | 567 | 567 | 2.85% | 3.16% |  |
| C | 19914 | 17941 | 0 | 0 | 0.00% | 0.00% |  |
| D | 19914 | 17940 | 862 | 862 | 4.33% | 4.80% |  |
Top three noisy pixels from each quadrant. If the there are fewer than three noisy pixels in the level2.evt file, extra rows are filled as -1
| Pixel properties | Quadrant properties | ||||||
|---|---|---|---|---|---|---|---|
| Quadrant | DetID | PixID | Counts | Sigma | Mean | Median | Sigma |
| A | 8 | 5 | 658816 | 1553.87 | 2061 | 2012 | 422.7 |
| A | 15 | 223 | 364434 | 857.42 | 2061 | 2012 | 422.7 |
| A | 15 | 239 | 142032 | 331.26 | 2061 | 2012 | 422.7 |
| B | 4 | 239 | 3642982 | 9355.33 | 2051 | 1999 | 389.2 |
| B | 4 | 81 | 364312 | 930.95 | 2051 | 1999 | 389.2 |
| B | 0 | 219 | 124241 | 314.1 | 2051 | 1999 | 389.2 |
| C | 8 | 128 | 14844 | 27.56 | 2004 | 2011 | 465.7 |
| C | 13 | 61 | 14700 | 27.25 | 2004 | 2011 | 465.7 |
| C | 8 | 112 | 9802 | 16.73 | 2004 | 2011 | 465.7 |
| D | 13 | 152 | 3297196 | 7024.34 | 1934 | 1876 | 469.1 |
| D | 1 | 52 | 1246862 | 2653.83 | 1934 | 1876 | 469.1 |
| D | 8 | 195 | 288302 | 610.55 | 1934 | 1876 | 469.1 |
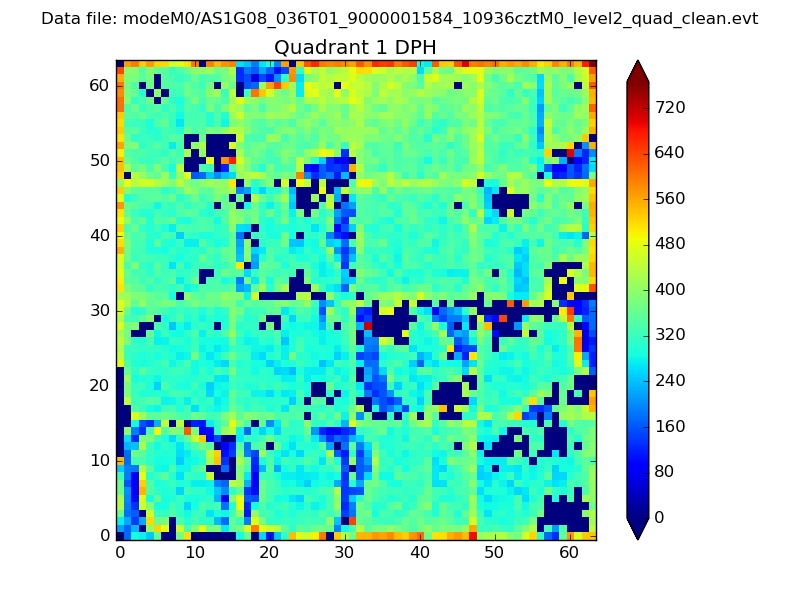
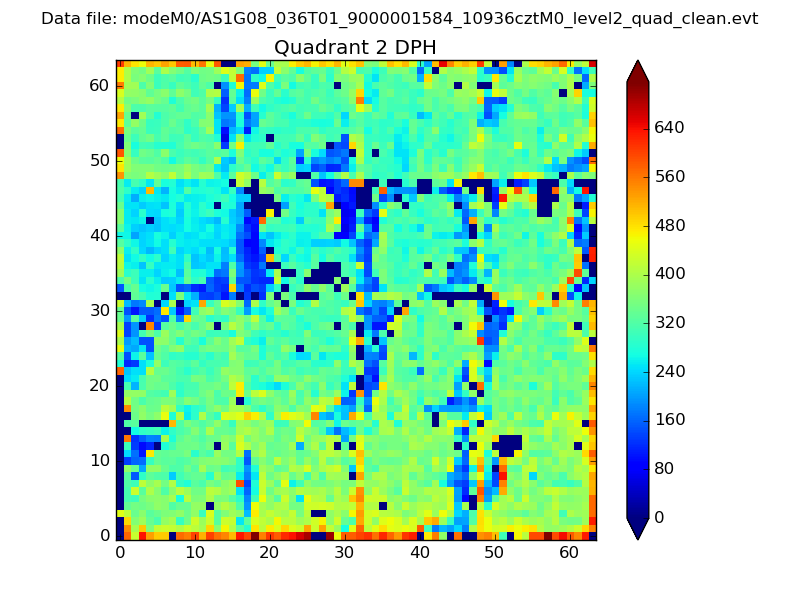
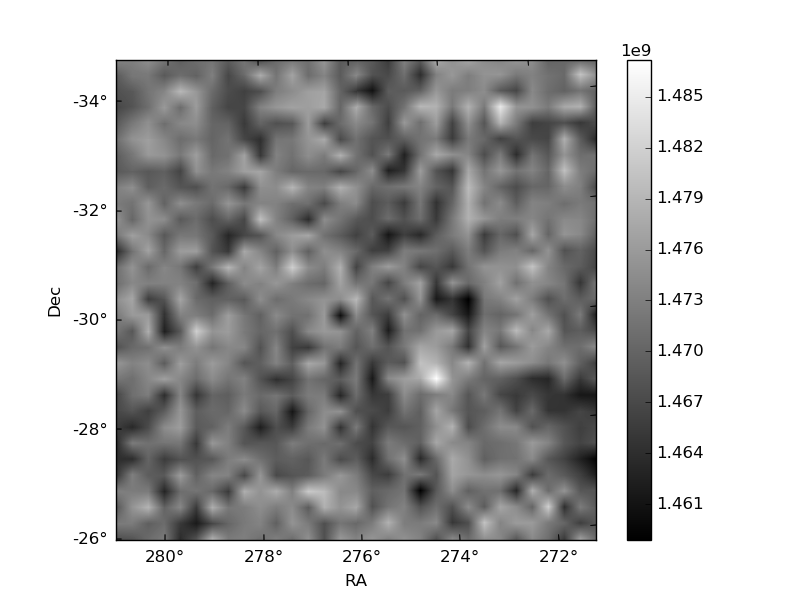
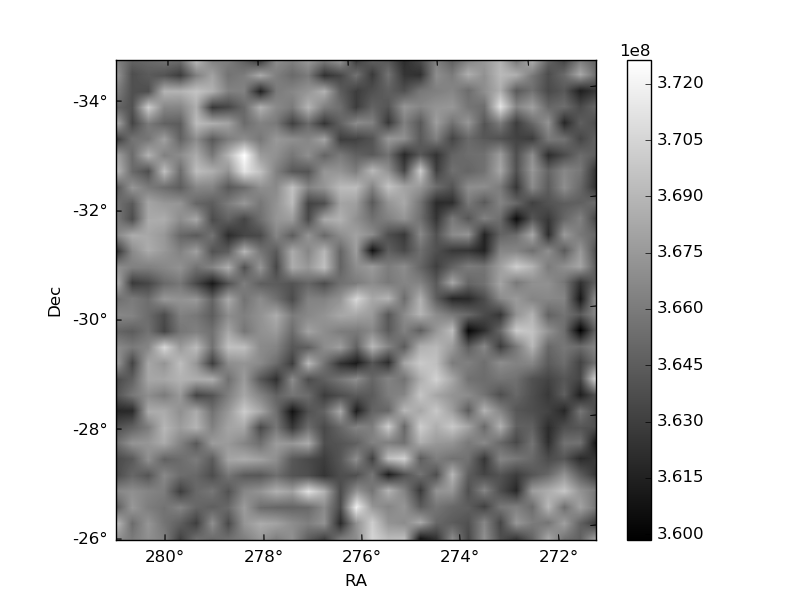
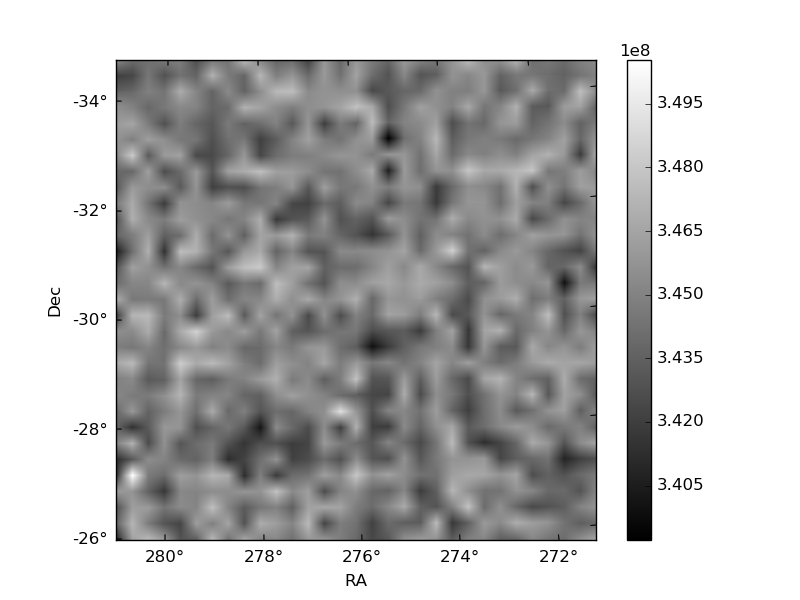
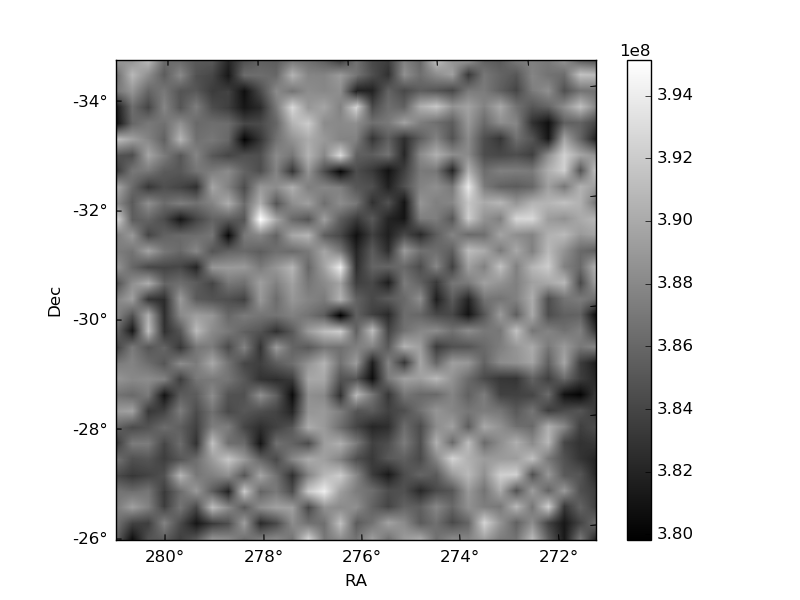
Histogram calculated using DETX and DETY for each event in the final _common_clean file
| Quadrant A |  |
 |
Quadrant B |
|---|---|---|---|
| Quadrant D | 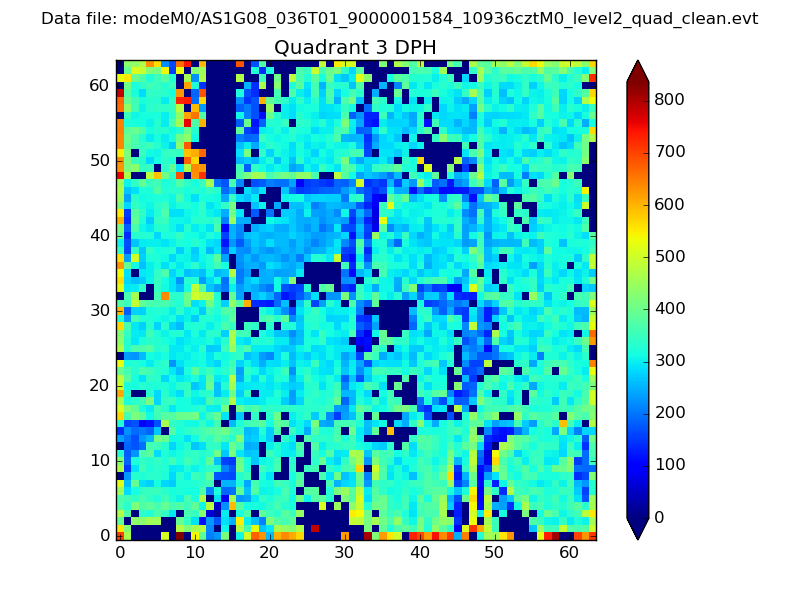 |
 |
Quadrant C |
| Plot type | Count rate plots | Images |
|---|---|---|
| Comparison with Poisson distribution Blue bars denote a histogram of data divided into 1 sec bins. Red curve is a Poisson curve with rate = median count rate of data. |
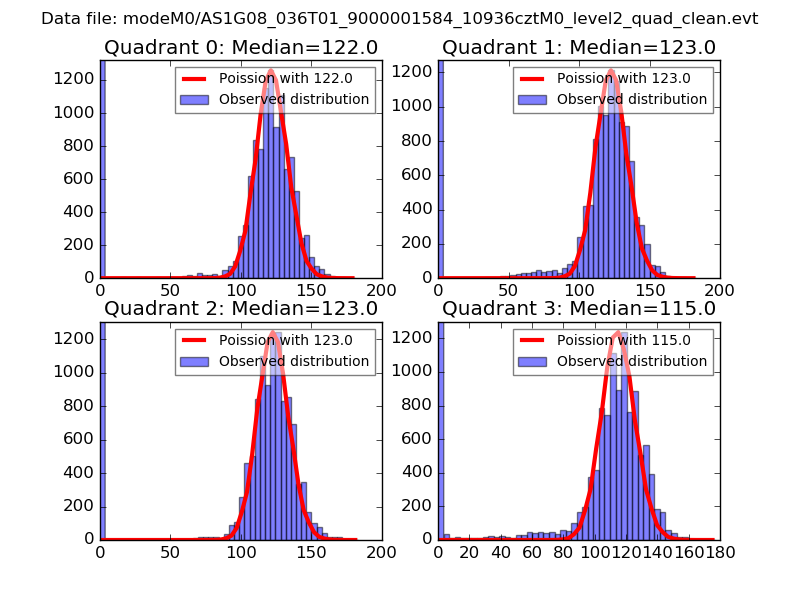 |
 |
| Quadrant-wise count rates Data is divided into 100 sec bins |
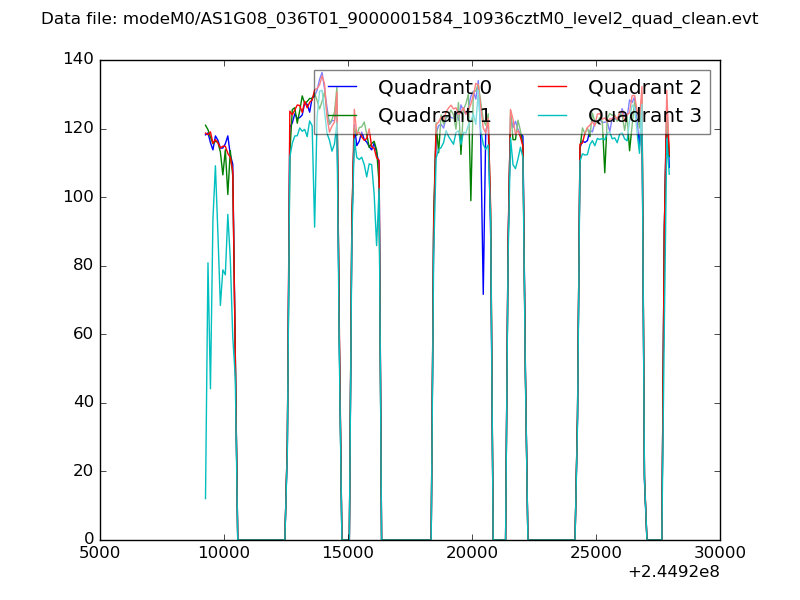 |
|
| Module-wise count rates for Quadrant A Data is divided into 100 sec bins |
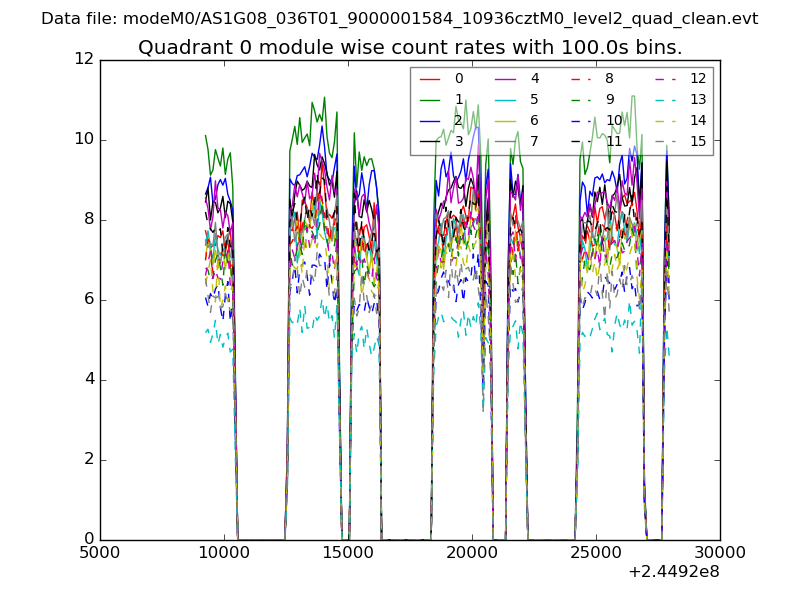 |
 |
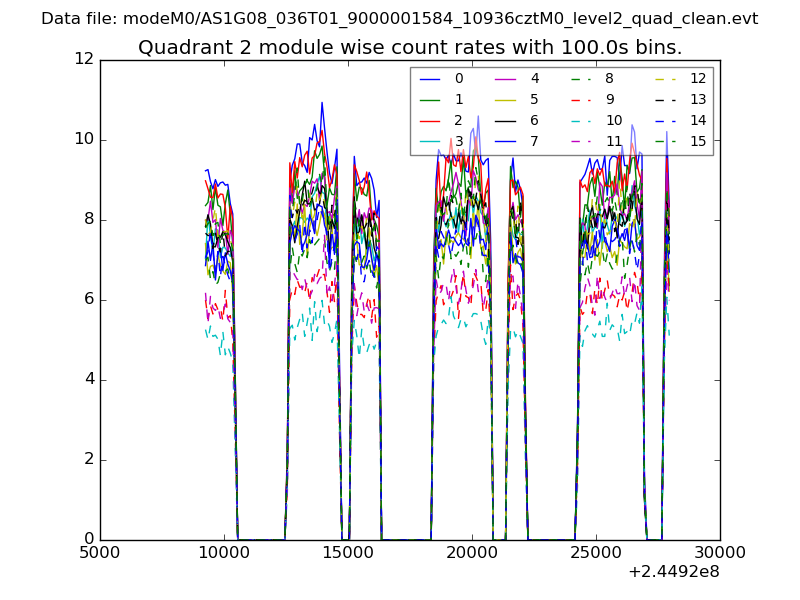
| Module-wise count rates for Quadrant B Data is divided into 100 sec bins |
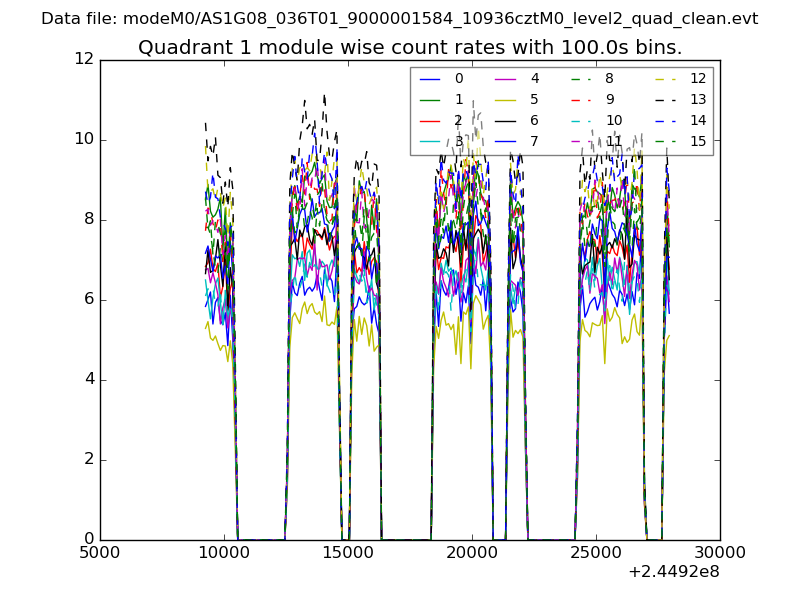 |
 |
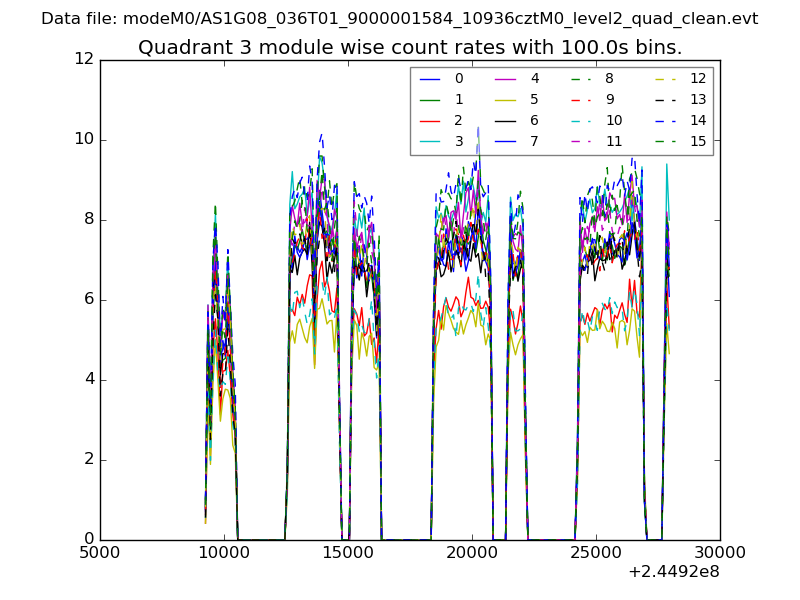
| Module-wise count rates for Quadrant C Data is divided into 100 sec bins |
 |
 |
| Module-wise count rates for Quadrant D Data is divided into 100 sec bins |
 |
 |
| Parameter | Plot |
|---|---|
| CZT HV Monitor | 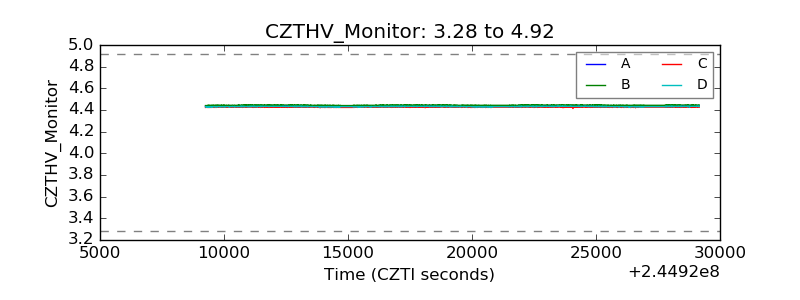 |
| D_VDD | 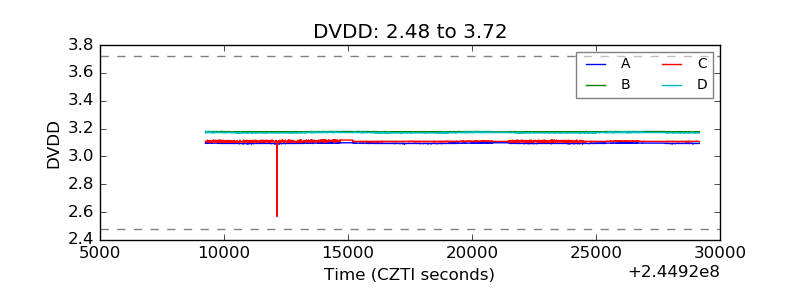 |
| Temperature 1 | 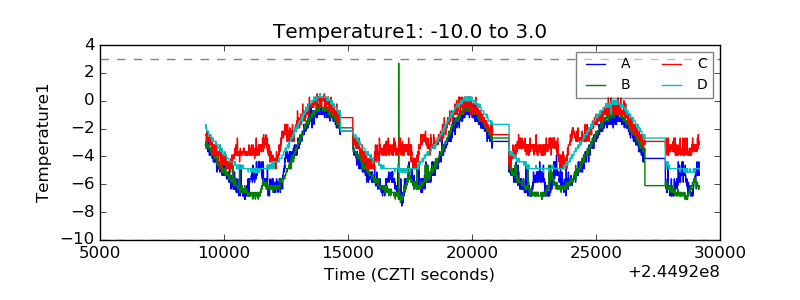 |
| Veto HV Monitor | 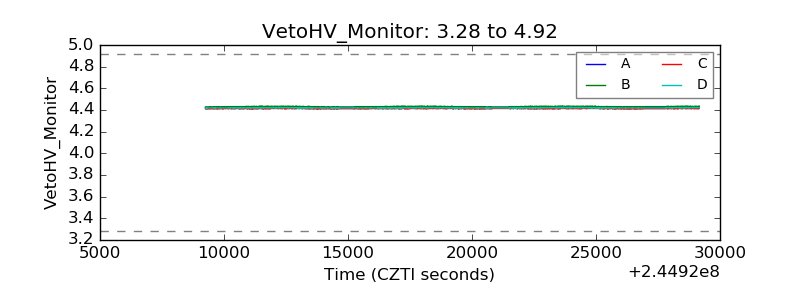 |
| Veto LLD |  |
| Alpha Counter | 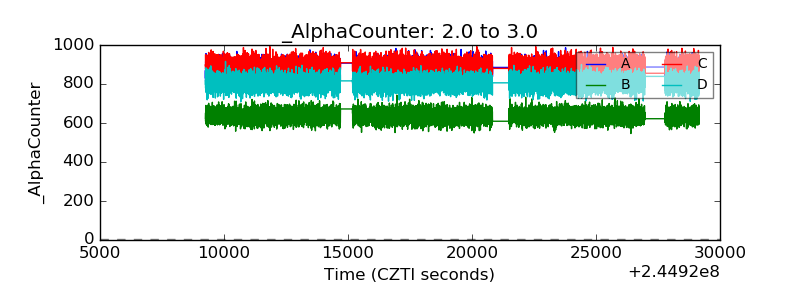 |
| _CPM_Rate | 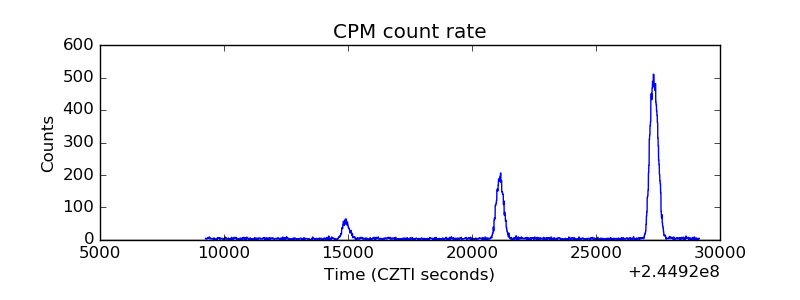 |
| CZT Counter | 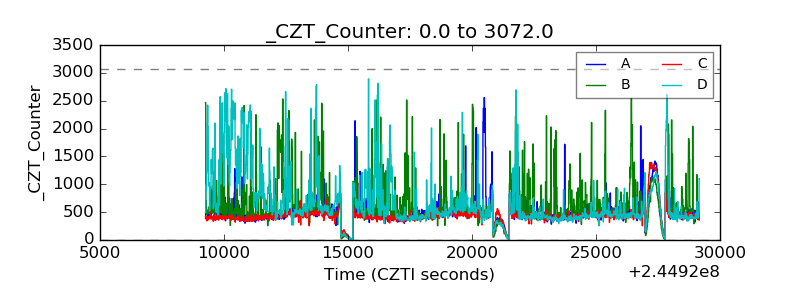 |
| +2.5 Volts monitor |  |
| +5 Volts monitor |  |
| _ROLL_ROT | 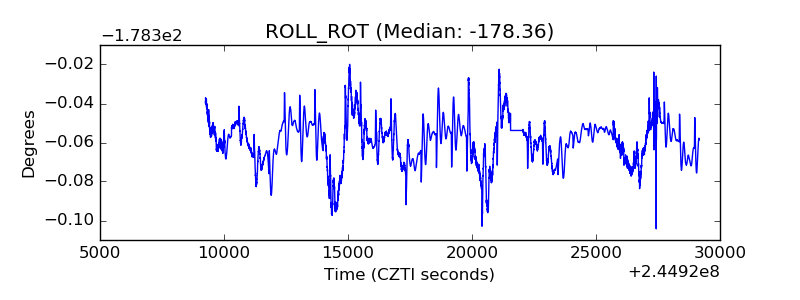 |
| _Roll_DEC | 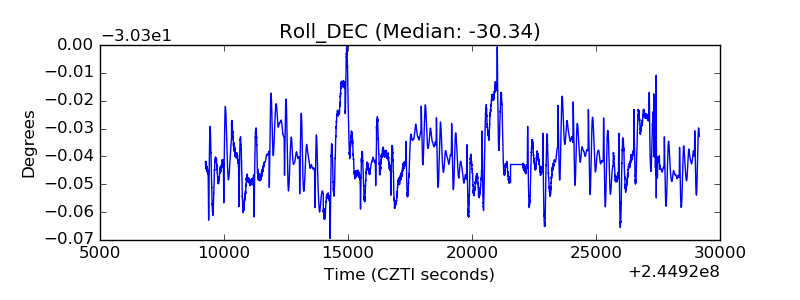 |
| _Roll_RA | 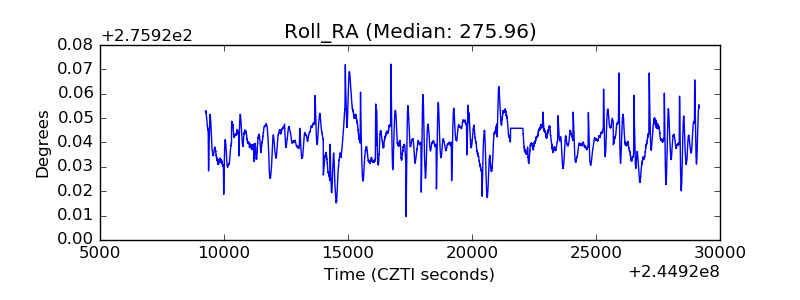 |
| Veto Counter | 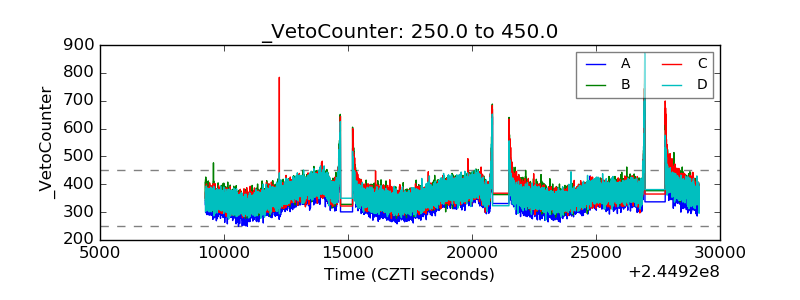 |