| Param | Original file | Final file |
|---|---|---|
| Filename | modeM0/AS1G08_036T01_9000001584_10937cztM0_level2.evt | modeM0/AS1G08_036T01_9000001584_10937cztM0_level2_quad_clean.evt |
| Size (bytes) | 262,831,680 | 38,033,280 |
| Size | 250.7 MB | 36.3 MB |
| Events in quadrant A | 1,867,505 | 220,743 |
| Events in quadrant B | 2,328,676 | 222,183 |
| Events in quadrant C | 1,664,828 | 223,077 |
| Events in quadrant D | 1,834,022 | 211,540 |
| Mode M0 | |||
|---|---|---|---|
| Quadrant | BADHDUFLAG | Total packets | Discarded packets |
| A | 0 | 8238 | 19 |
| B | 0 | 9441 | 21 |
| C | 0 | 7756 | 4 |
| D | 0 | 8282 | 4 |
| Mode SS | |||
|---|---|---|---|
| Quadrant | BADHDUFLAG | Total packets | Discarded packets |
| A | 0 | 78 | 0 |
| B | 0 | 78 | 0 |
| C | 0 | 78 | 0 |
| D | 0 | 78 | 0 |
| Quadrant | Total seconds | Saturated seconds | Saturation percentage |
|---|---|---|---|
| A | 3867 | 22 | 0.568916% |
| B | 3870 | 81 | 2.093023% |
| C | 3874 | 2 | 0.051626% |
| D | 3874 | 8 | 0.206505% |
Noise dominated data is calculated using 1-second bins in cleaned event files. If a bin has >2000 counts, and if more than 50% of those come from <1% of pixels, then it is considered to be noise-dominated and hence unusable.
| Quadrant | # 1 sec bins | Bins with >0 counts | Bins with >2000 counts | High rate bins dominated by noise | Noise dominated (total time) | Noise dominated (detector-on time) | Marked lightcurve |
|---|---|---|---|---|---|---|---|
| A | 3876 | 3876 | 15 | 15 | 0.39% | 0.39% | 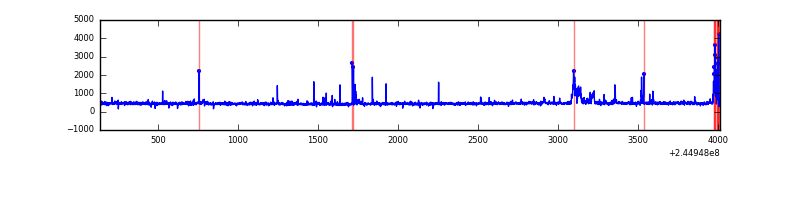 |
| B | 3876 | 3876 | 57 | 57 | 1.47% | 1.47% | 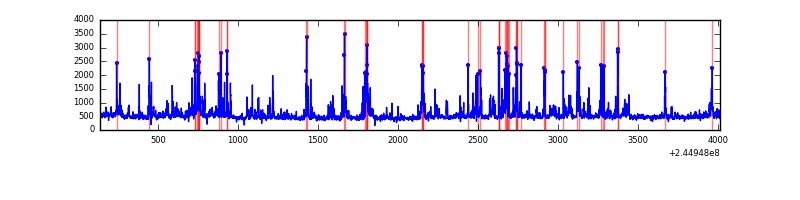 |
| C | 3876 | 3876 | 0 | 0 | 0.00% | 0.00% | 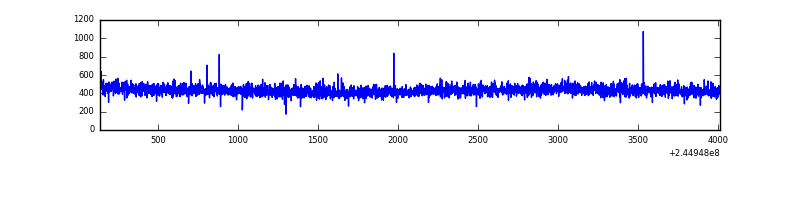 |
| D | 3876 | 3876 | 9 | 9 | 0.23% | 0.23% | 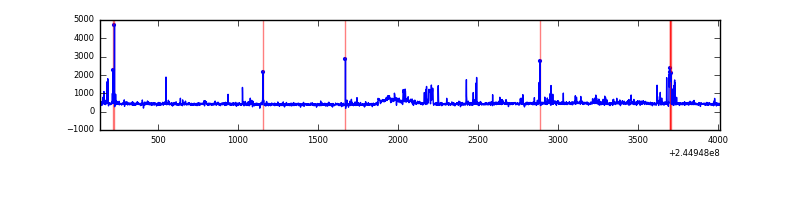 |
Top three noisy pixels from each quadrant. If the there are fewer than three noisy pixels in the level2.evt file, extra rows are filled as -1
| Pixel properties | Quadrant properties | ||||||
|---|---|---|---|---|---|---|---|
| Quadrant | DetID | PixID | Counts | Sigma | Mean | Median | Sigma |
| A | 15 | 174 | 70222 | 781.27 | 435 | 426 | 89.3 |
| A | 15 | 223 | 62690 | 696.96 | 435 | 426 | 89.3 |
| A | 8 | 5 | 42245 | 468.1 | 435 | 426 | 89.3 |
| B | 4 | 239 | 535015 | 6269.7 | 437 | 425 | 85.3 |
| B | 0 | 214 | 40622 | 471.43 | 437 | 425 | 85.3 |
| B | 4 | 81 | 17660 | 202.13 | 437 | 425 | 85.3 |
| C | 13 | 61 | 3179 | 27.62 | 426 | 429 | 99.6 |
| C | 8 | 222 | 2331 | 19.1 | 426 | 429 | 99.6 |
| C | 14 | 234 | 1226 | 8.0 | 426 | 429 | 99.6 |
| D | 1 | 52 | 95005 | 920.12 | 423 | 412 | 102.8 |
| D | 13 | 152 | 62031 | 599.38 | 423 | 412 | 102.8 |
| D | 13 | 249 | 19376 | 184.47 | 423 | 412 | 102.8 |
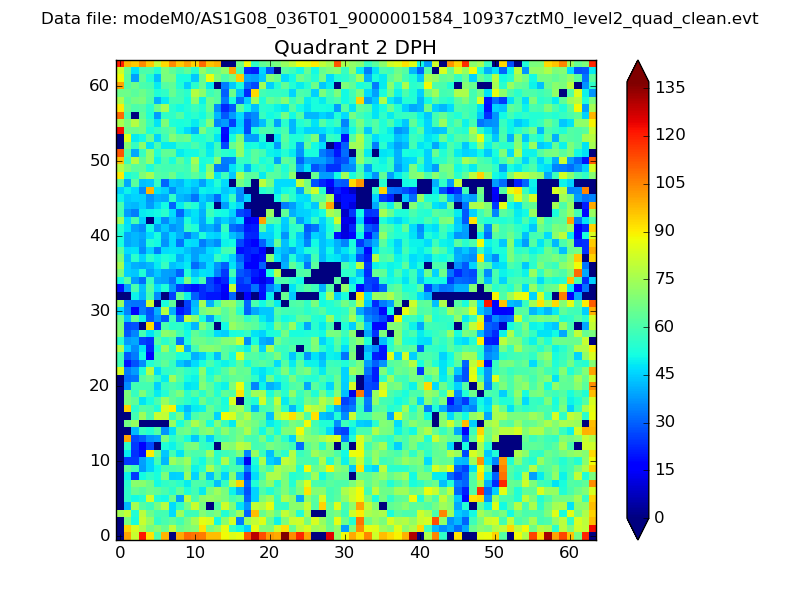
Histogram calculated using DETX and DETY for each event in the final _common_clean file
| Quadrant A | 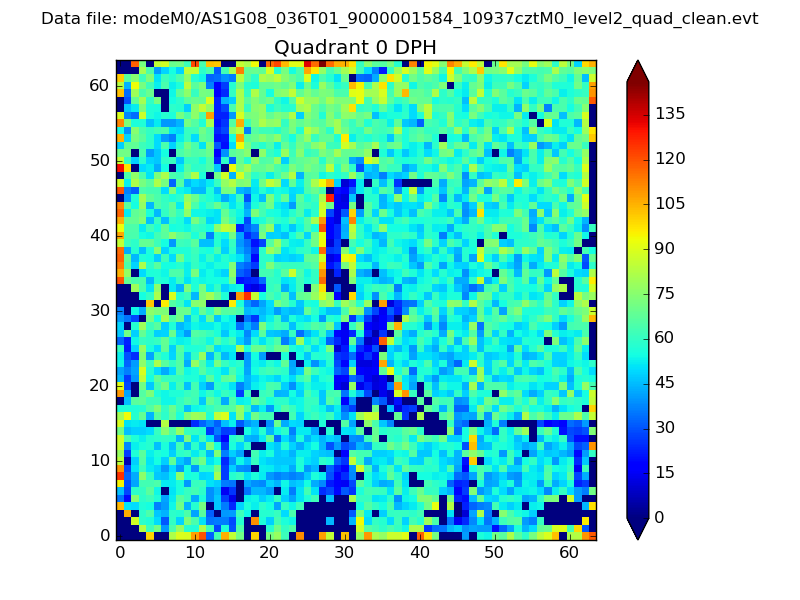 |
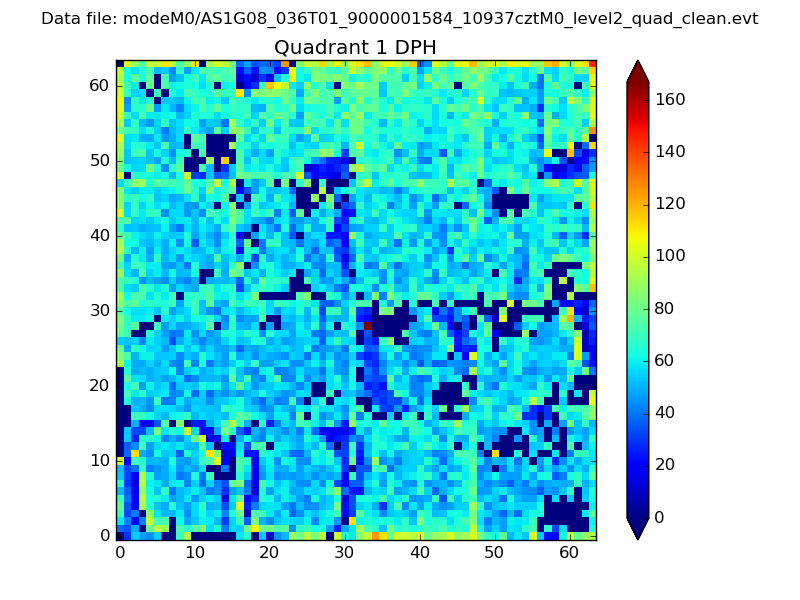 |
Quadrant B |
|---|---|---|---|
| Quadrant D | 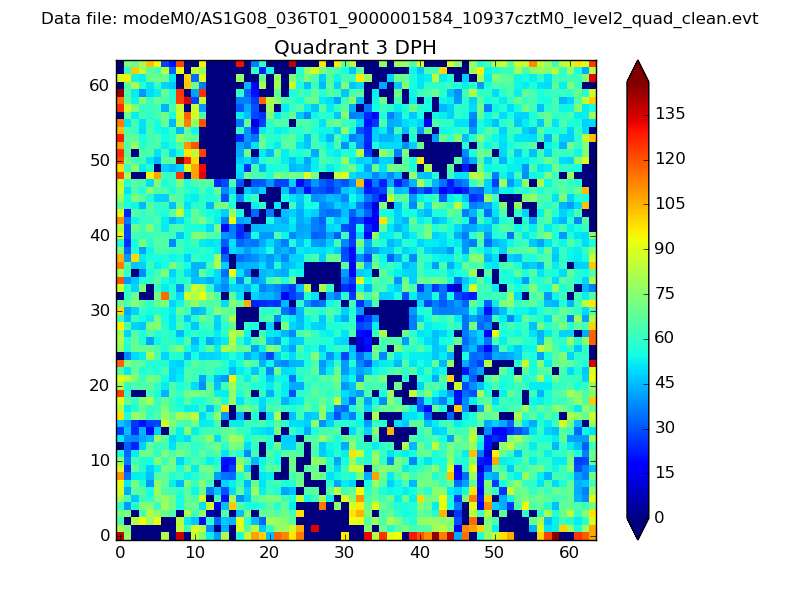 |
 |
Quadrant C |
| Plot type | Count rate plots | Images |
|---|---|---|
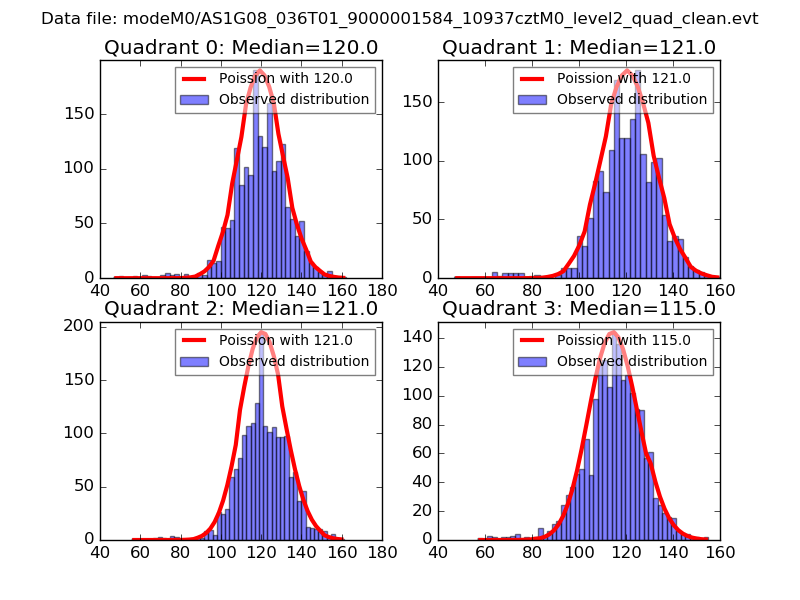
| Comparison with Poisson distribution Blue bars denote a histogram of data divided into 1 sec bins. Red curve is a Poisson curve with rate = median count rate of data. |
 |
 |
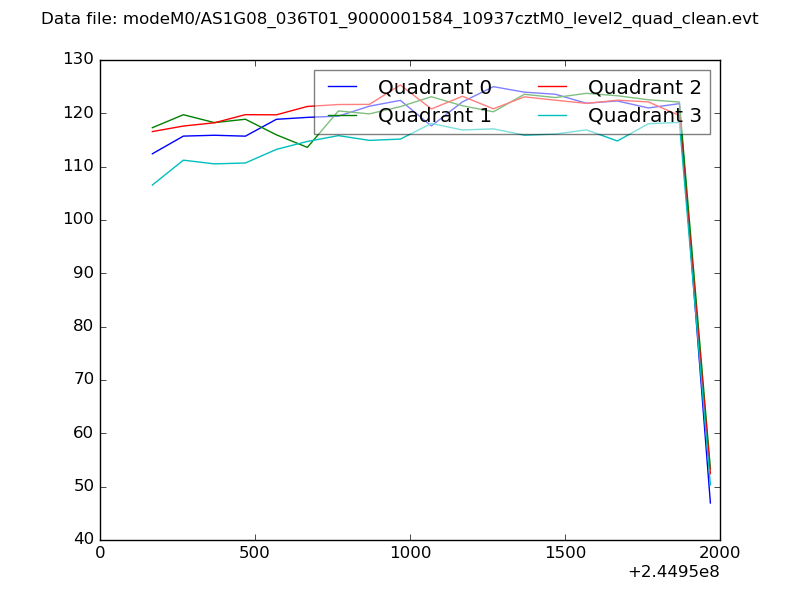
| Quadrant-wise count rates Data is divided into 100 sec bins |
 |
|
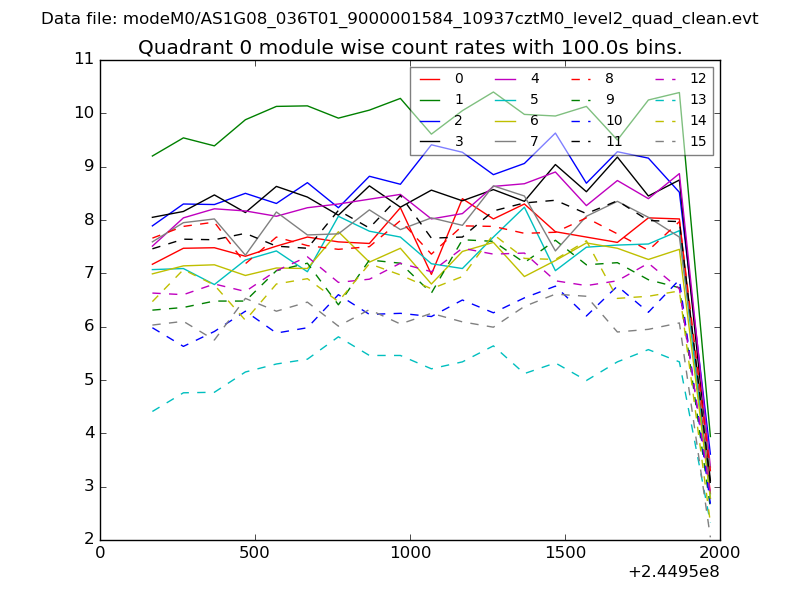
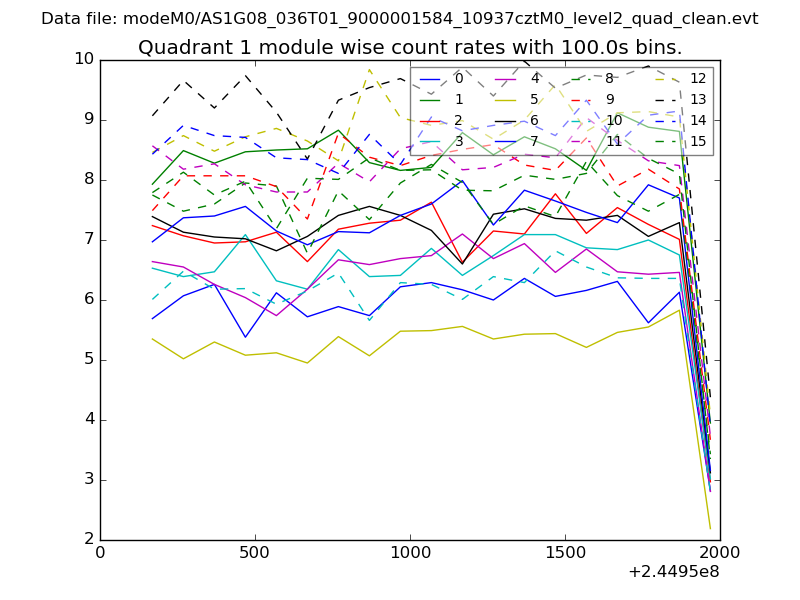
| Module-wise count rates for Quadrant A Data is divided into 100 sec bins |
 |
 |
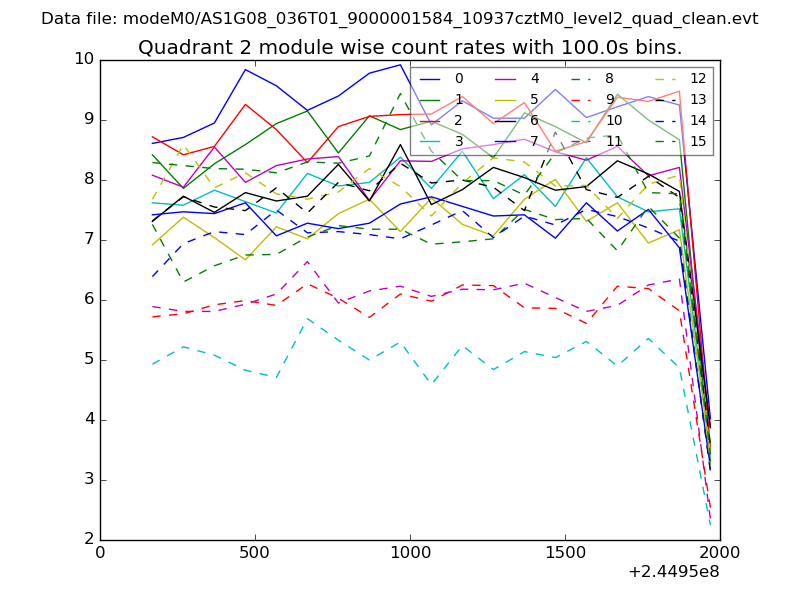
| Module-wise count rates for Quadrant B Data is divided into 100 sec bins |
 |
 |
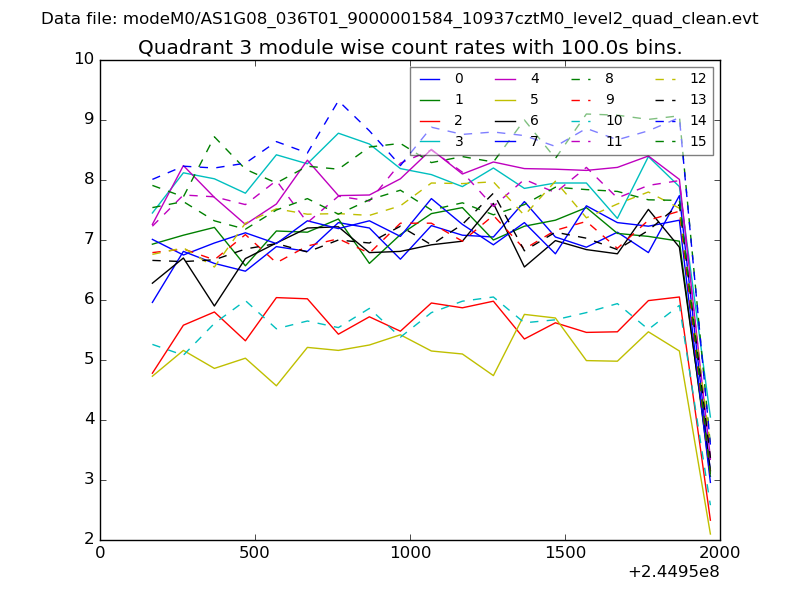
| Module-wise count rates for Quadrant C Data is divided into 100 sec bins |
 |
 |
| Module-wise count rates for Quadrant D Data is divided into 100 sec bins |
 |
 |
| Parameter | Plot |
|---|---|
| CZT HV Monitor | 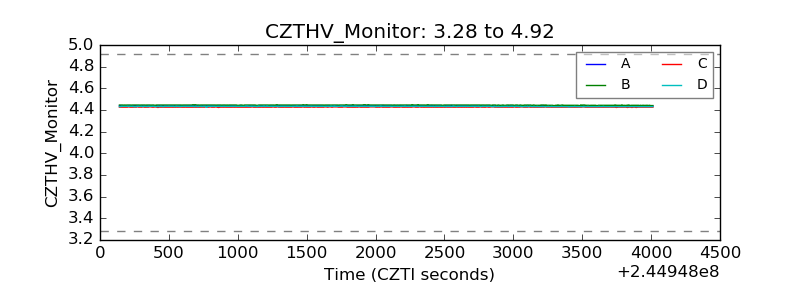 |
| D_VDD | 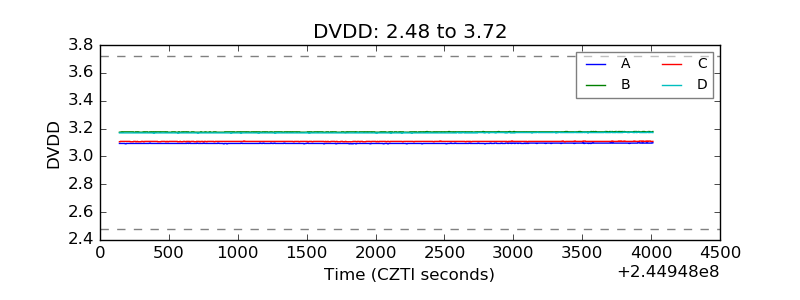 |
| Temperature 1 | 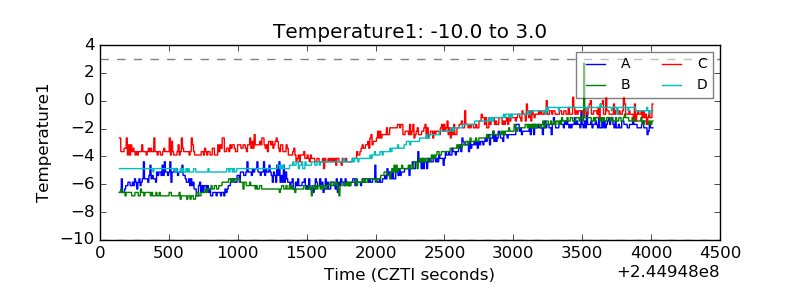 |
| Veto HV Monitor | 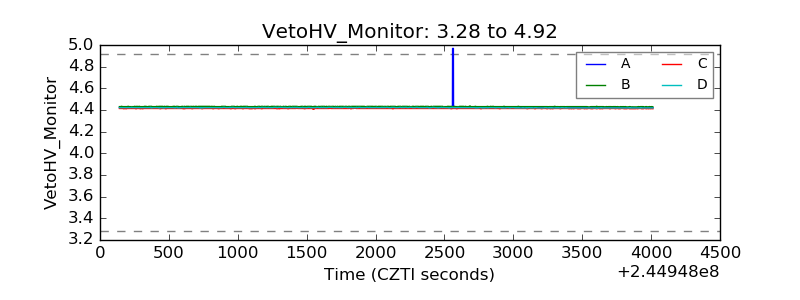 |
| Veto LLD | 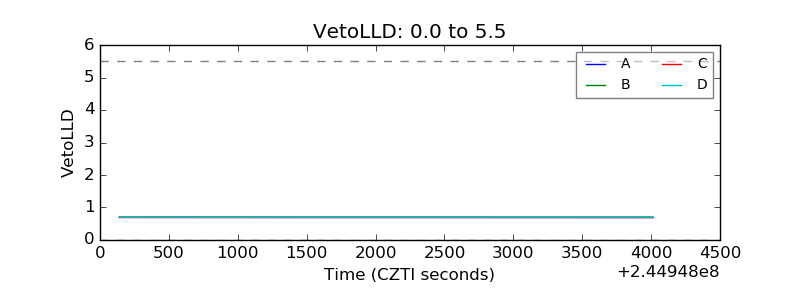 |
| Alpha Counter | 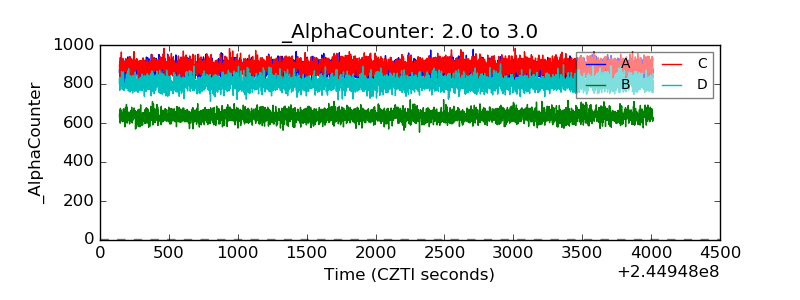 |
| _CPM_Rate | 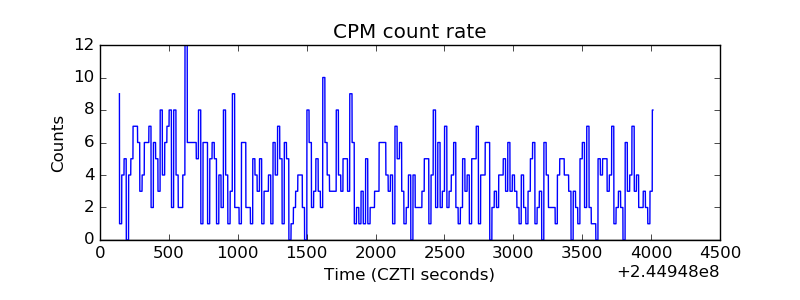 |
| CZT Counter | 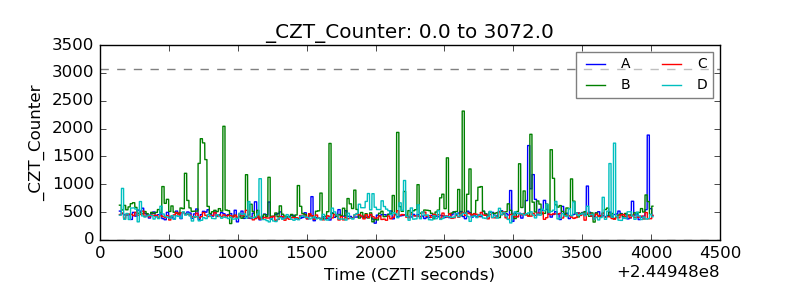 |
| +2.5 Volts monitor | 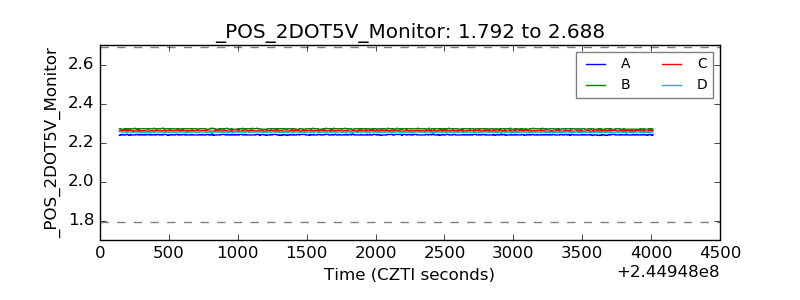 |
| +5 Volts monitor |  |
| _ROLL_ROT | 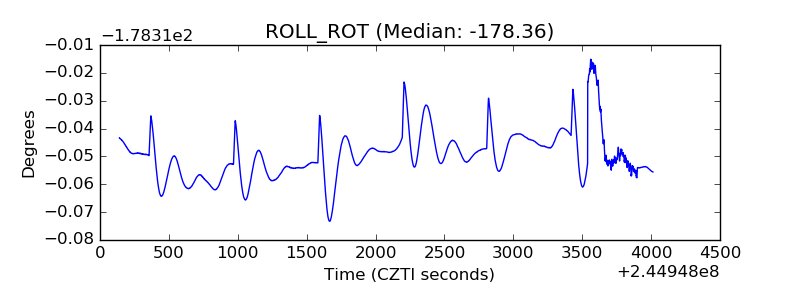 |
| _Roll_DEC | 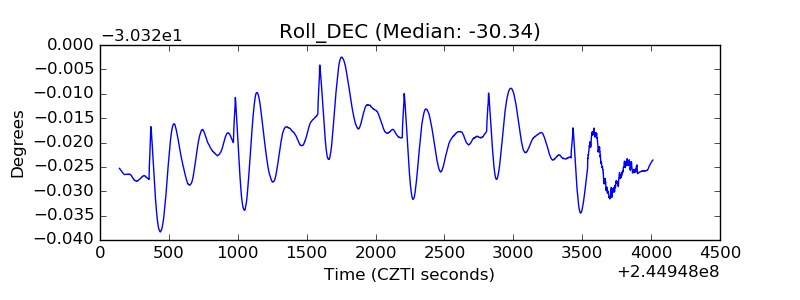 |
| _Roll_RA | 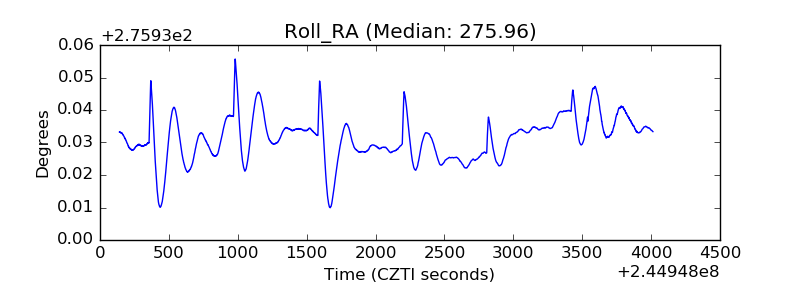 |
| Veto Counter | 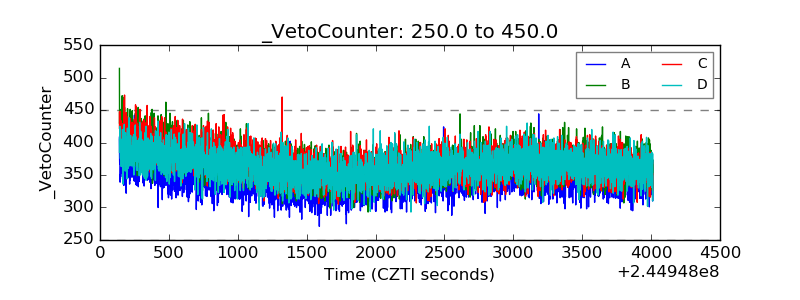 |