| Param | Original file | Final file |
|---|---|---|
| Filename | modeM0/AS1G08_039T01_9000001582cztM0_level2.fits | modeM0/AS1G08_039T01_9000001582cztM0_level2_quad_clean.evt |
| Size (bytes) | 223,312,320 | 206,375,040 |
| Size | 213.0 MB | 196.8 MB |
| Events in quadrant A | 1,342,268 | 1,198,104 |
| Events in quadrant B | 1,286,090 | 1,187,620 |
| Events in quadrant C | 1,330,144 | 1,161,963 |
| Events in quadrant D | 1,140,630 | 1,038,149 |
| Mode M0 | |||
|---|---|---|---|
| Quadrant | BADHDUFLAG | Total packets | Discarded packets |
| A | 0 | 55763 | 0 |
| B | 0 | 63461 | 0 |
| C | 0 | 49585 | 0 |
| D | 0 | 57247 | 0 |
| Mode M9 | |||
|---|---|---|---|
| Quadrant | BADHDUFLAG | Total packets | Discarded packets |
| A | 0 | 27 | 0 |
| B | 0 | 27 | 0 |
| C | 0 | 27 | 0 |
| D | 0 | 27 | 0 |
| Mode SS | |||
|---|---|---|---|
| Quadrant | BADHDUFLAG | Total packets | Discarded packets |
| A | 0 | 492 | 0 |
| B | 0 | 492 | 0 |
| C | 0 | 492 | 0 |
| D | 0 | 492 | 0 |
| Quadrant | Total seconds | Saturated seconds | Saturation percentage |
|---|---|---|---|
| A | 24172 | 685 | 2.833857% |
| B | 24172 | 1340 | 5.543604% |
| C | 24171 | 116 | 0.479914% |
| D | 24172 | 509 | 2.105742% |
Noise dominated data is calculated using 1-second bins in cleaned event files. If a bin has >2000 counts, and if more than 50% of those come from <1% of pixels, then it is considered to be noise-dominated and hence unusable.
| Quadrant | # 1 sec bins | Bins with >0 counts | Bins with >2000 counts | High rate bins dominated by noise | Noise dominated (total time) | Noise dominated (detector-on time) | Marked lightcurve |
|---|---|---|---|---|---|---|---|
| A | 26897 | 24143 | 0 | 0 | 0.00% | 0.00% | 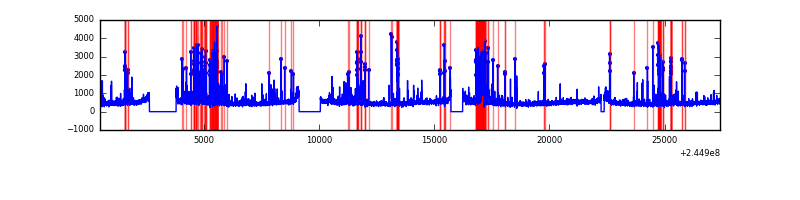 |
| B | 26897 | 24172 | 0 | 0 | 0.00% | 0.00% | 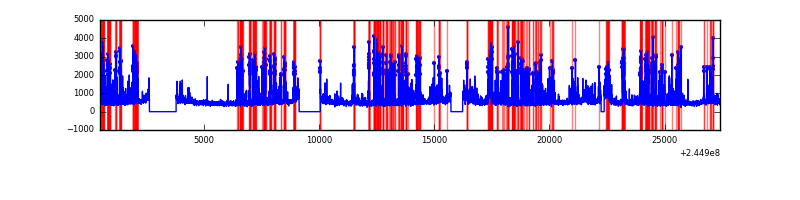 |
| C | 26897 | 24172 | 0 | 0 | 0.00% | 0.00% |  |
| D | 26897 | 24147 | 0 | 0 | 0.00% | 0.00% | 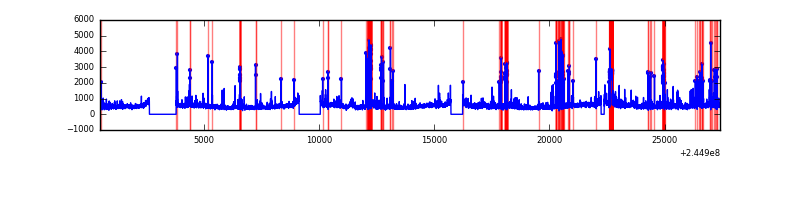 |
Top three noisy pixels from each quadrant. If the there are fewer than three noisy pixels in the level2.evt file, extra rows are filled as -1
| Pixel properties | Quadrant properties | ||||||
|---|---|---|---|---|---|---|---|
| Quadrant | DetID | PixID | Counts | Sigma | Mean | Median | Sigma |
| A | 14 | 188 | 1332 | 11.39 | 348 | 326 | 88.4 |
| A | 0 | 29 | 1292 | 10.93 | 348 | 326 | 88.4 |
| A | 7 | 110 | 1166 | 9.51 | 348 | 326 | 88.4 |
| B | 2 | 9 | 1080 | 10.85 | 339 | 323 | 69.8 |
| B | 14 | 254 | 887 | 8.08 | 339 | 323 | 69.8 |
| B | 3 | 17 | 878 | 7.95 | 339 | 323 | 69.8 |
| C | 12 | 241 | 966 | 6.94 | 351 | 325 | 92.3 |
| C | 3 | 158 | 887 | 6.09 | 351 | 325 | 92.3 |
| C | 9 | 233 | 878 | 5.99 | 351 | 325 | 92.3 |
| D | 7 | 5 | 836 | 6.14 | 325 | 295 | 88.1 |
| D | 6 | 231 | 825 | 6.01 | 325 | 295 | 88.1 |
| D | 6 | 67 | 825 | 6.01 | 325 | 295 | 88.1 |
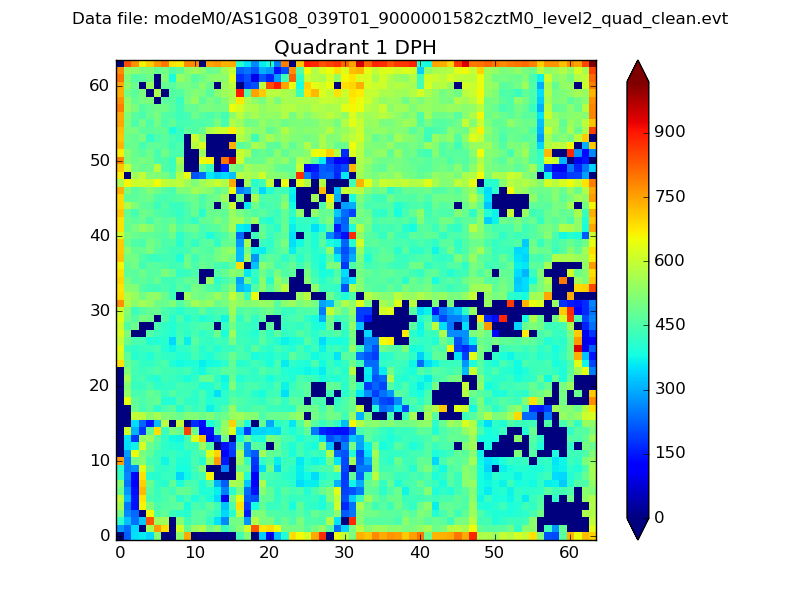
Histogram calculated using DETX and DETY for each event in the final _common_clean file
| Quadrant A | 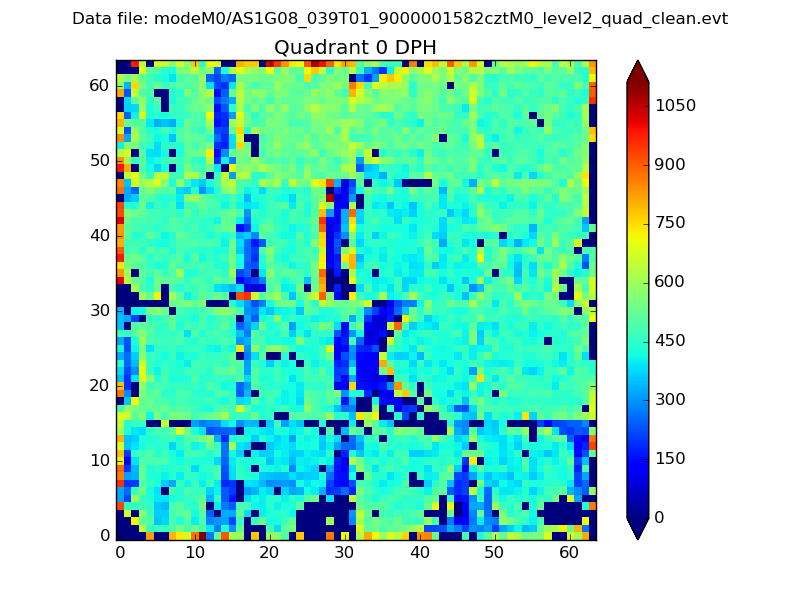 |
 |
Quadrant B |
|---|---|---|---|
| Quadrant D | 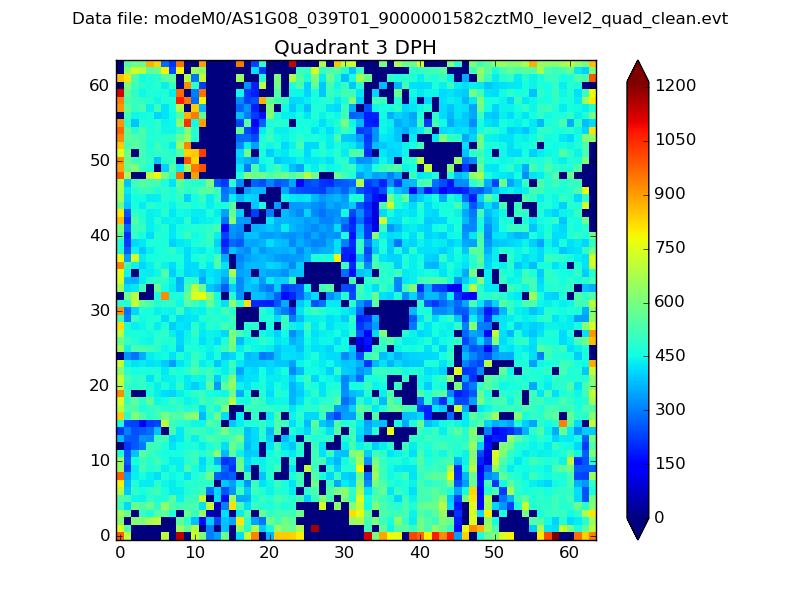 |
 |
Quadrant C |
| Plot type | Count rate plots | Images |
|---|---|---|
| Comparison with Poisson distribution Blue bars denote a histogram of data divided into 1 sec bins. Red curve is a Poisson curve with rate = median count rate of data. |
 |
 |
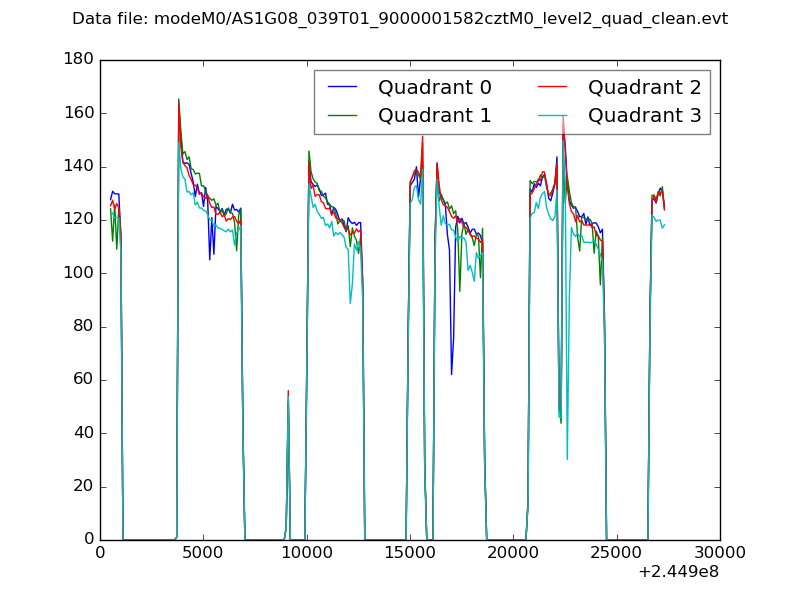
| Quadrant-wise count rates Data is divided into 100 sec bins |
 |
|
| Module-wise count rates for Quadrant A Data is divided into 100 sec bins |
 |
 |
| Module-wise count rates for Quadrant B Data is divided into 100 sec bins |
 |
 |
| Module-wise count rates for Quadrant C Data is divided into 100 sec bins |
 |
 |
| Module-wise count rates for Quadrant D Data is divided into 100 sec bins |
 |
 |
| Parameter | Plot |
|---|---|
| CZT HV Monitor | 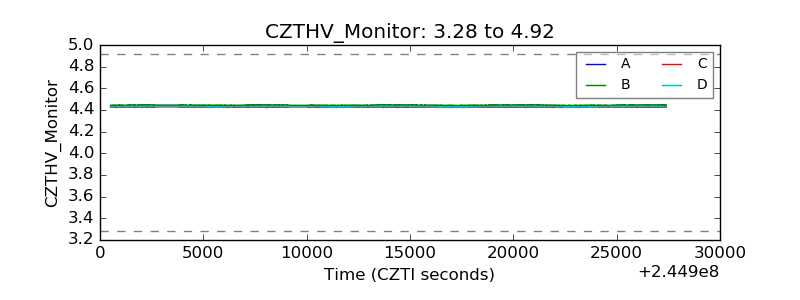 |
| D_VDD | 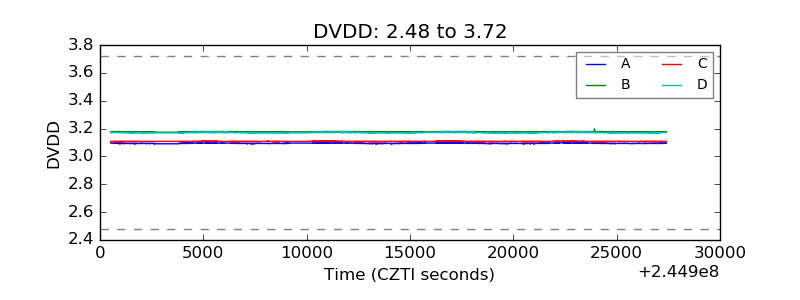 |
| Temperature 1 |  |
| Veto HV Monitor |  |
| Veto LLD | 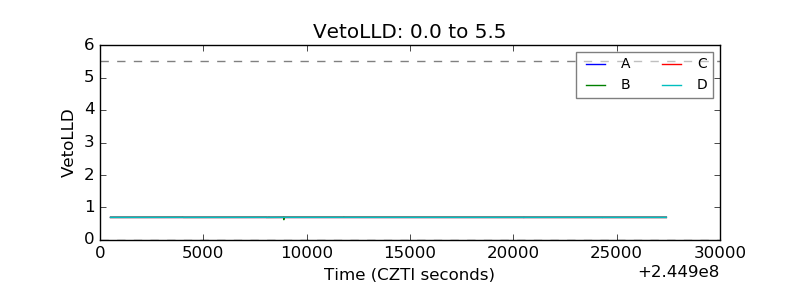 |
| Alpha Counter |  |
| _CPM_Rate | 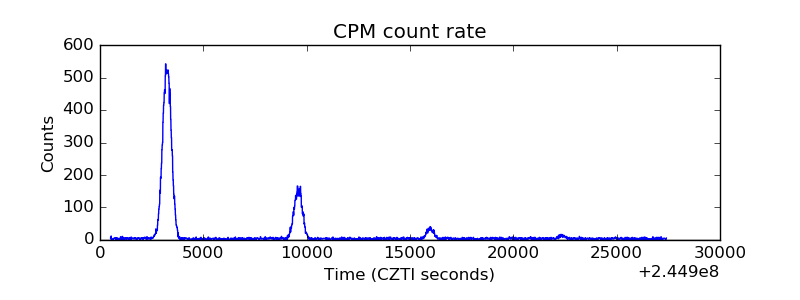 |
| CZT Counter |  |
| +2.5 Volts monitor | 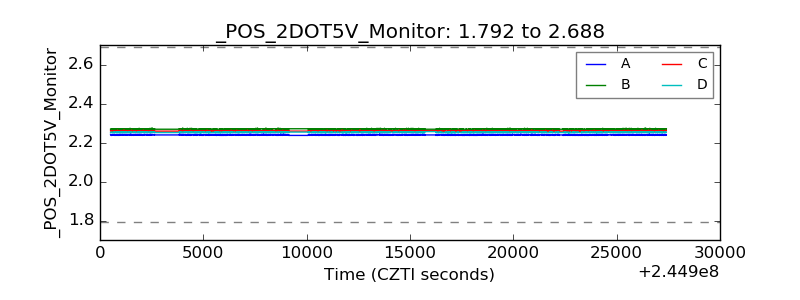 |
| +5 Volts monitor | 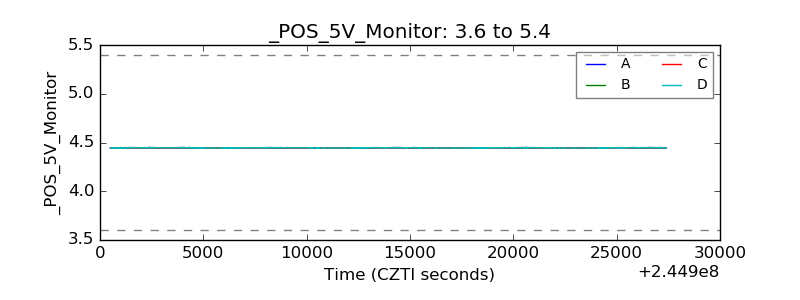 |
| _ROLL_ROT | 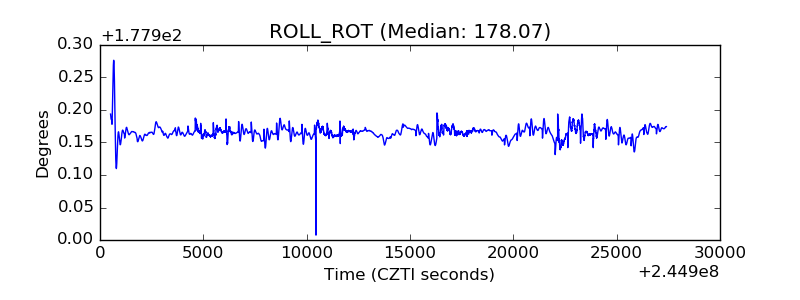 |
| _Roll_DEC | 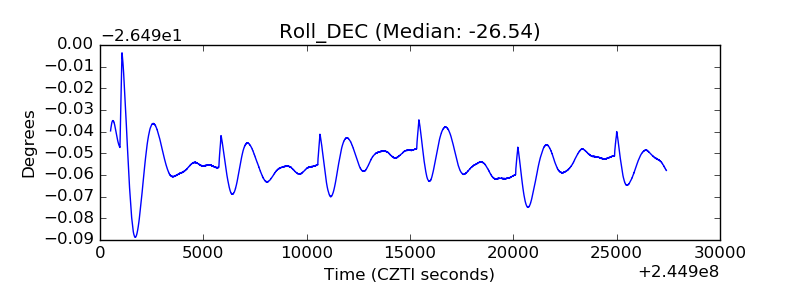 |
| _Roll_RA | 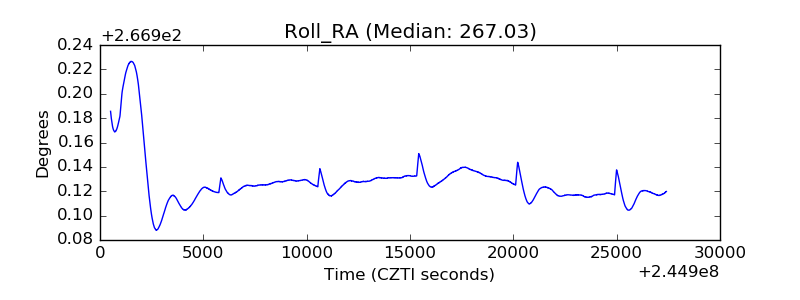 |
| Veto Counter |  |