| Param | Original file | Final file |
|---|---|---|
| Filename | modeM0/AS1G08_039T01_9000001582_10933cztM0_level2.evt | modeM0/AS1G08_039T01_9000001582_10933cztM0_level2_quad_clean.evt |
| Size (bytes) | 330,989,760 | 48,669,120 |
| Size | 315.7 MB | 46.4 MB |
| Events in quadrant A | 2,277,214 | 295,913 |
| Events in quadrant B | 2,859,318 | 289,822 |
| Events in quadrant C | 1,909,826 | 291,215 |
| Events in quadrant D | 2,666,023 | 275,239 |
| Mode M0 | |||
|---|---|---|---|
| Quadrant | BADHDUFLAG | Total packets | Discarded packets |
| A | 0 | 9875 | 0 |
| B | 0 | 11508 | 0 |
| C | 0 | 9145 | 2 |
| D | 0 | 10810 | 0 |
| Mode SS | |||
|---|---|---|---|
| Quadrant | BADHDUFLAG | Total packets | Discarded packets |
| A | 0 | 92 | 0 |
| B | 0 | 92 | 0 |
| C | 0 | 92 | 0 |
| D | 0 | 92 | 0 |
| Quadrant | Total seconds | Saturated seconds | Saturation percentage |
|---|---|---|---|
| A | 4567 | 65 | 1.423254% |
| B | 4567 | 176 | 3.853733% |
| C | 4566 | 3 | 0.065703% |
| D | 4567 | 59 | 1.291877% |
Noise dominated data is calculated using 1-second bins in cleaned event files. If a bin has >2000 counts, and if more than 50% of those come from <1% of pixels, then it is considered to be noise-dominated and hence unusable.
| Quadrant | # 1 sec bins | Bins with >0 counts | Bins with >2000 counts | High rate bins dominated by noise | Noise dominated (total time) | Noise dominated (detector-on time) | Marked lightcurve |
|---|---|---|---|---|---|---|---|
| A | 4567 | 4567 | 56 | 56 | 1.23% | 1.23% |  |
| B | 4567 | 4567 | 124 | 124 | 2.72% | 2.72% | 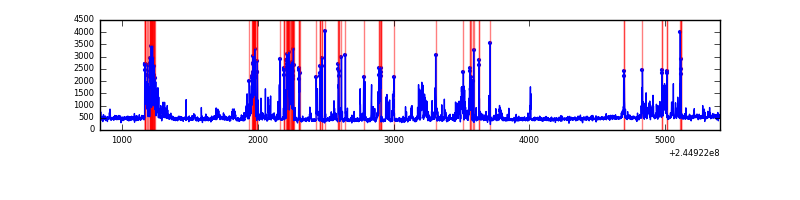 |
| C | 4567 | 4567 | 0 | 0 | 0.00% | 0.00% | 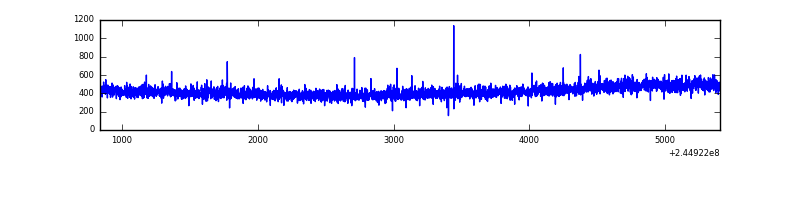 |
| D | 4567 | 4567 | 48 | 48 | 1.05% | 1.05% | 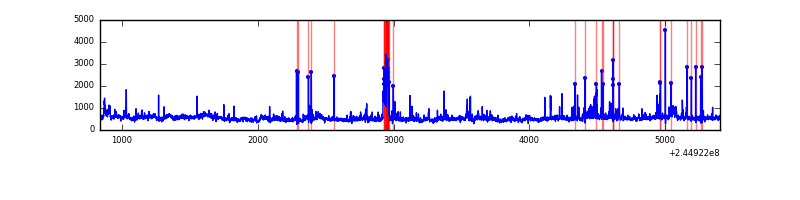 |
Top three noisy pixels from each quadrant. If the there are fewer than three noisy pixels in the level2.evt file, extra rows are filled as -1
| Pixel properties | Quadrant properties | ||||||
|---|---|---|---|---|---|---|---|
| Quadrant | DetID | PixID | Counts | Sigma | Mean | Median | Sigma |
| A | 8 | 5 | 263165 | 2509.71 | 505 | 496 | 104.7 |
| A | 15 | 223 | 35502 | 334.47 | 505 | 496 | 104.7 |
| A | 15 | 239 | 16589 | 153.76 | 505 | 496 | 104.7 |
| B | 4 | 239 | 821114 | 8425.18 | 506 | 493 | 97.4 |
| B | 15 | 204 | 15828 | 157.44 | 506 | 493 | 97.4 |
| B | 0 | 219 | 14254 | 141.28 | 506 | 493 | 97.4 |
| C | 13 | 61 | 3734 | 28.39 | 489 | 491 | 114.2 |
| C | 8 | 222 | 1963 | 12.88 | 489 | 491 | 114.2 |
| C | 12 | 4 | 1352 | 7.54 | 489 | 491 | 114.2 |
| D | 8 | 195 | 367696 | 3073.92 | 484 | 470 | 119.5 |
| D | 1 | 52 | 252503 | 2109.68 | 484 | 470 | 119.5 |
| D | 14 | 34 | 93336 | 777.35 | 484 | 470 | 119.5 |
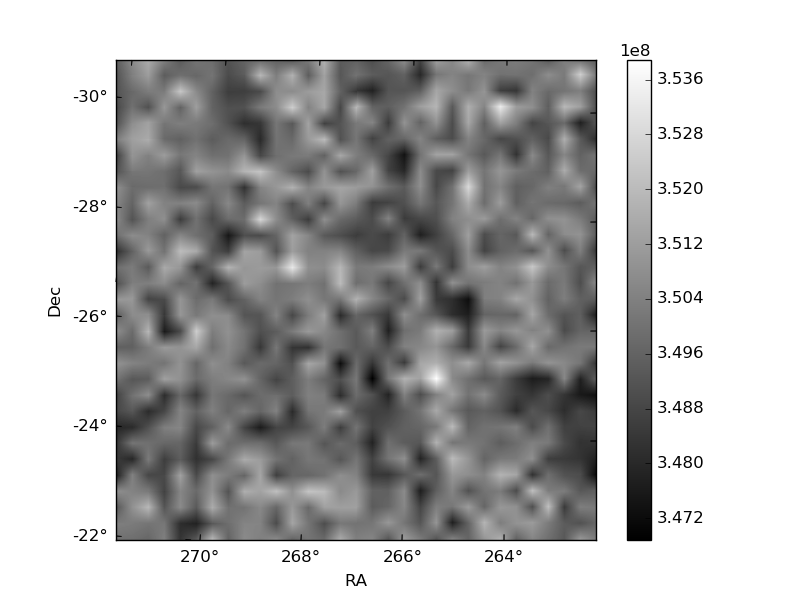
Histogram calculated using DETX and DETY for each event in the final _common_clean file
| Quadrant A |  |
 |
Quadrant B |
|---|---|---|---|
| Quadrant D |  |
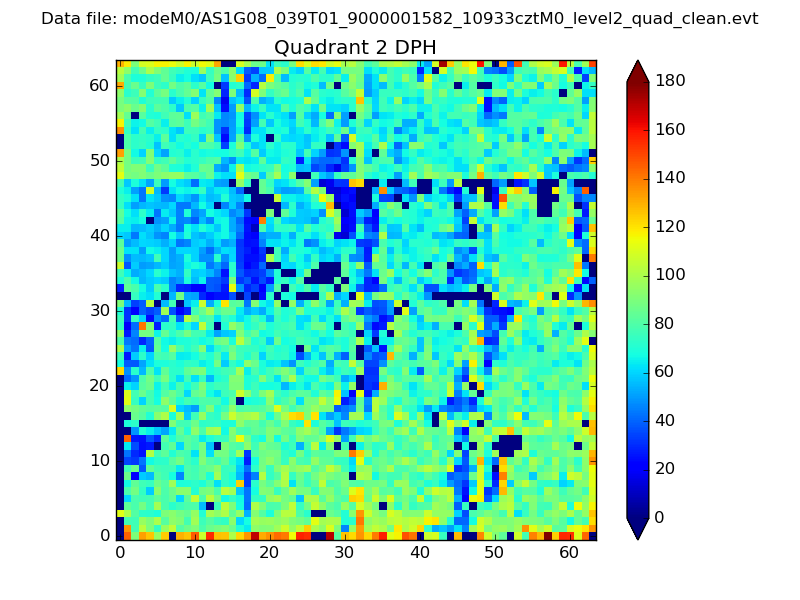 |
Quadrant C |
| Plot type | Count rate plots | Images |
|---|---|---|
| Comparison with Poisson distribution Blue bars denote a histogram of data divided into 1 sec bins. Red curve is a Poisson curve with rate = median count rate of data. |
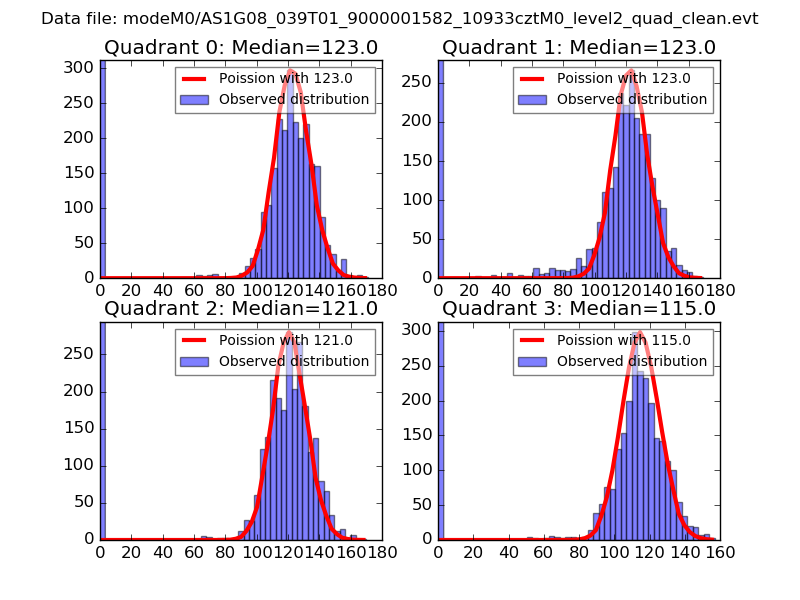 |
 |
| Quadrant-wise count rates Data is divided into 100 sec bins |
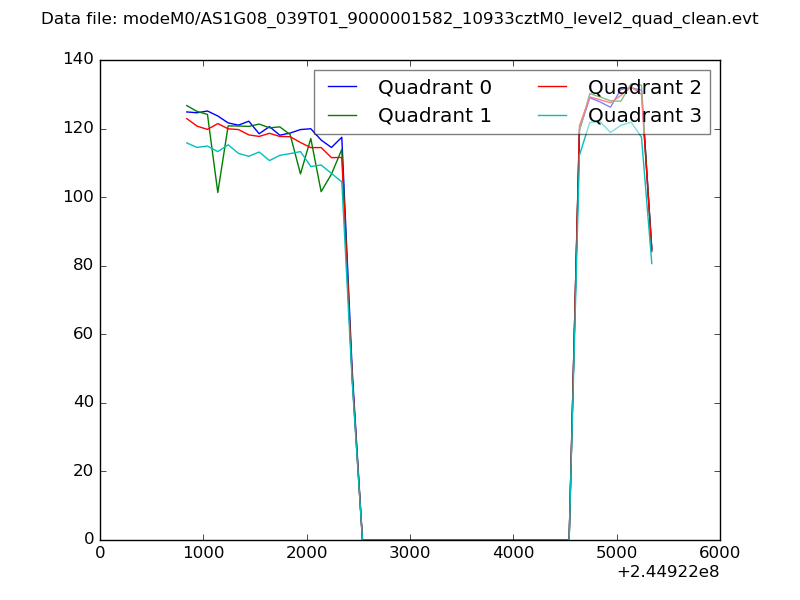 |
|
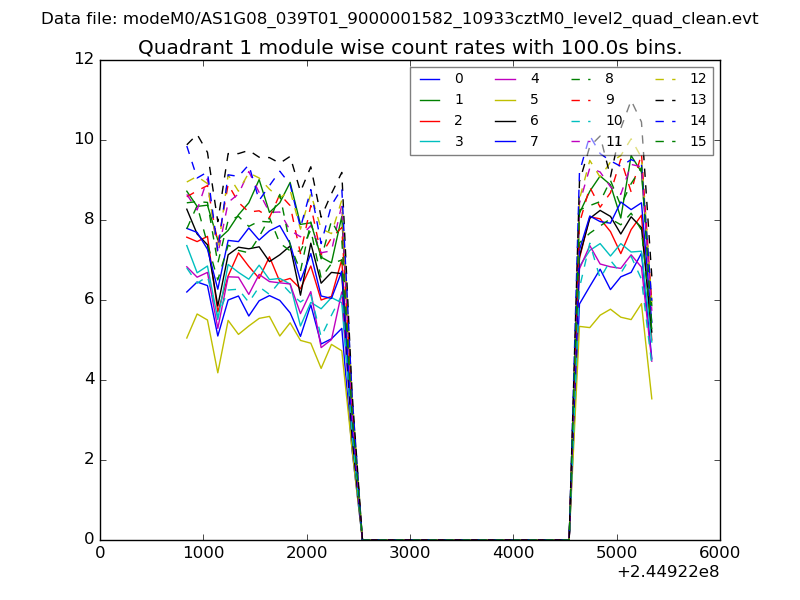
| Module-wise count rates for Quadrant A Data is divided into 100 sec bins |
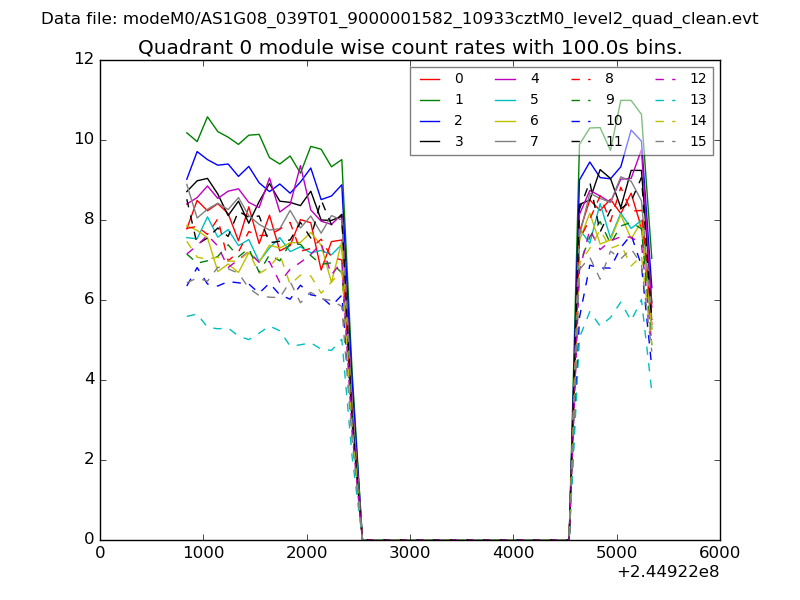 |
 |
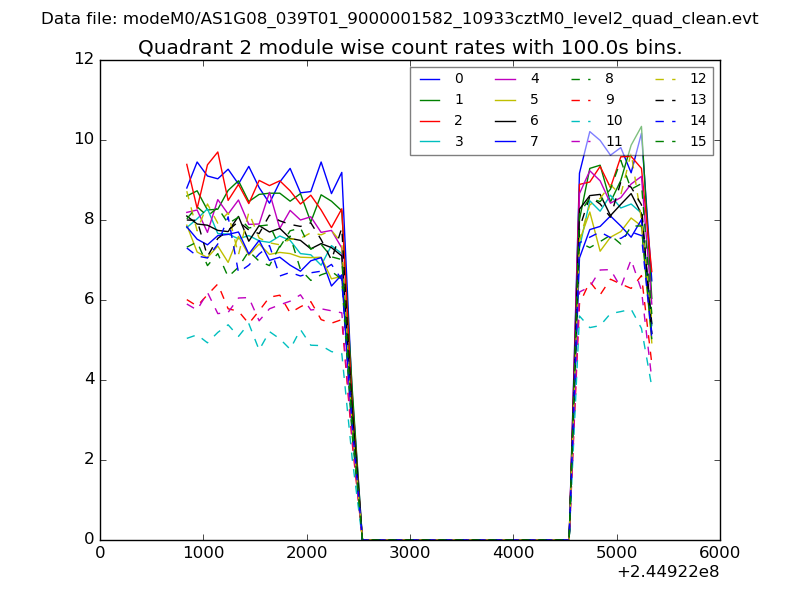
| Module-wise count rates for Quadrant B Data is divided into 100 sec bins |
 |
 |
| Module-wise count rates for Quadrant C Data is divided into 100 sec bins |
 |
 |
| Module-wise count rates for Quadrant D Data is divided into 100 sec bins |
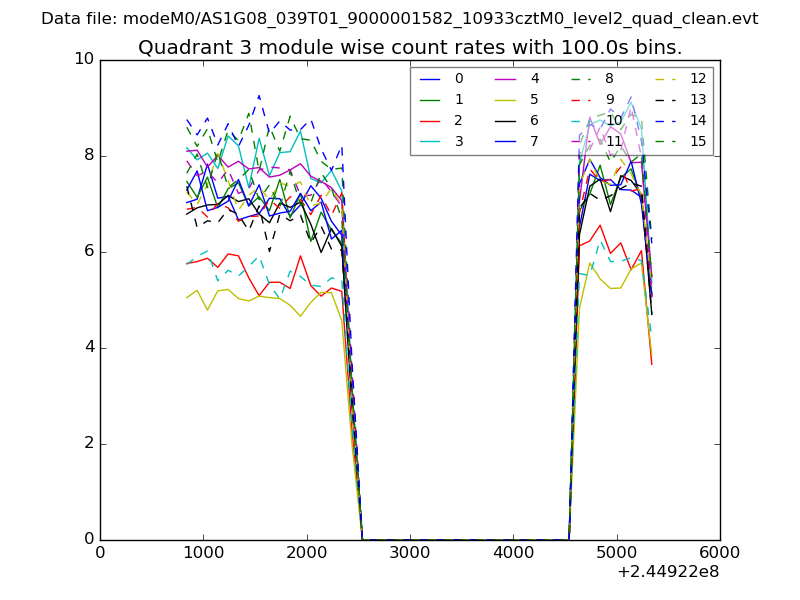 |
 |
| Parameter | Plot |
|---|---|
| CZT HV Monitor | 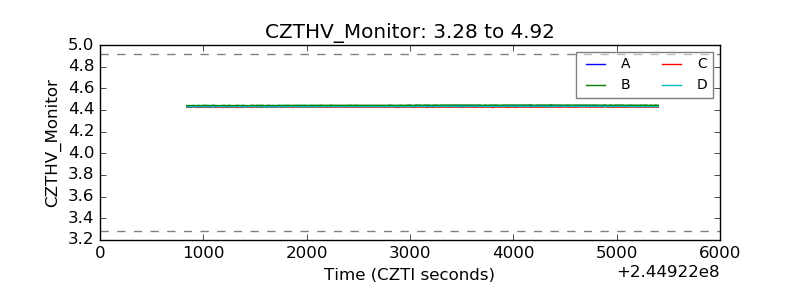 |
| D_VDD | 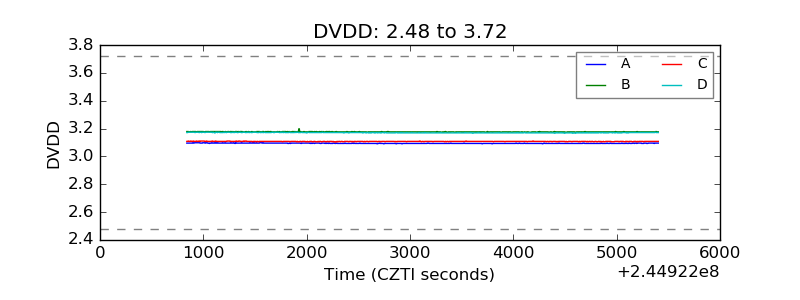 |
| Temperature 1 | 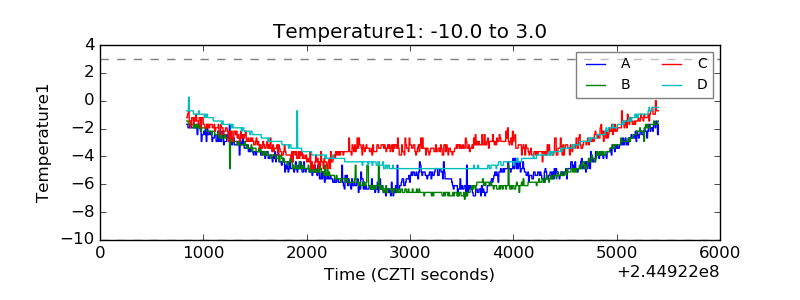 |
| Veto HV Monitor | 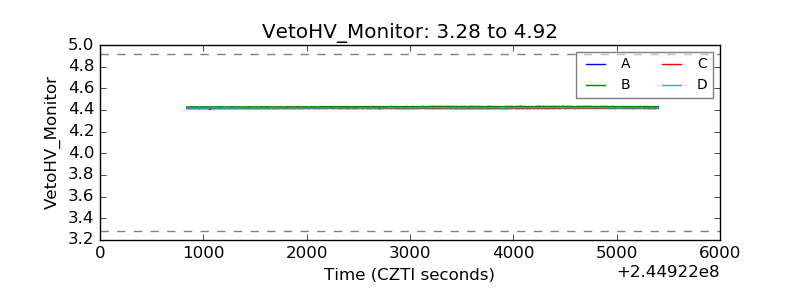 |
| Veto LLD | 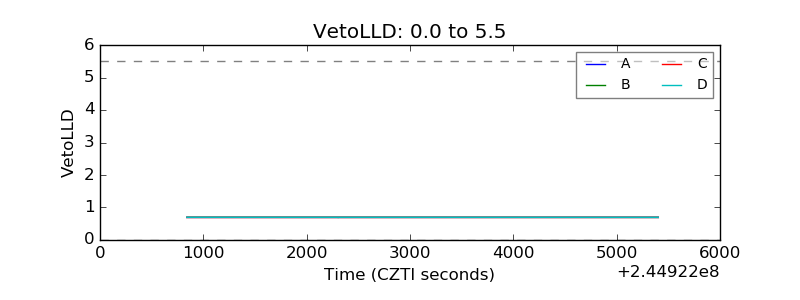 |
| Alpha Counter | 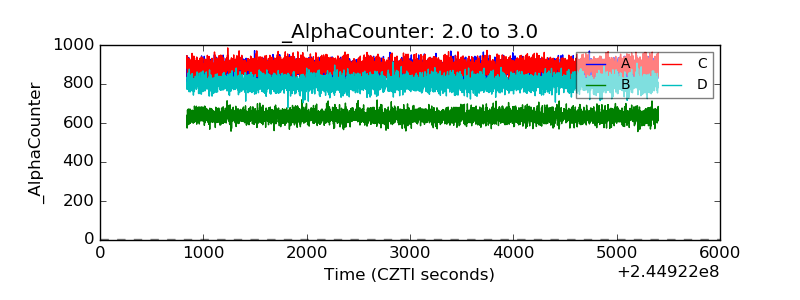 |
| _CPM_Rate | 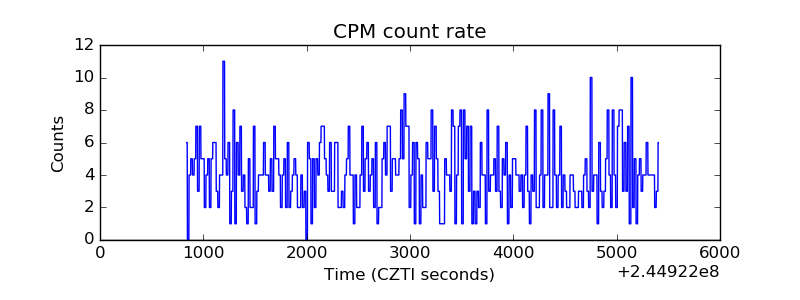 |
| CZT Counter | 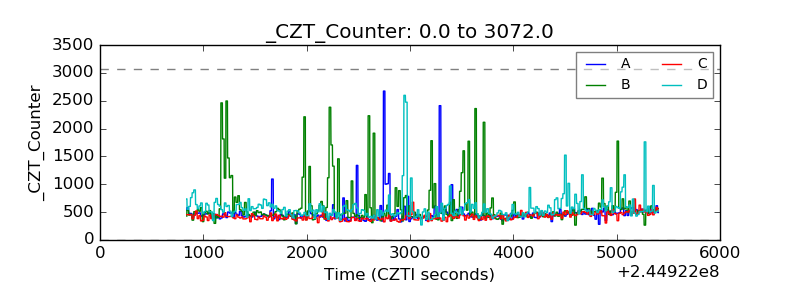 |
| +2.5 Volts monitor |  |
| +5 Volts monitor |  |
| _ROLL_ROT | 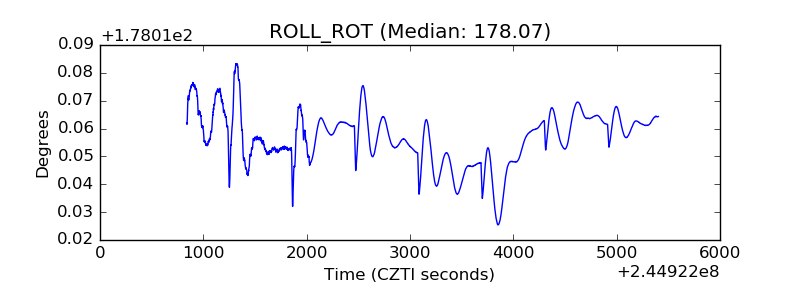 |
| _Roll_DEC | 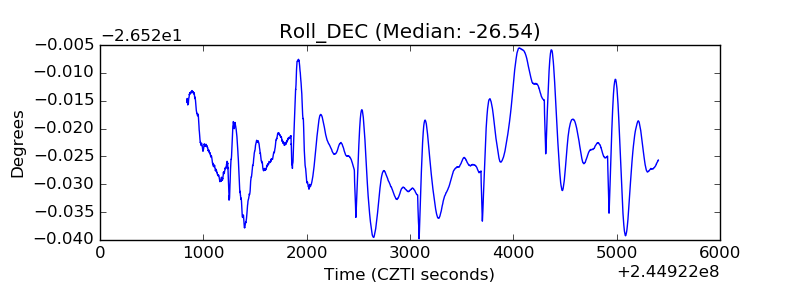 |
| _Roll_RA | 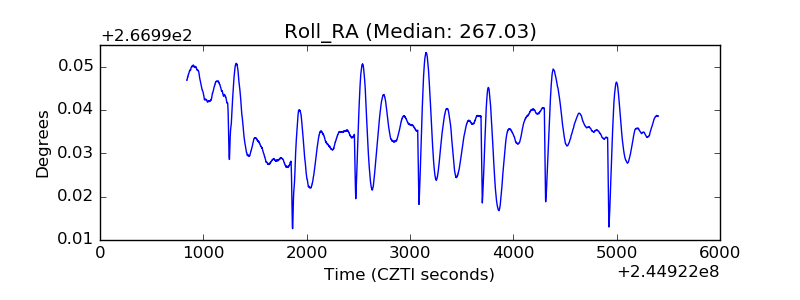 |
| Veto Counter | 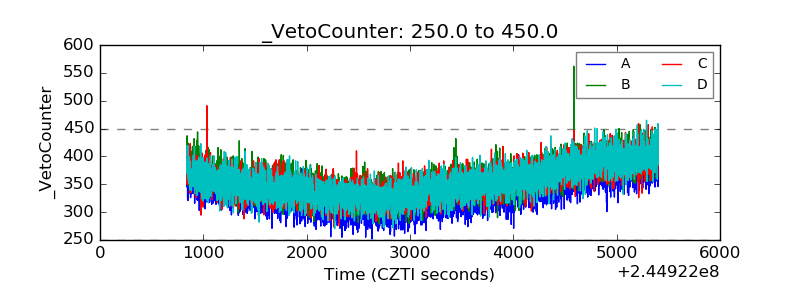 |