| Param | Original file | Final file |
|---|---|---|
| Filename | modeM0/AS1G08_068T01_9000001580cztM0_level2.fits | modeM0/AS1G08_068T01_9000001580cztM0_level2_quad_clean.evt |
| Size (bytes) | 142,096,320 | 116,055,360 |
| Size | 135.5 MB | 110.7 MB |
| Events in quadrant A | 865,942 | 646,280 |
| Events in quadrant B | 846,428 | 678,236 |
| Events in quadrant C | 877,304 | 657,725 |
| Events in quadrant D | 760,552 | 578,698 |
| Mode M0 | |||
|---|---|---|---|
| Quadrant | BADHDUFLAG | Total packets | Discarded packets |
| A | 0 | 39775 | 0 |
| B | 0 | 35519 | 0 |
| C | 0 | 29007 | 0 |
| D | 0 | 34372 | 0 |
| Mode SS | |||
|---|---|---|---|
| Quadrant | BADHDUFLAG | Total packets | Discarded packets |
| A | 0 | 280 | 0 |
| B | 0 | 282 | 0 |
| C | 0 | 282 | 0 |
| D | 0 | 282 | 0 |
| Mode M9 | |||
|---|---|---|---|
| Quadrant | BADHDUFLAG | Total packets | Discarded packets |
| A | 0 | 38 | 0 |
| B | 0 | 38 | 0 |
| C | 0 | 38 | 0 |
| D | 0 | 38 | 0 |
| Quadrant | Total seconds | Saturated seconds | Saturation percentage |
|---|---|---|---|
| A | 13796 | 1129 | 8.183531% |
| B | 13796 | 664 | 4.812989% |
| C | 13800 | 132 | 0.956522% |
| D | 13795 | 520 | 3.769482% |
Noise dominated data is calculated using 1-second bins in cleaned event files. If a bin has >2000 counts, and if more than 50% of those come from <1% of pixels, then it is considered to be noise-dominated and hence unusable.
| Quadrant | # 1 sec bins | Bins with >0 counts | Bins with >2000 counts | High rate bins dominated by noise | Noise dominated (total time) | Noise dominated (detector-on time) | Marked lightcurve |
|---|---|---|---|---|---|---|---|
| A | 17608 | 13775 | 0 | 0 | 0.00% | 0.00% |  |
| B | 17608 | 13808 | 0 | 0 | 0.00% | 0.00% | 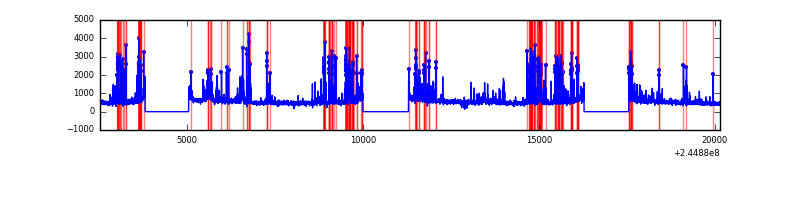 |
| C | 17608 | 13808 | 0 | 0 | 0.00% | 0.00% | 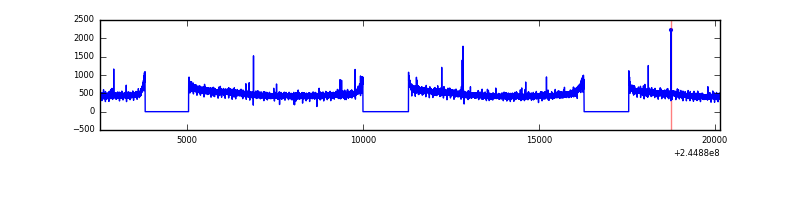 |
| D | 17608 | 13707 | 0 | 0 | 0.00% | 0.00% | 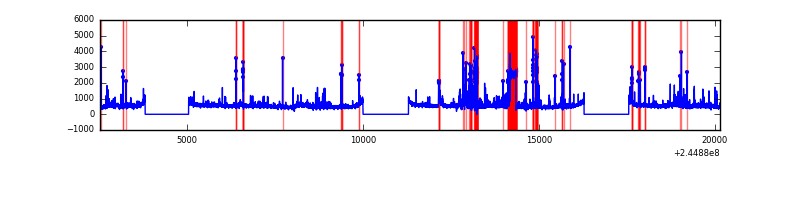 |
Top three noisy pixels from each quadrant. If the there are fewer than three noisy pixels in the level2.evt file, extra rows are filled as -1
| Pixel properties | Quadrant properties | ||||||
|---|---|---|---|---|---|---|---|
| Quadrant | DetID | PixID | Counts | Sigma | Mean | Median | Sigma |
| A | 0 | 29 | 844 | 11.09 | 226 | 213 | 56.9 |
| A | 7 | 110 | 692 | 8.42 | 226 | 213 | 56.9 |
| A | 0 | 30 | 672 | 8.07 | 226 | 213 | 56.9 |
| B | 2 | 9 | 686 | 10.23 | 224 | 215 | 46.0 |
| B | 5 | 128 | 604 | 8.45 | 224 | 215 | 46.0 |
| B | 12 | 226 | 603 | 8.43 | 224 | 215 | 46.0 |
| C | 1 | 80 | 666 | 7.38 | 231 | 218 | 60.7 |
| C | 1 | 81 | 648 | 7.08 | 231 | 218 | 60.7 |
| C | 2 | 191 | 613 | 6.51 | 231 | 218 | 60.7 |
| D | 1 | 19 | 564 | 6.2 | 217 | 199 | 58.8 |
| D | 6 | 83 | 539 | 5.78 | 217 | 199 | 58.8 |
| D | 6 | 67 | 531 | 5.64 | 217 | 199 | 58.8 |
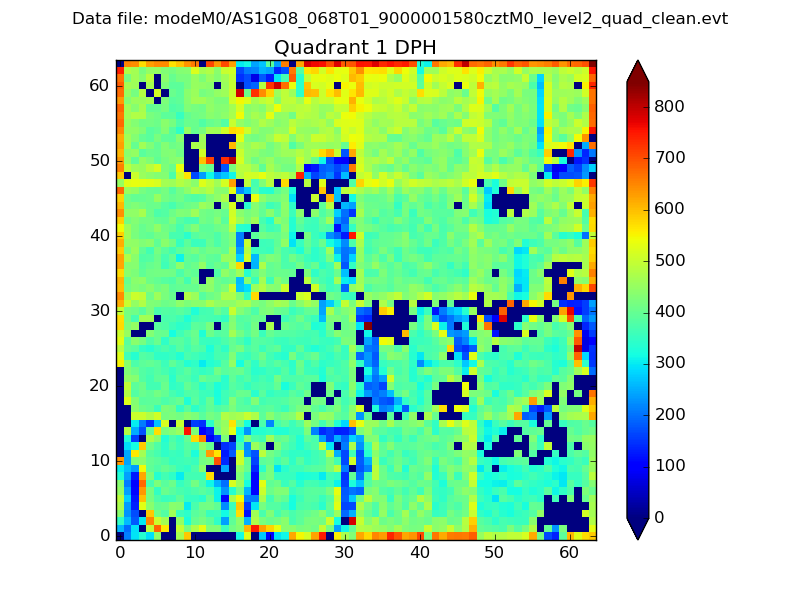
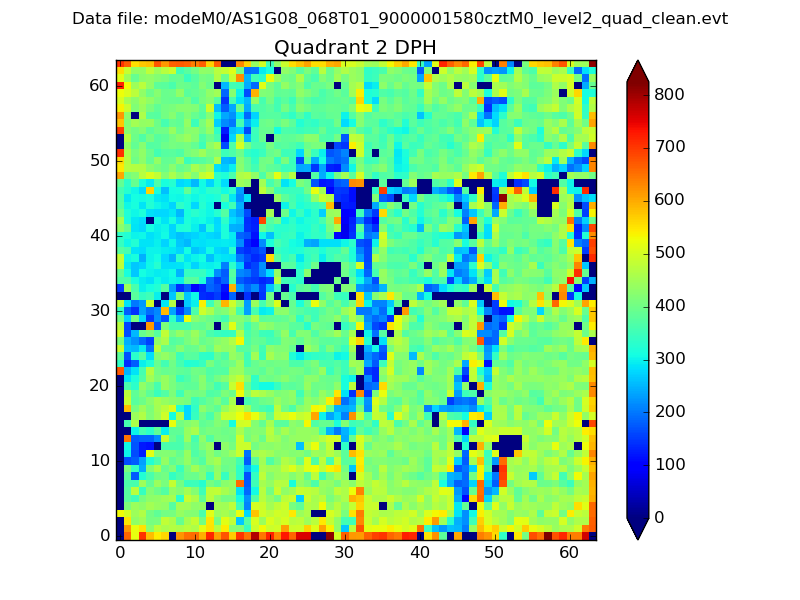
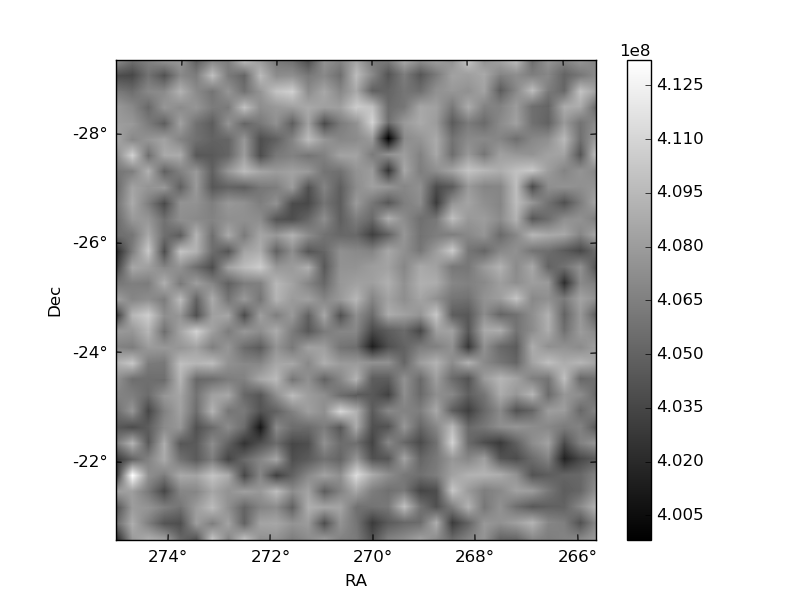
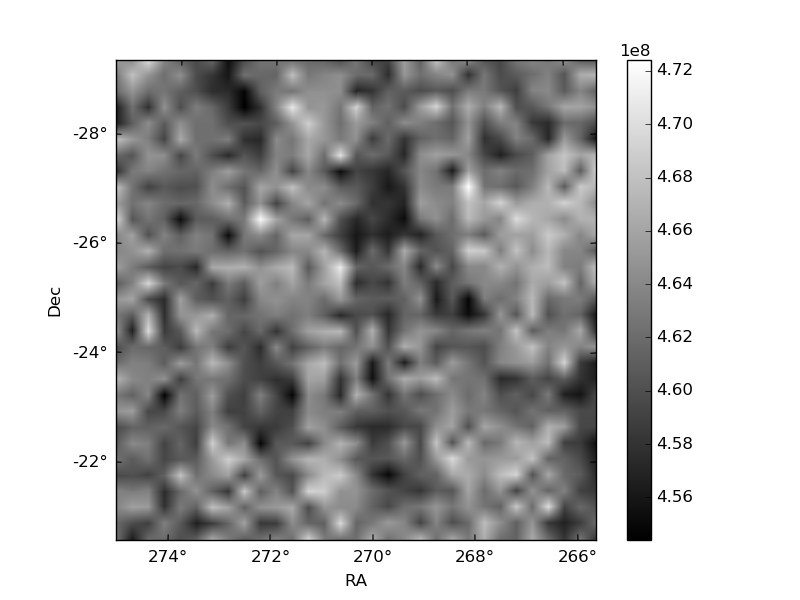
Histogram calculated using DETX and DETY for each event in the final _common_clean file
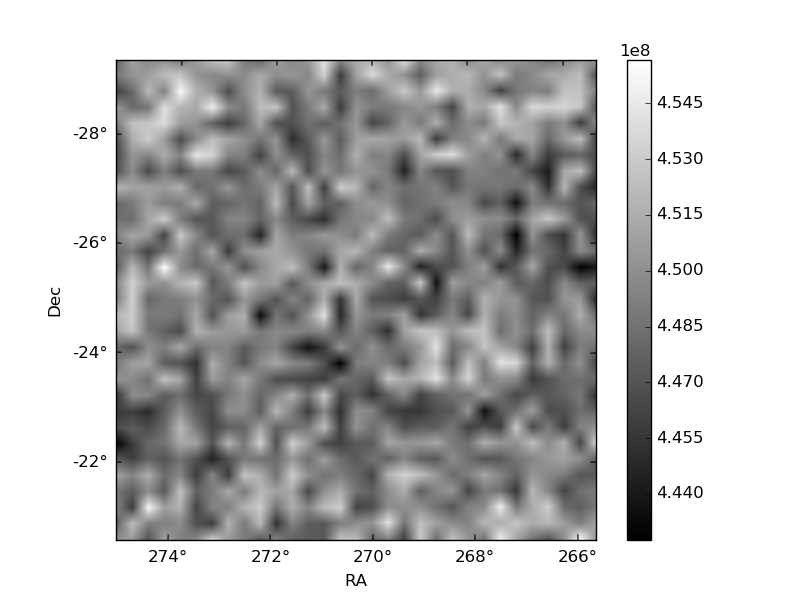
| Quadrant A | 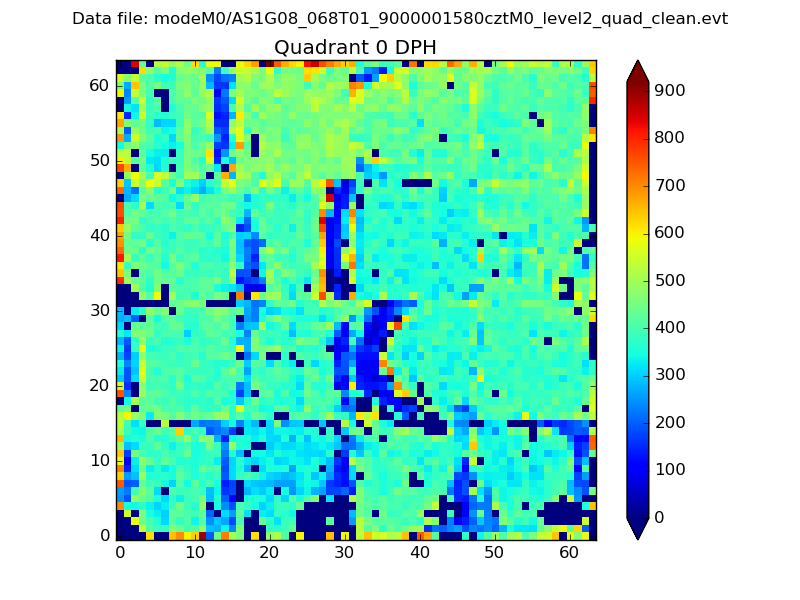 |
 |
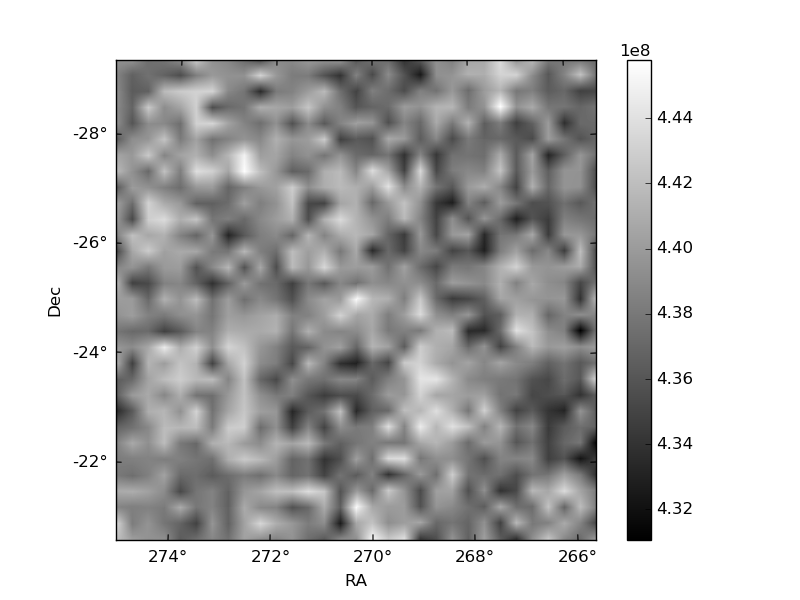
Quadrant B |
|---|---|---|---|
| Quadrant D | 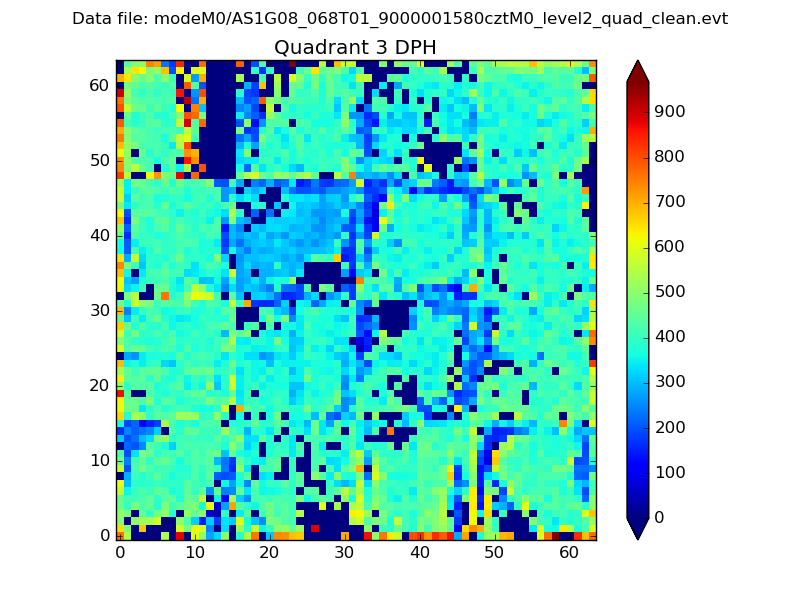 |
 |
Quadrant C |
| Plot type | Count rate plots | Images |
|---|---|---|
| Comparison with Poisson distribution Blue bars denote a histogram of data divided into 1 sec bins. Red curve is a Poisson curve with rate = median count rate of data. |
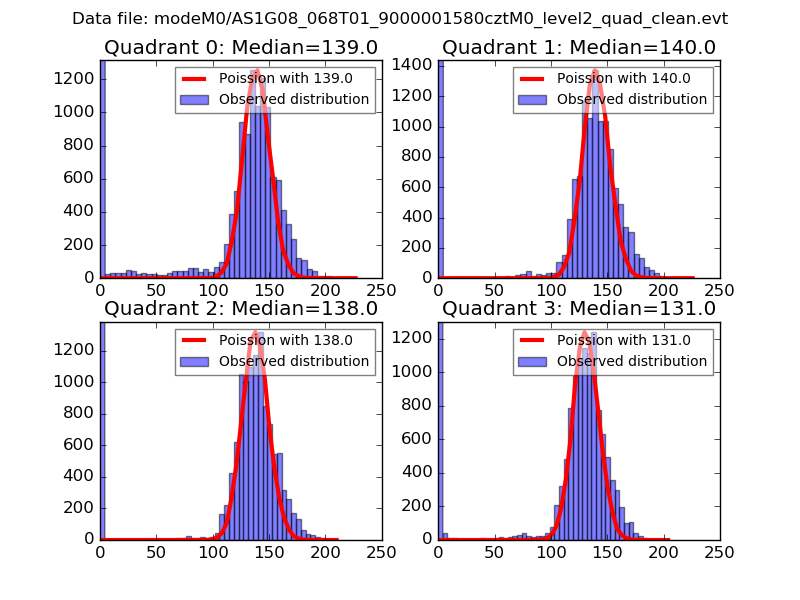 |
 |
| Quadrant-wise count rates Data is divided into 100 sec bins |
 |
|
| Module-wise count rates for Quadrant A Data is divided into 100 sec bins |
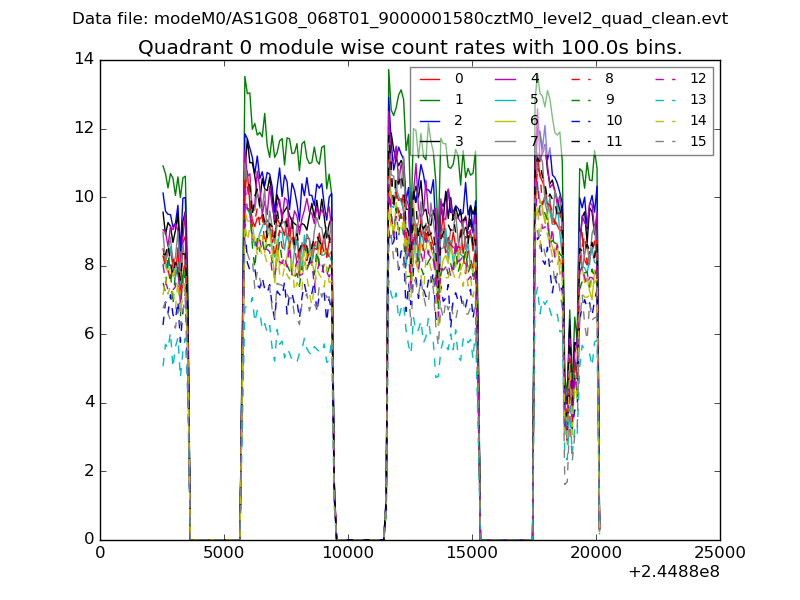 |
 |
| Module-wise count rates for Quadrant B Data is divided into 100 sec bins |
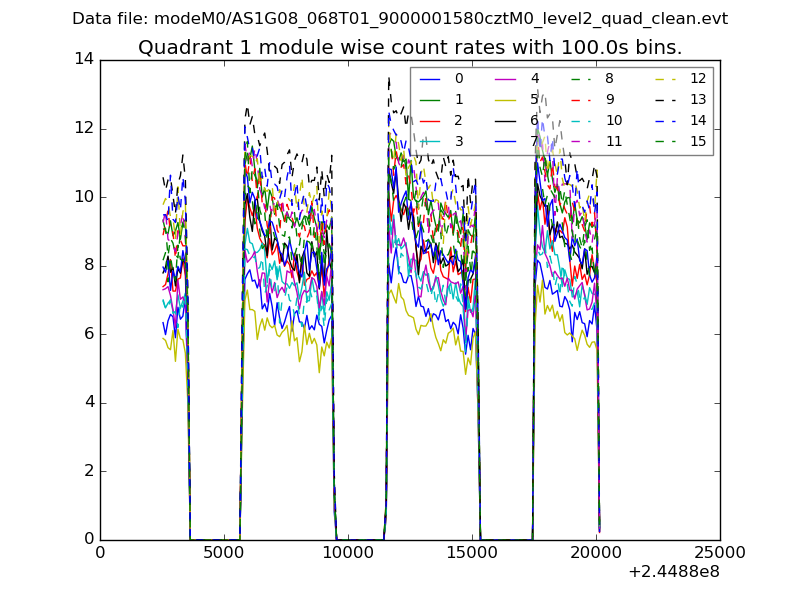 |
 |
| Module-wise count rates for Quadrant C Data is divided into 100 sec bins |
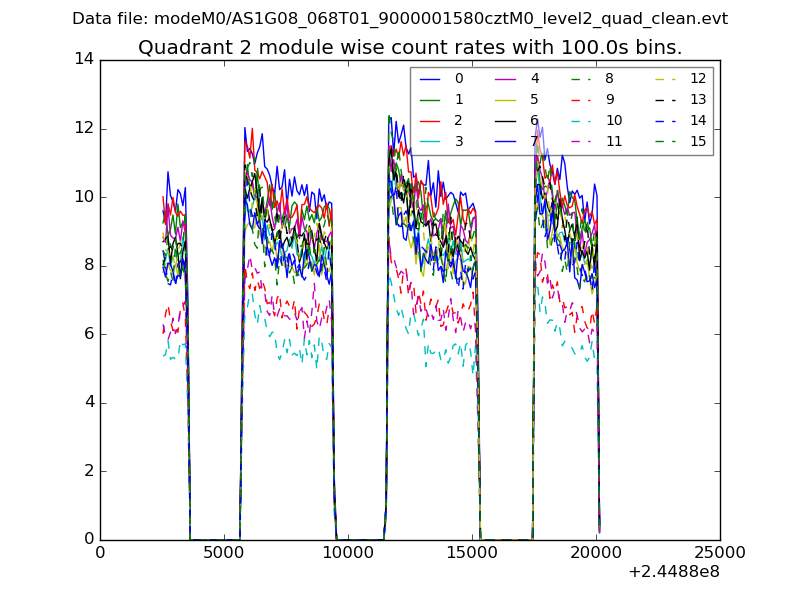 |
 |
| Module-wise count rates for Quadrant D Data is divided into 100 sec bins |
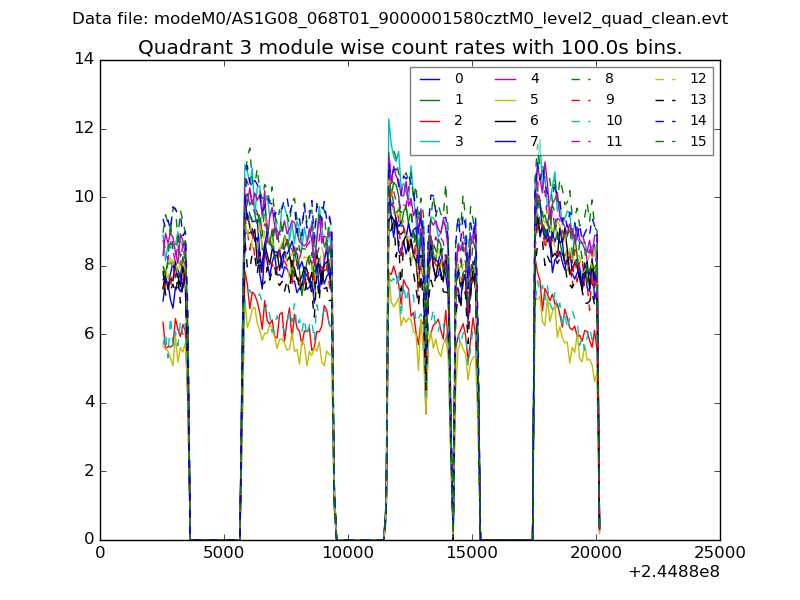 |
 |
| Parameter | Plot |
|---|---|
| CZT HV Monitor | 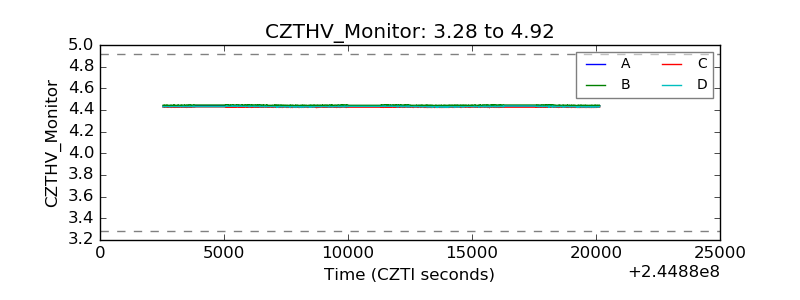 |
| D_VDD | 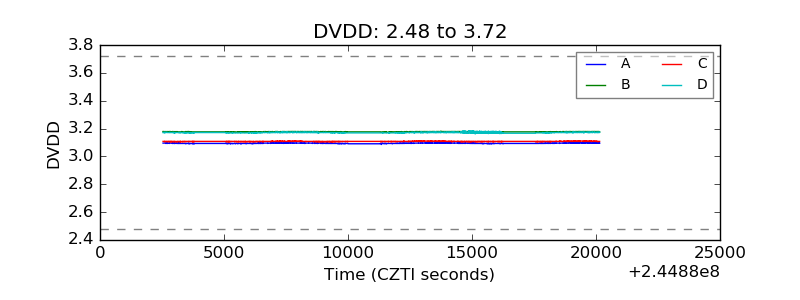 |
| Temperature 1 |  |
| Veto HV Monitor |  |
| Veto LLD | 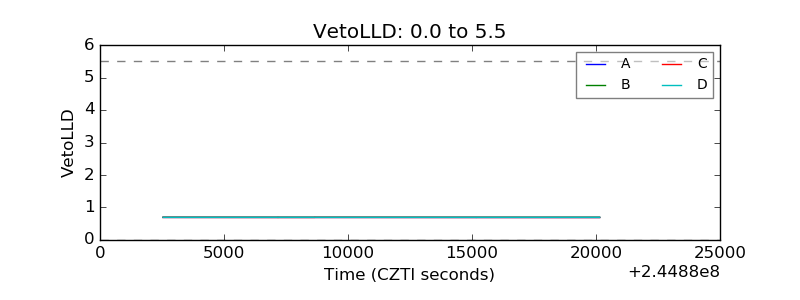 |
| Alpha Counter |  |
| _CPM_Rate | 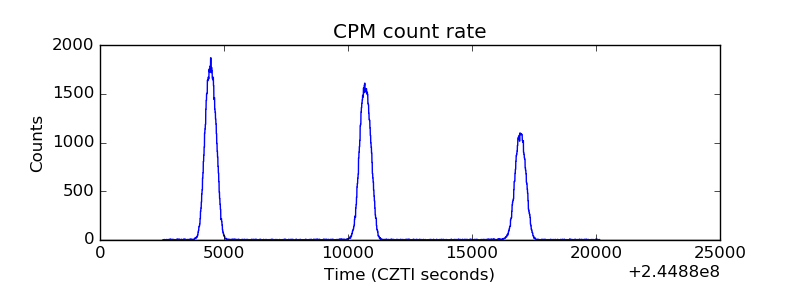 |
| CZT Counter |  |
| +2.5 Volts monitor |  |
| +5 Volts monitor | 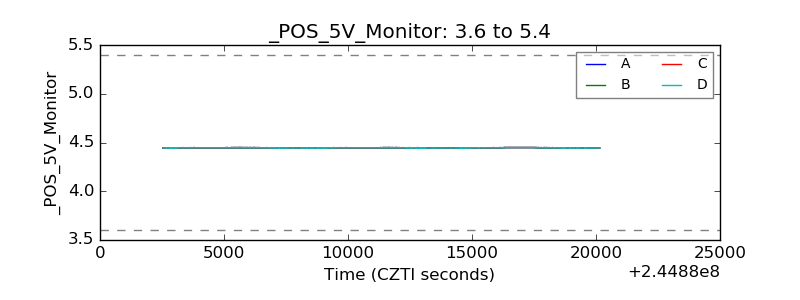 |
| _ROLL_ROT | 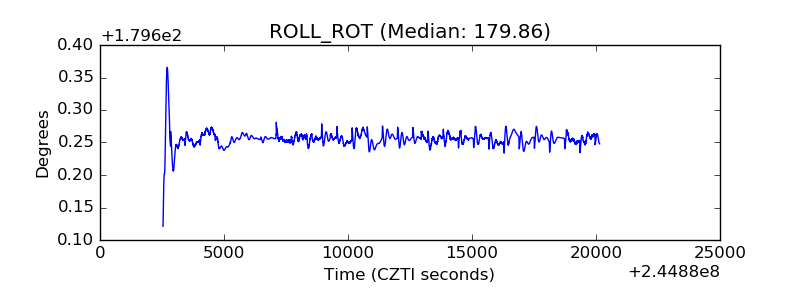 |
| _Roll_DEC | 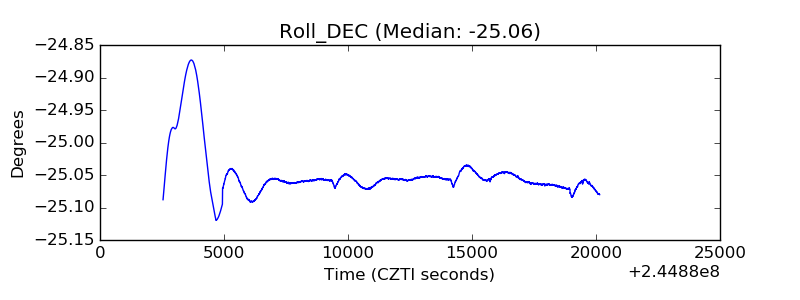 |
| _Roll_RA | 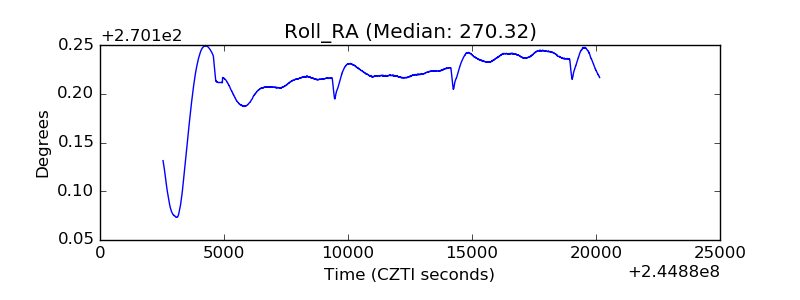 |
| Veto Counter | 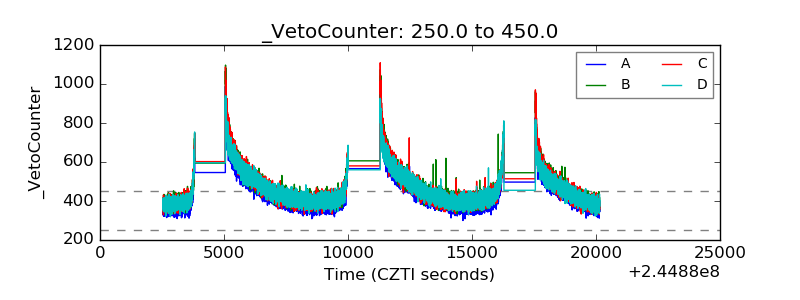 |