| Param | Original file | Final file |
|---|---|---|
| Filename | modeM0/AS1G08_068T01_9000001580_10926cztM0_level2.evt | modeM0/AS1G08_068T01_9000001580_10926cztM0_level2_quad_clean.evt |
| Size (bytes) | 228,925,440 | 36,374,400 |
| Size | 218.3 MB | 34.7 MB |
| Events in quadrant A | 2,004,267 | 227,720 |
| Events in quadrant B | 1,872,773 | 234,151 |
| Events in quadrant C | 1,365,254 | 231,949 |
| Events in quadrant D | 1,511,896 | 220,367 |
| Mode M0 | |||
|---|---|---|---|
| Quadrant | BADHDUFLAG | Total packets | Discarded packets |
| A | 0 | 7733 | 2 |
| B | 0 | 7328 | 1 |
| C | 0 | 5714 | 1 |
| D | 0 | 6121 | 1 |
| Mode SS | |||
|---|---|---|---|
| Quadrant | BADHDUFLAG | Total packets | Discarded packets |
| A | 0 | 54 | 0 |
| B | 0 | 54 | 0 |
| C | 0 | 54 | 0 |
| D | 0 | 54 | 0 |
| Mode M9 | |||
|---|---|---|---|
| Quadrant | BADHDUFLAG | Total packets | Discarded packets |
| A | 0 | 12 | 0 |
| B | 0 | 12 | 0 |
| C | 0 | 12 | 0 |
| D | 0 | 12 | 0 |
| Quadrant | Total seconds | Saturated seconds | Saturation percentage |
|---|---|---|---|
| A | 2607 | 249 | 9.551208% |
| B | 2607 | 157 | 6.022248% |
| C | 2607 | 36 | 1.380898% |
| D | 2607 | 38 | 1.457614% |
Noise dominated data is calculated using 1-second bins in cleaned event files. If a bin has >2000 counts, and if more than 50% of those come from <1% of pixels, then it is considered to be noise-dominated and hence unusable.
| Quadrant | # 1 sec bins | Bins with >0 counts | Bins with >2000 counts | High rate bins dominated by noise | Noise dominated (total time) | Noise dominated (detector-on time) | Marked lightcurve |
|---|---|---|---|---|---|---|---|
| A | 3842 | 2608 | 108 | 108 | 2.81% | 4.14% | 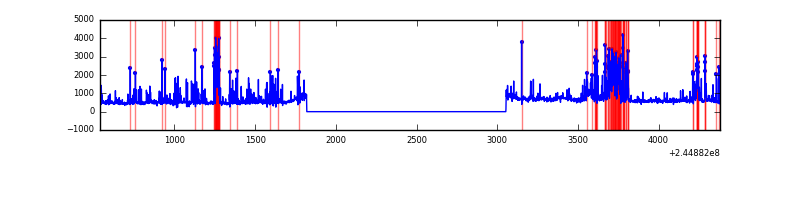 |
| B | 3842 | 2608 | 60 | 60 | 1.56% | 2.30% | 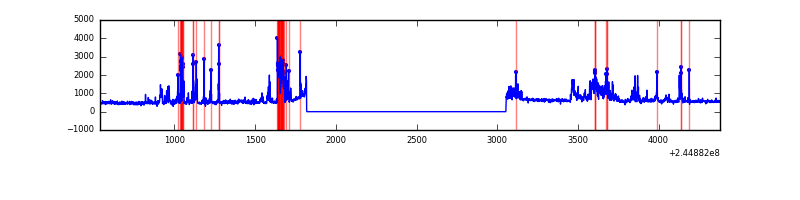 |
| C | 3842 | 2608 | 0 | 0 | 0.00% | 0.00% | 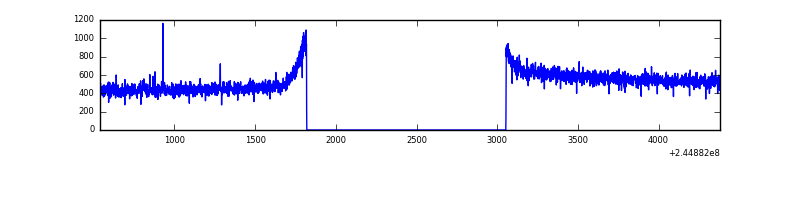 |
| D | 3842 | 2608 | 4 | 4 | 0.10% | 0.15% | 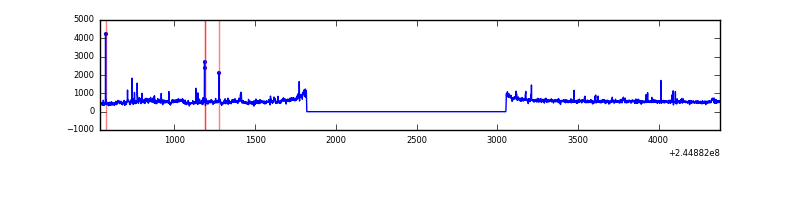 |
Top three noisy pixels from each quadrant. If the there are fewer than three noisy pixels in the level2.evt file, extra rows are filled as -1
| Pixel properties | Quadrant properties | ||||||
|---|---|---|---|---|---|---|---|
| Quadrant | DetID | PixID | Counts | Sigma | Mean | Median | Sigma |
| A | 8 | 5 | 576293 | 8019.35 | 351 | 346 | 71.8 |
| A | 15 | 223 | 32695 | 450.42 | 351 | 346 | 71.8 |
| A | 15 | 239 | 13177 | 178.66 | 351 | 346 | 71.8 |
| B | 4 | 239 | 448316 | 6582.01 | 353 | 347 | 68.1 |
| B | 11 | 51 | 10480 | 148.88 | 353 | 347 | 68.1 |
| B | 0 | 219 | 8286 | 116.65 | 353 | 347 | 68.1 |
| C | 13 | 61 | 2603 | 27.66 | 349 | 351 | 81.4 |
| C | 12 | 4 | 2033 | 20.66 | 349 | 351 | 81.4 |
| C | 8 | 222 | 1705 | 16.63 | 349 | 351 | 81.4 |
| D | 8 | 195 | 107437 | 1284.87 | 347 | 338 | 83.4 |
| D | 13 | 249 | 22783 | 269.27 | 347 | 338 | 83.4 |
| D | 5 | 97 | 16078 | 188.83 | 347 | 338 | 83.4 |
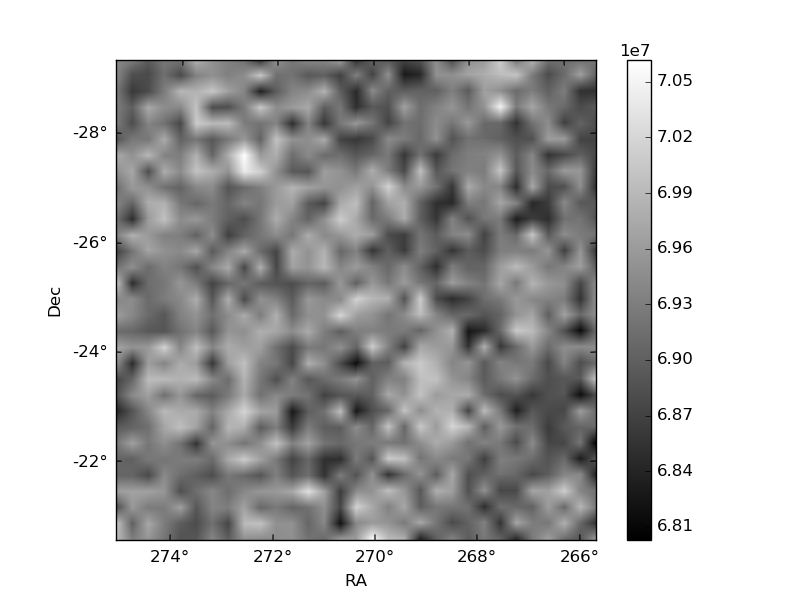
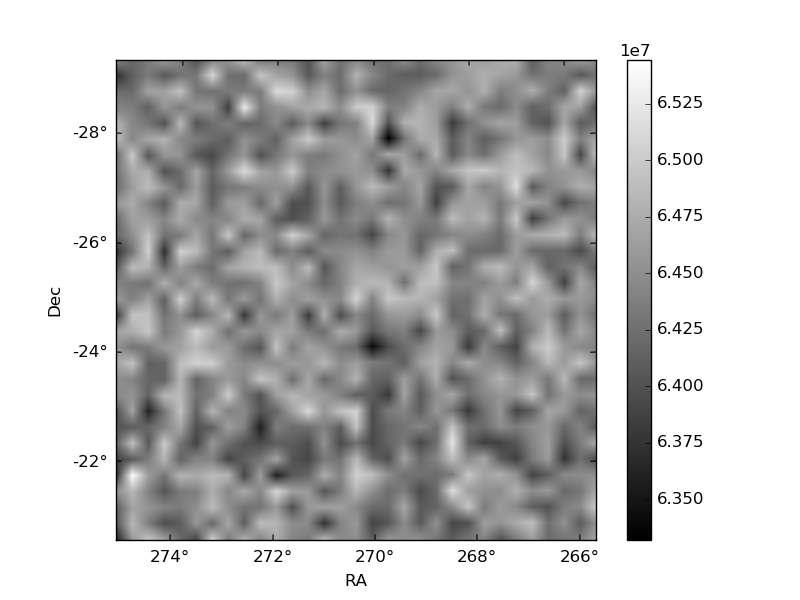
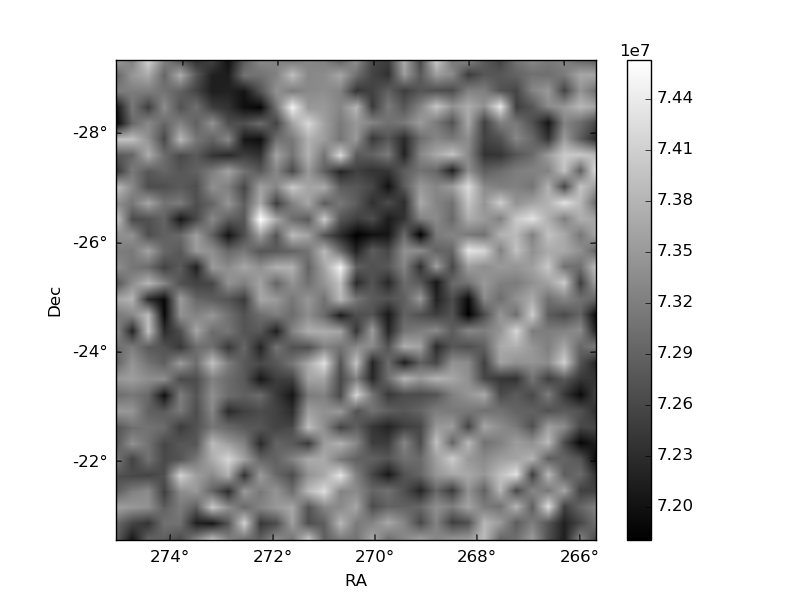
Histogram calculated using DETX and DETY for each event in the final _common_clean file
| Quadrant A | 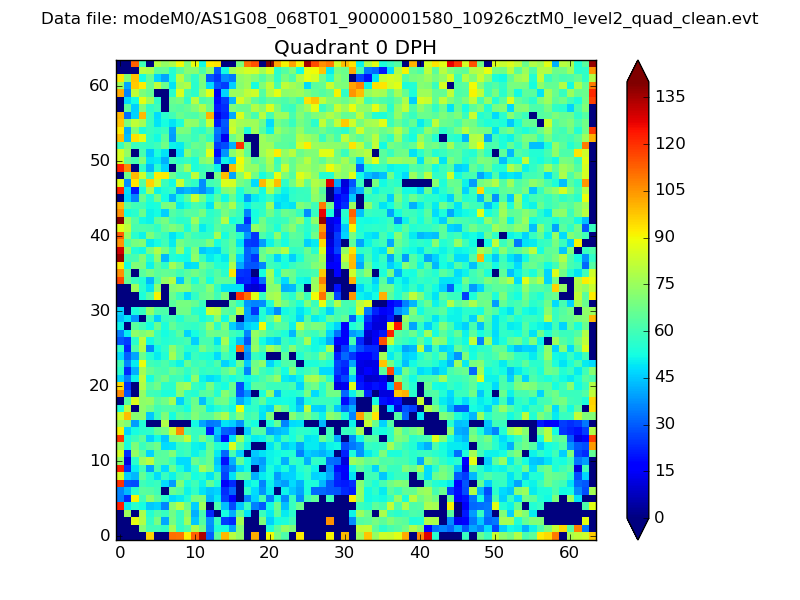 |
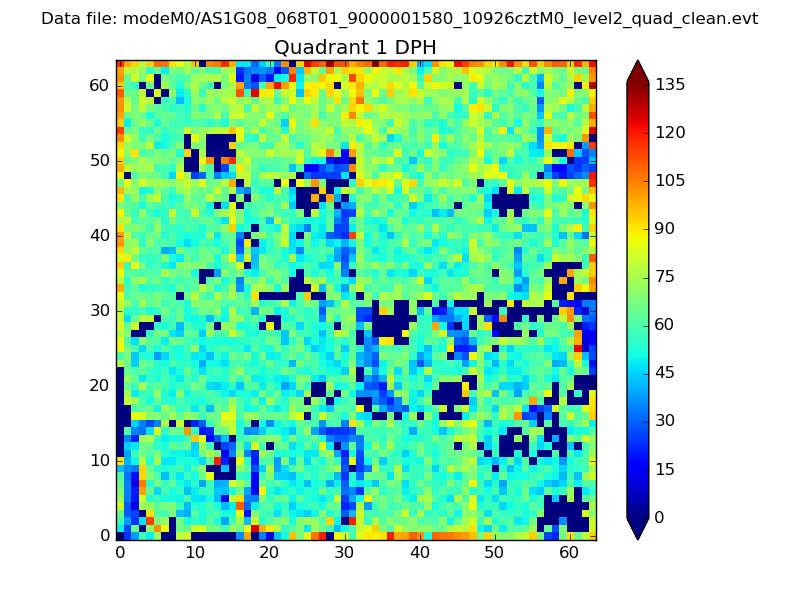 |
Quadrant B |
|---|---|---|---|
| Quadrant D | 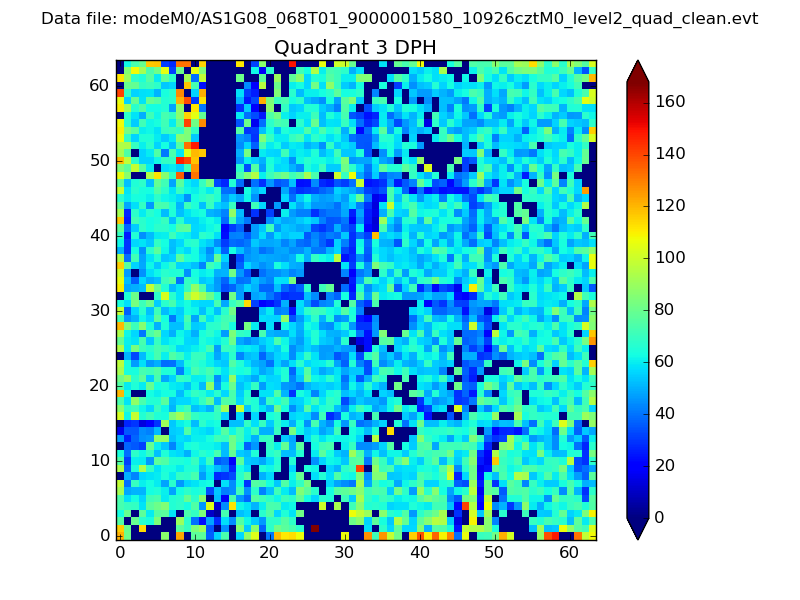 |
 |
Quadrant C |
| Plot type | Count rate plots | Images |
|---|---|---|
| Comparison with Poisson distribution Blue bars denote a histogram of data divided into 1 sec bins. Red curve is a Poisson curve with rate = median count rate of data. |
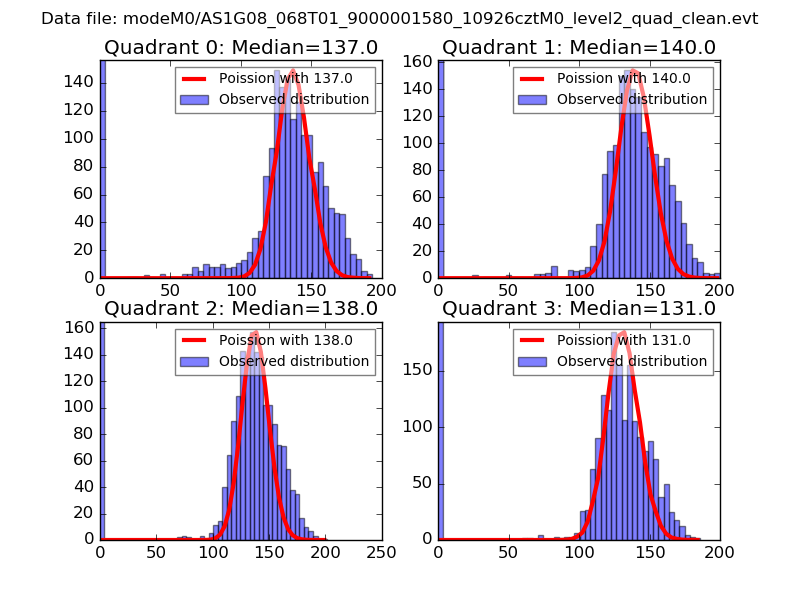 |
 |
| Quadrant-wise count rates Data is divided into 100 sec bins |
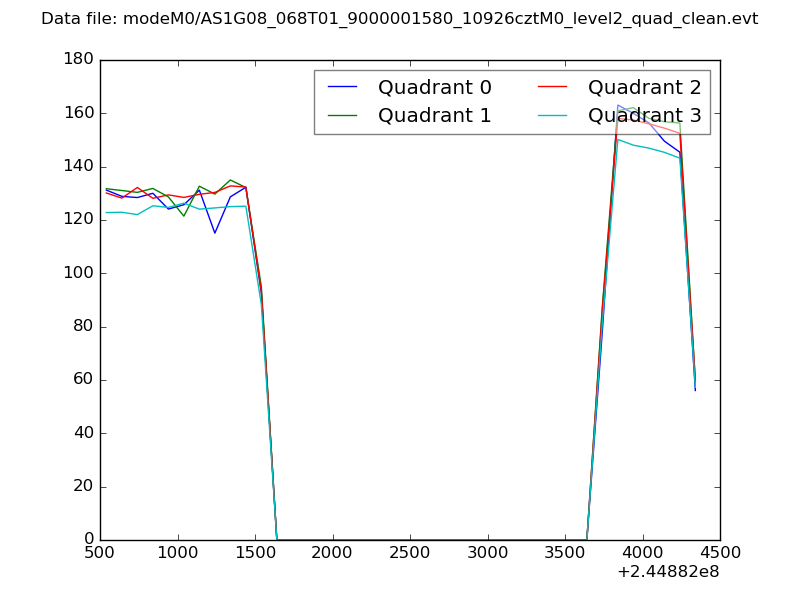 |
|
| Module-wise count rates for Quadrant A Data is divided into 100 sec bins |
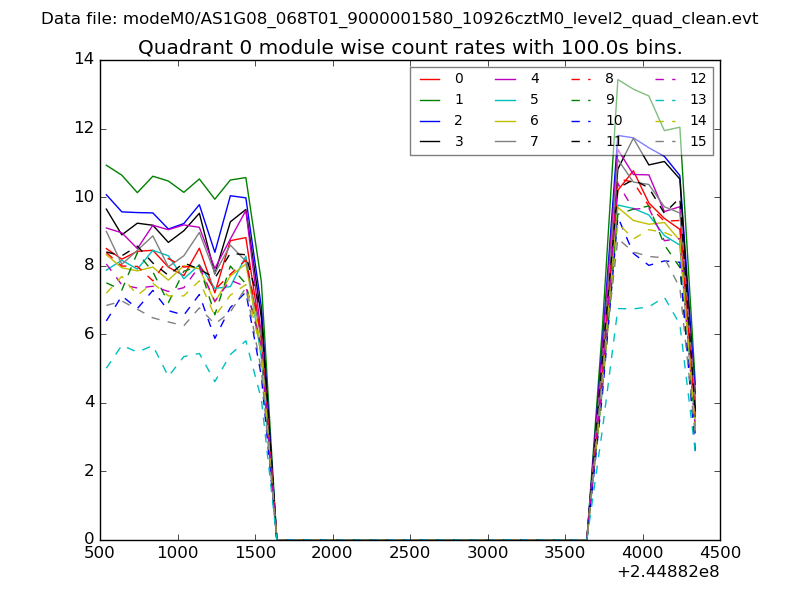 |
 |
| Module-wise count rates for Quadrant B Data is divided into 100 sec bins |
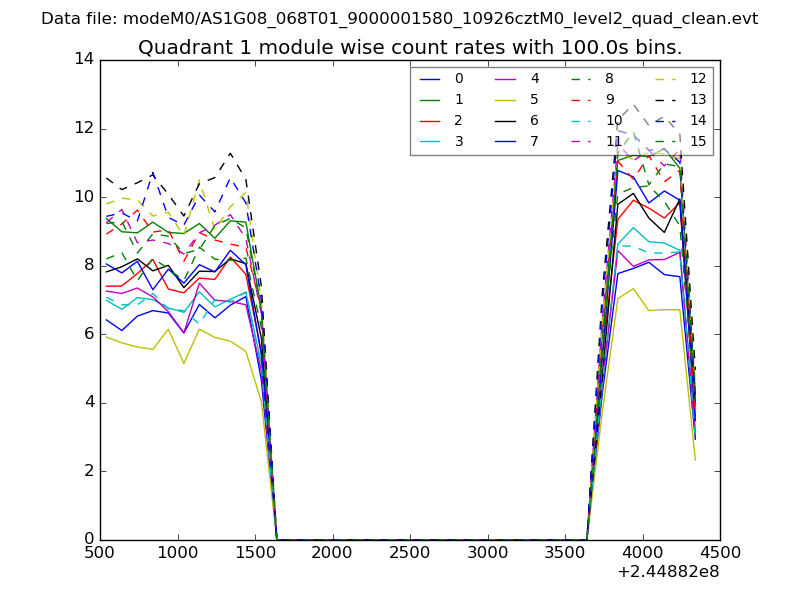 |
 |
| Module-wise count rates for Quadrant C Data is divided into 100 sec bins |
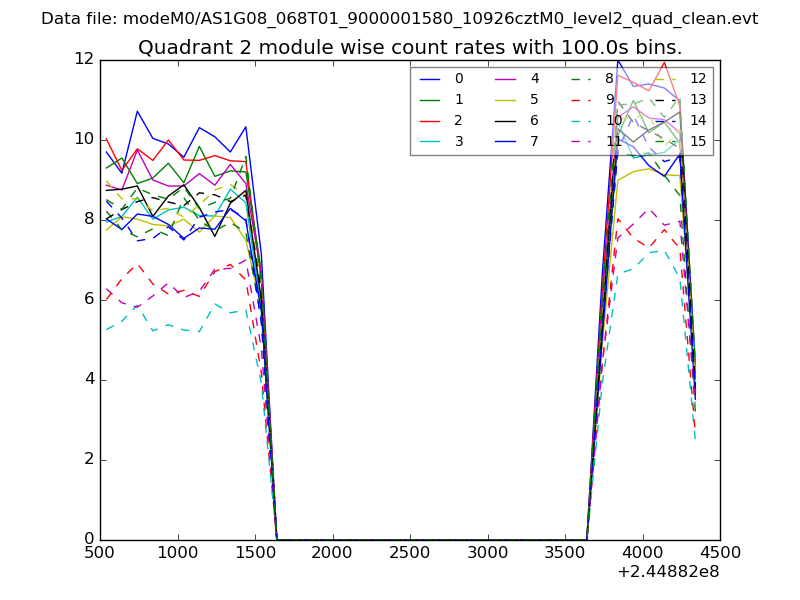 |
 |
| Module-wise count rates for Quadrant D Data is divided into 100 sec bins |
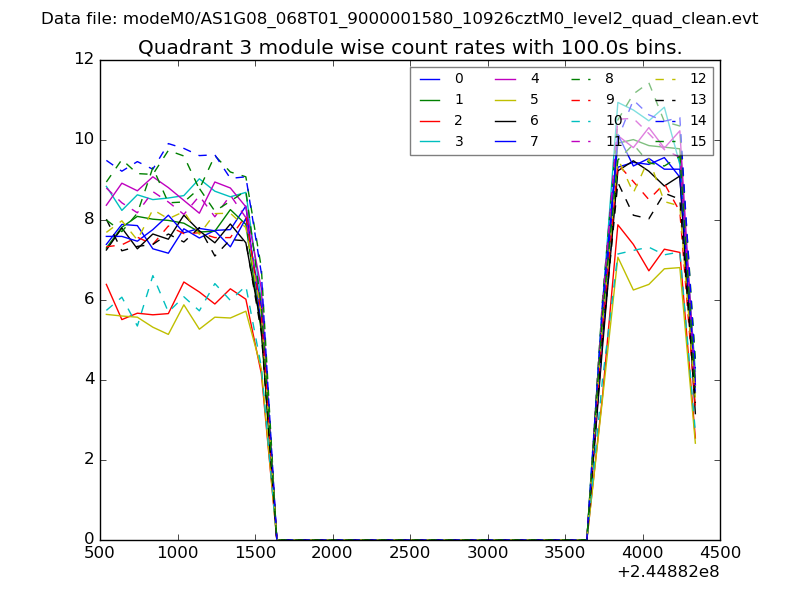 |
 |
| Parameter | Plot |
|---|---|
| CZT HV Monitor | 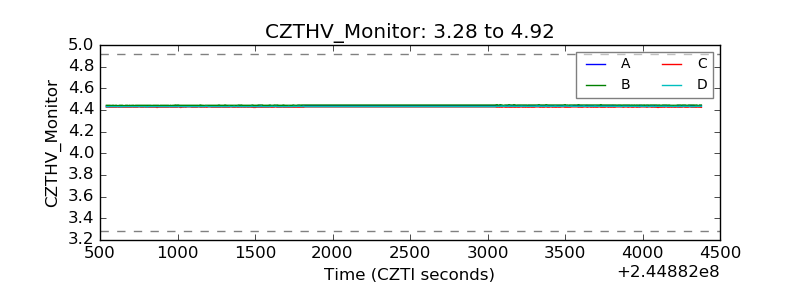 |
| D_VDD | 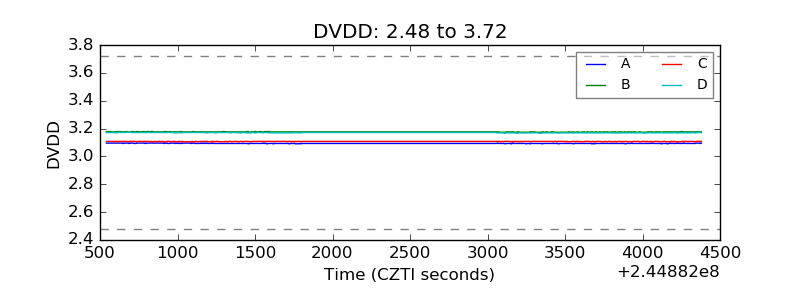 |
| Temperature 1 | 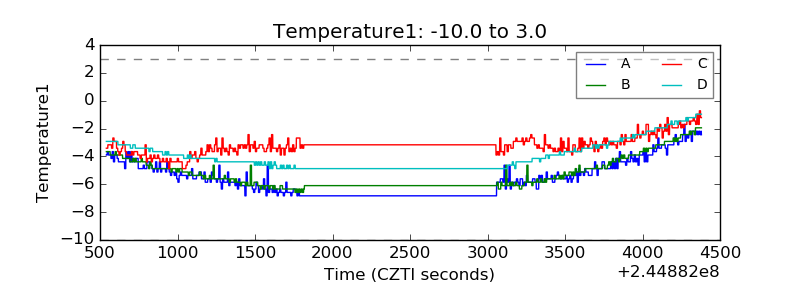 |
| Veto HV Monitor | 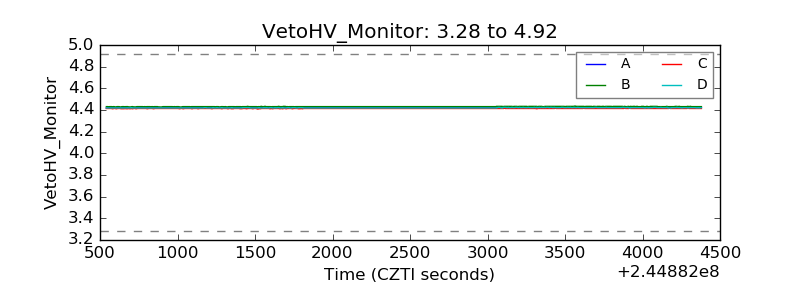 |
| Veto LLD | 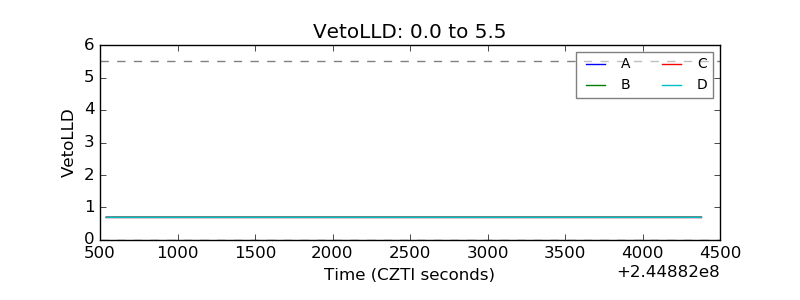 |
| Alpha Counter | 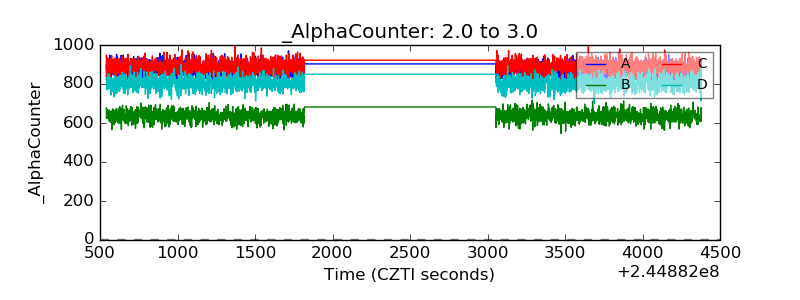 |
| _CPM_Rate | 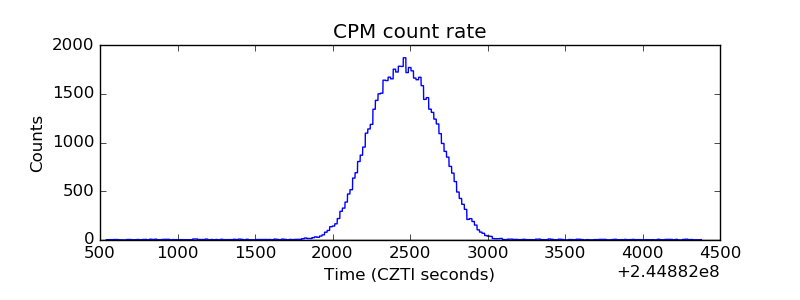 |
| CZT Counter |  |
| +2.5 Volts monitor |  |
| +5 Volts monitor | 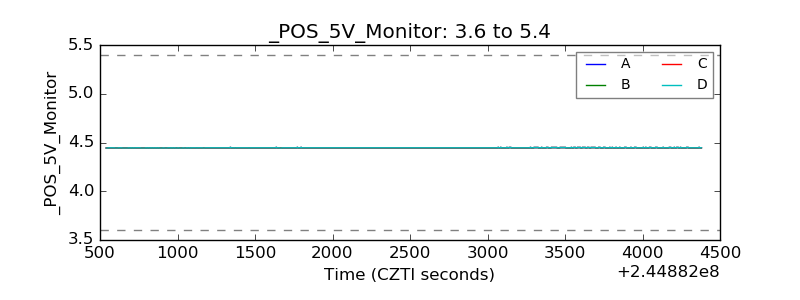 |
| _ROLL_ROT | 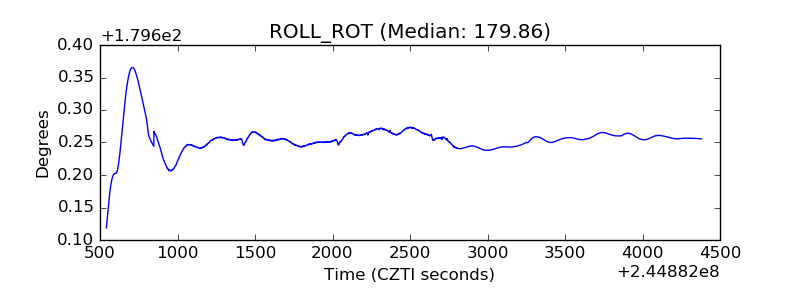 |
| _Roll_DEC | 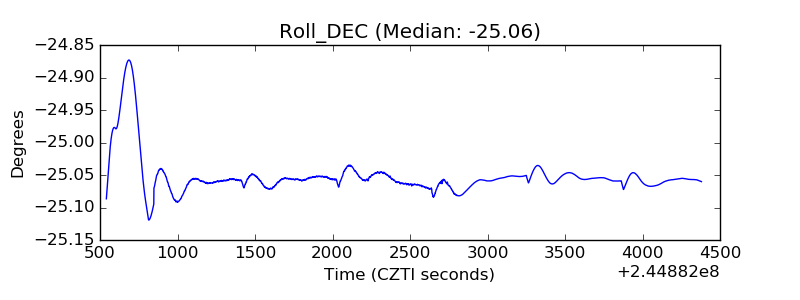 |
| _Roll_RA | 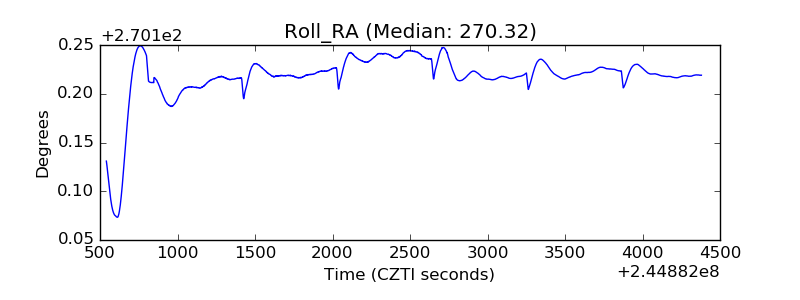 |
| Veto Counter | 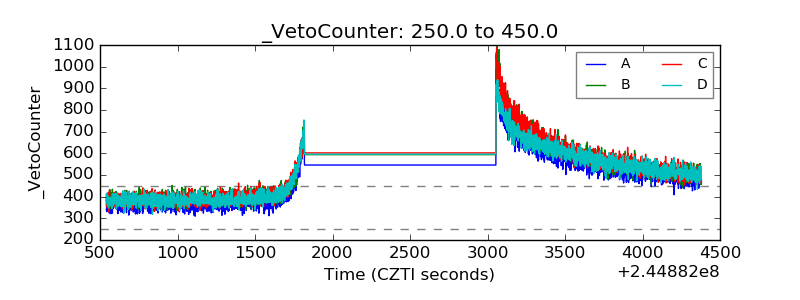 |