| Param | Original file | Final file |
|---|---|---|
| Filename | modeM0/AS1G08_068T01_9000001580_10927cztM0_level2.evt | modeM0/AS1G08_068T01_9000001580_10927cztM0_level2_quad_clean.evt |
| Size (bytes) | 502,470,720 | 100,863,360 |
| Size | 479.2 MB | 96.2 MB |
| Events in quadrant A | 4,308,436 | 662,449 |
| Events in quadrant B | 4,039,563 | 672,055 |
| Events in quadrant C | 3,045,496 | 664,052 |
| Events in quadrant D | 3,411,379 | 631,435 |
| Mode M0 | |||
|---|---|---|---|
| Quadrant | BADHDUFLAG | Total packets | Discarded packets |
| A | 0 | 17012 | 68 |
| B | 0 | 16032 | 37 |
| C | 0 | 12926 | 28 |
| D | 0 | 13869 | 14 |
| Mode SS | |||
|---|---|---|---|
| Quadrant | BADHDUFLAG | Total packets | Discarded packets |
| A | 0 | 124 | 0 |
| B | 0 | 124 | 0 |
| C | 0 | 124 | 0 |
| D | 0 | 124 | 0 |
| Mode M9 | |||
|---|---|---|---|
| Quadrant | BADHDUFLAG | Total packets | Discarded packets |
| A | 0 | 13 | 0 |
| B | 0 | 13 | 0 |
| C | 0 | 13 | 0 |
| D | 0 | 13 | 0 |
| Quadrant | Total seconds | Saturated seconds | Saturation percentage |
|---|---|---|---|
| A | 6077 | 314 | 5.167023% |
| B | 6079 | 269 | 4.425070% |
| C | 6079 | 33 | 0.542852% |
| D | 6086 | 82 | 1.347355% |
Noise dominated data is calculated using 1-second bins in cleaned event files. If a bin has >2000 counts, and if more than 50% of those come from <1% of pixels, then it is considered to be noise-dominated and hence unusable.
| Quadrant | # 1 sec bins | Bins with >0 counts | Bins with >2000 counts | High rate bins dominated by noise | Noise dominated (total time) | Noise dominated (detector-on time) | Marked lightcurve |
|---|---|---|---|---|---|---|---|
| A | 7387 | 6091 | 174 | 174 | 2.36% | 2.86% | 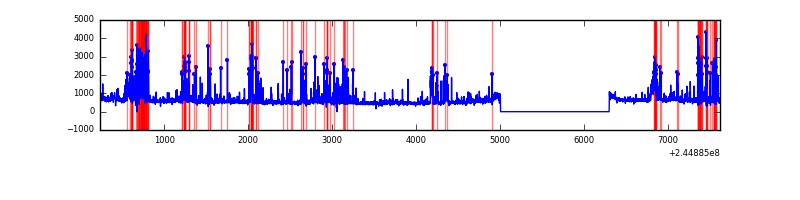 |
| B | 7387 | 6093 | 111 | 111 | 1.50% | 1.82% | 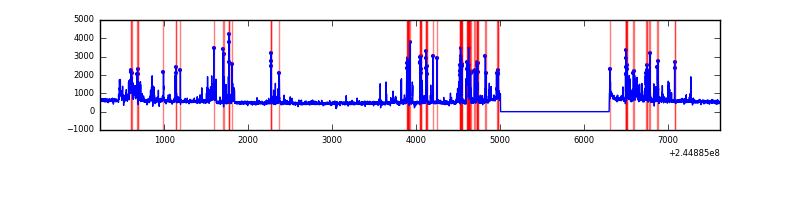 |
| C | 7387 | 6093 | 0 | 0 | 0.00% | 0.00% | 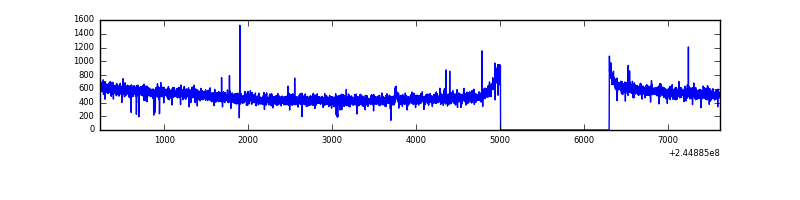 |
| D | 7387 | 6093 | 22 | 22 | 0.30% | 0.36% | 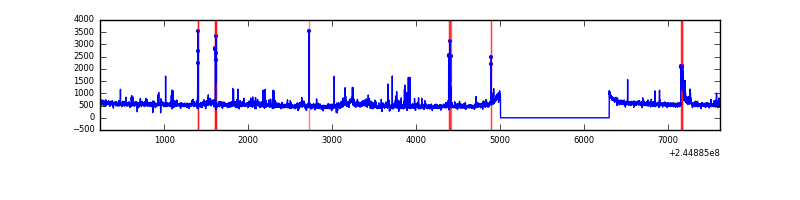 |
Top three noisy pixels from each quadrant. If the there are fewer than three noisy pixels in the level2.evt file, extra rows are filled as -1
| Pixel properties | Quadrant properties | ||||||
|---|---|---|---|---|---|---|---|
| Quadrant | DetID | PixID | Counts | Sigma | Mean | Median | Sigma |
| A | 8 | 5 | 895035 | 5611.49 | 801 | 788 | 159.4 |
| A | 15 | 223 | 213655 | 1335.76 | 801 | 788 | 159.4 |
| A | 15 | 239 | 58260 | 360.64 | 801 | 788 | 159.4 |
| B | 4 | 239 | 851461 | 5719.73 | 797 | 782 | 148.7 |
| B | 0 | 214 | 23929 | 155.63 | 797 | 782 | 148.7 |
| B | 11 | 51 | 23673 | 153.91 | 797 | 782 | 148.7 |
| C | 13 | 61 | 5849 | 28.62 | 777 | 784 | 177.0 |
| C | 12 | 4 | 5431 | 26.26 | 777 | 784 | 177.0 |
| C | 4 | 222 | 4067 | 18.55 | 777 | 784 | 177.0 |
| D | 8 | 195 | 126350 | 678.26 | 781 | 762 | 185.2 |
| D | 13 | 152 | 67135 | 358.46 | 781 | 762 | 185.2 |
| D | 13 | 104 | 55339 | 294.75 | 781 | 762 | 185.2 |
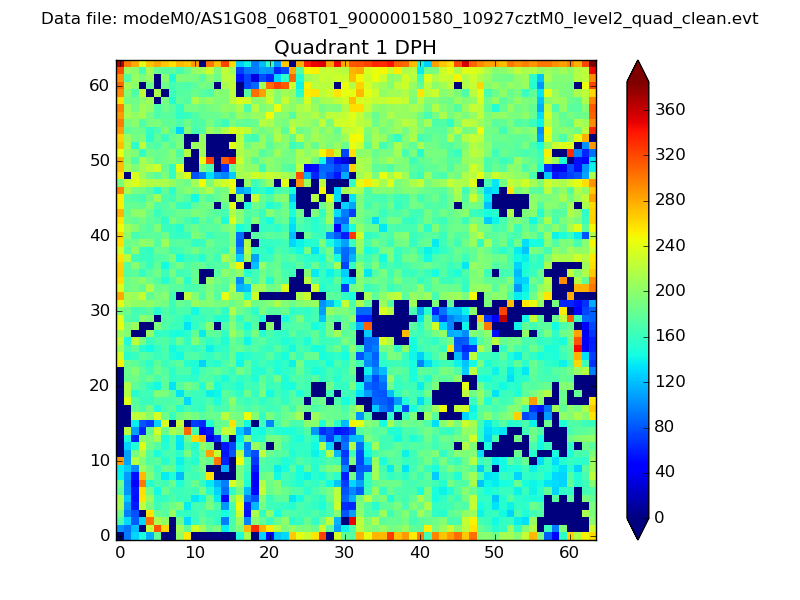
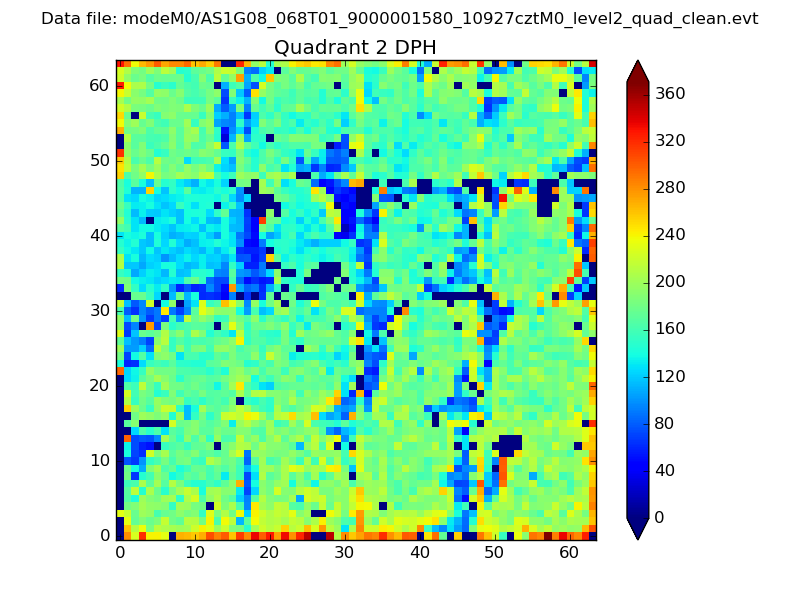
Histogram calculated using DETX and DETY for each event in the final _common_clean file
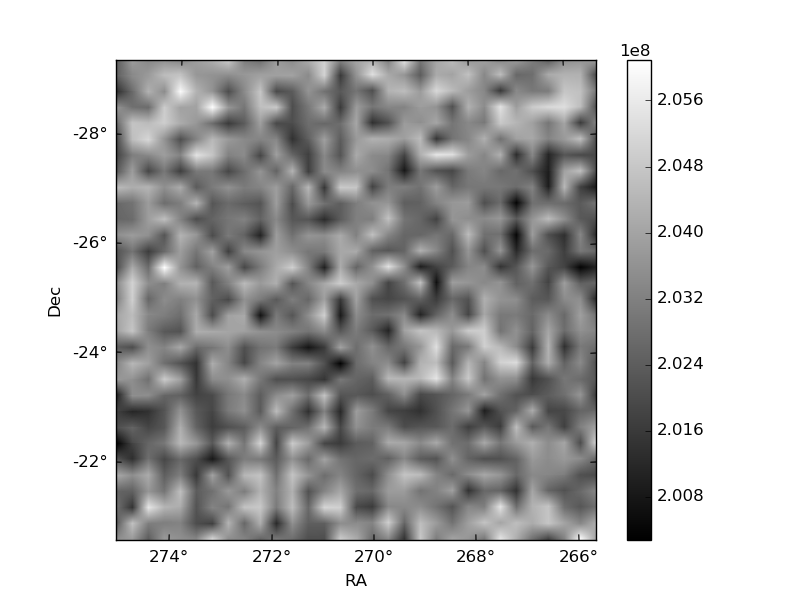
| Quadrant A |  |
 |
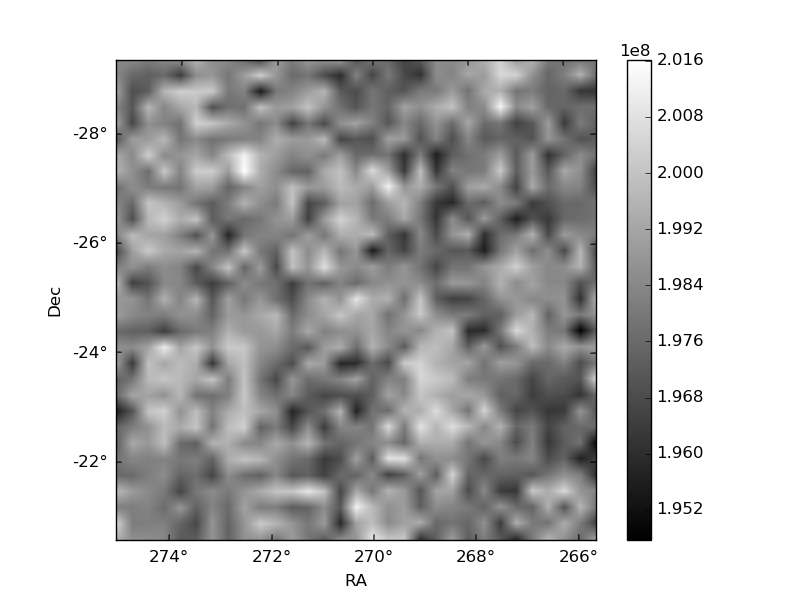
Quadrant B |
|---|---|---|---|
| Quadrant D |  |
 |
Quadrant C |
| Plot type | Count rate plots | Images |
|---|---|---|
| Comparison with Poisson distribution Blue bars denote a histogram of data divided into 1 sec bins. Red curve is a Poisson curve with rate = median count rate of data. |
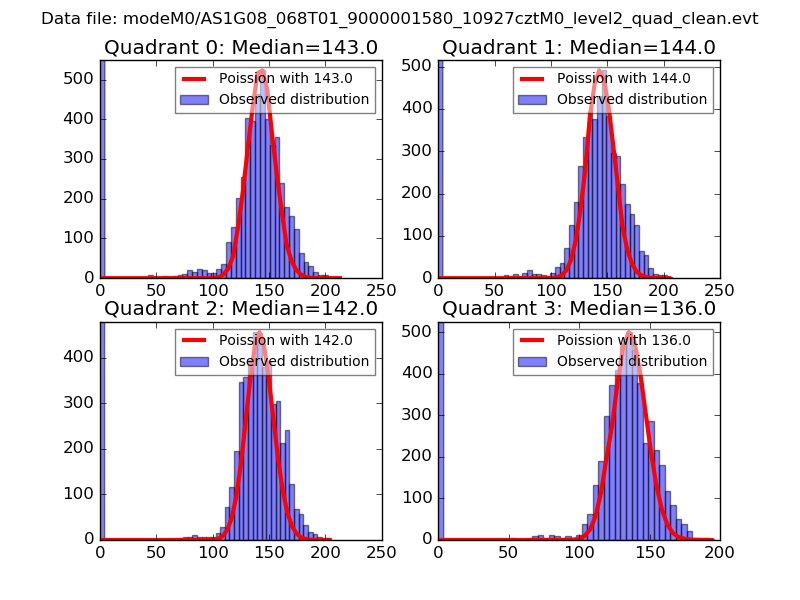 |
 |
| Quadrant-wise count rates Data is divided into 100 sec bins |
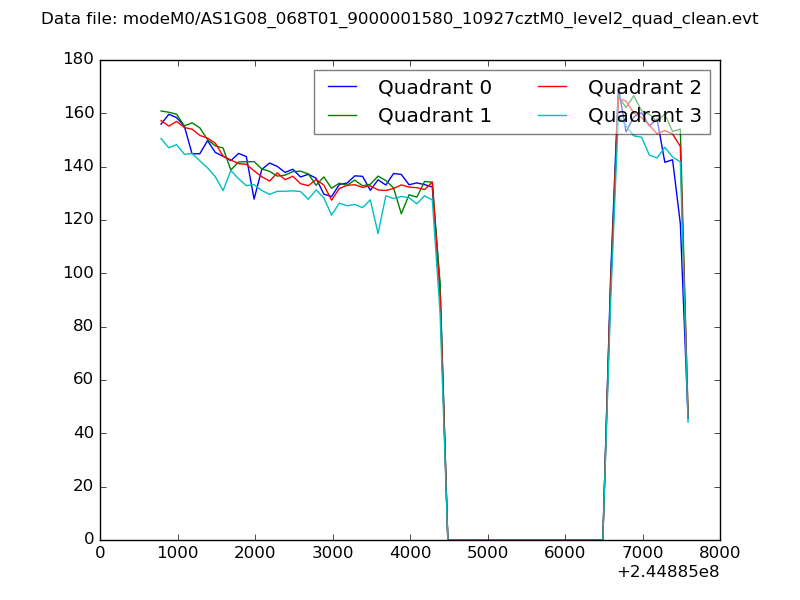 |
|
| Module-wise count rates for Quadrant A Data is divided into 100 sec bins |
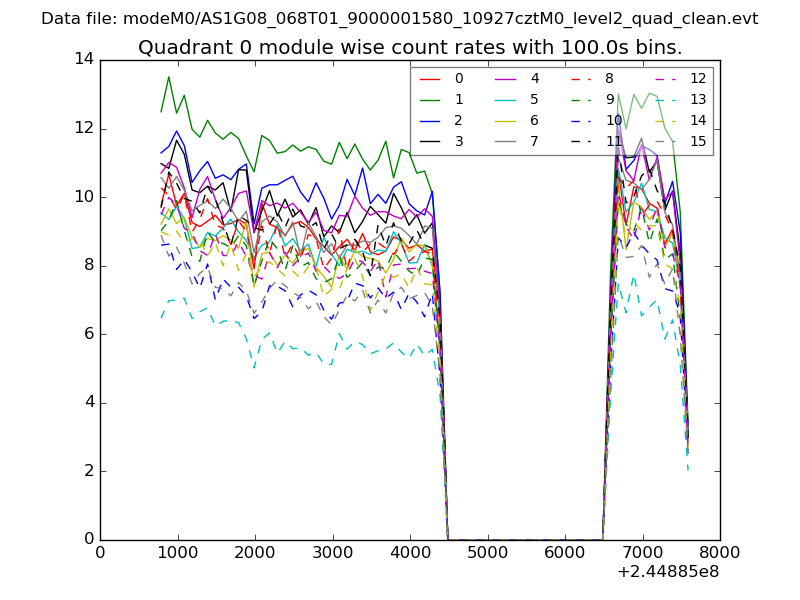 |
 |
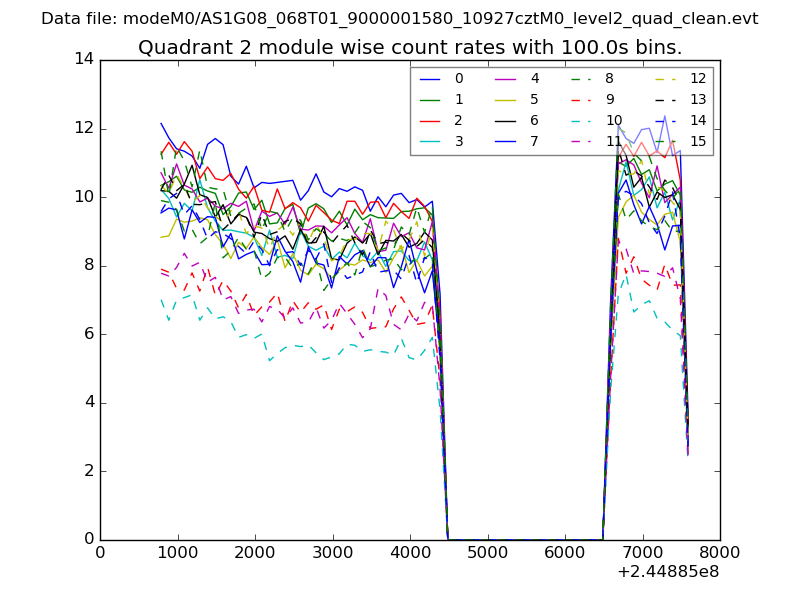
| Module-wise count rates for Quadrant B Data is divided into 100 sec bins |
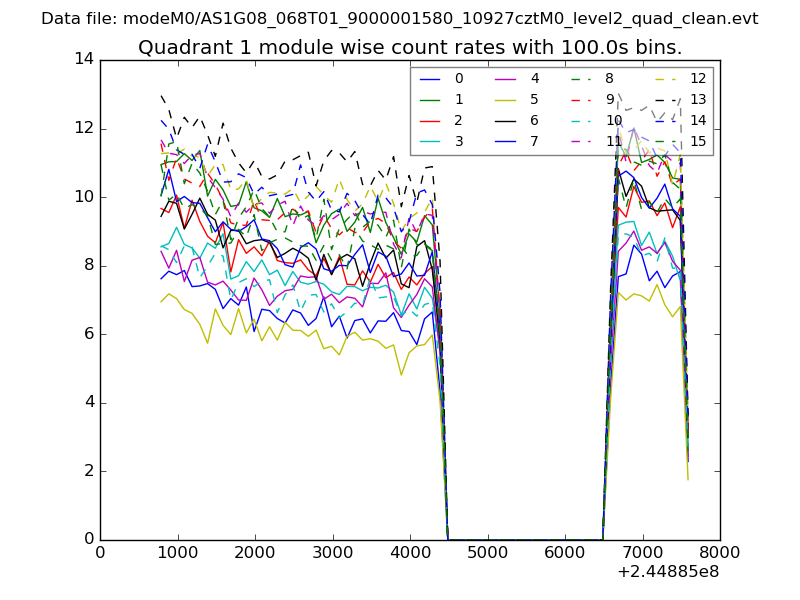 |
 |
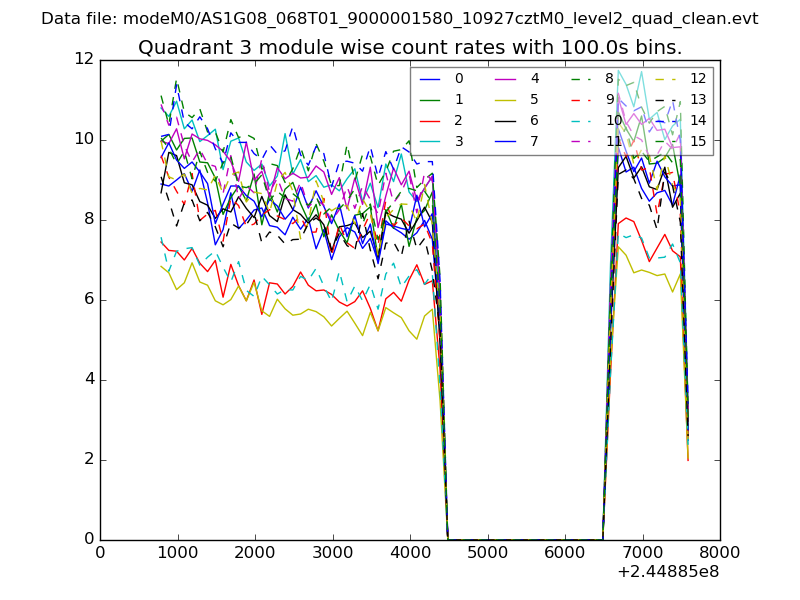
| Module-wise count rates for Quadrant C Data is divided into 100 sec bins |
 |
 |
| Module-wise count rates for Quadrant D Data is divided into 100 sec bins |
 |
 |
| Parameter | Plot |
|---|---|
| CZT HV Monitor | 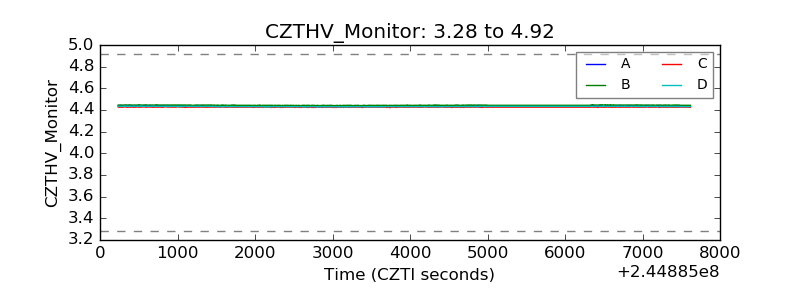 |
| D_VDD | 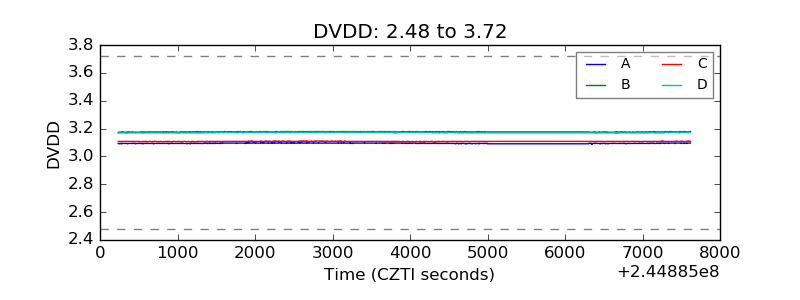 |
| Temperature 1 | 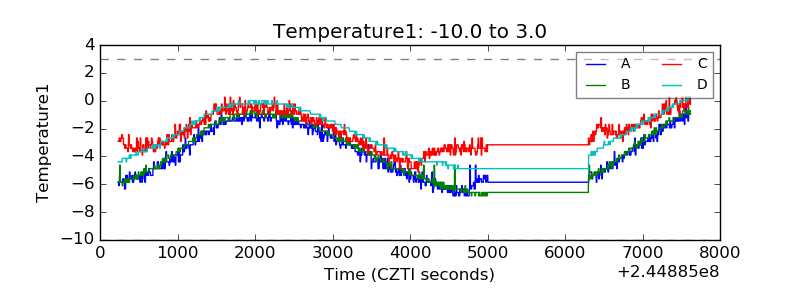 |
| Veto HV Monitor | 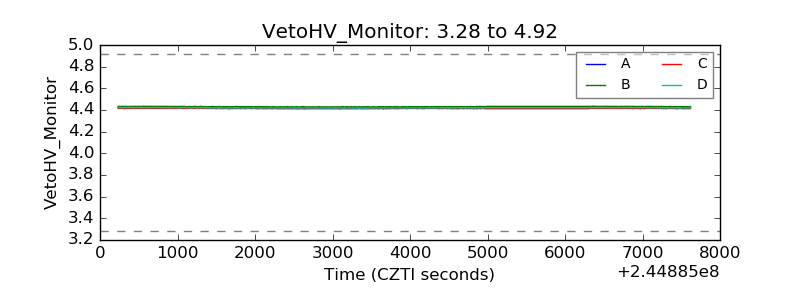 |
| Veto LLD | 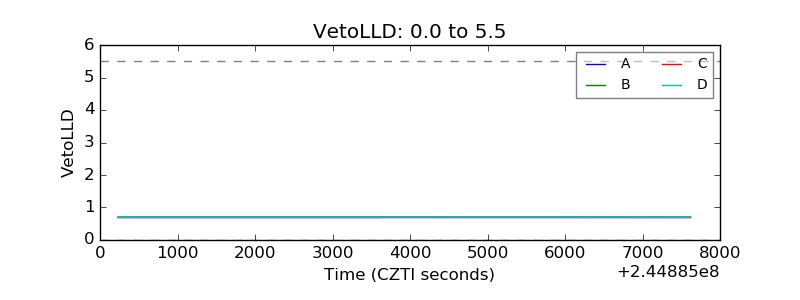 |
| Alpha Counter | 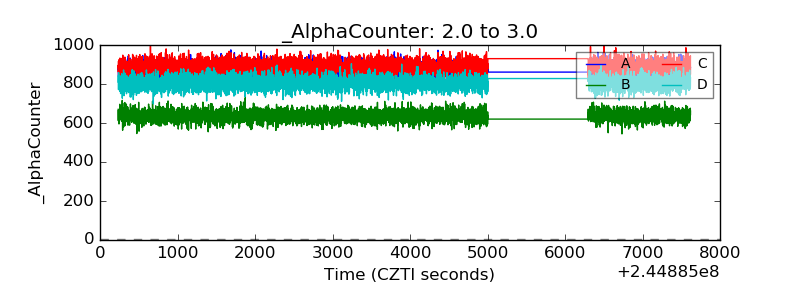 |
| _CPM_Rate | 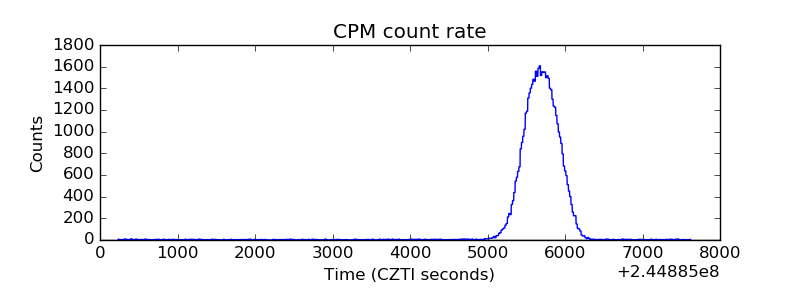 |
| CZT Counter |  |
| +2.5 Volts monitor |  |
| +5 Volts monitor | 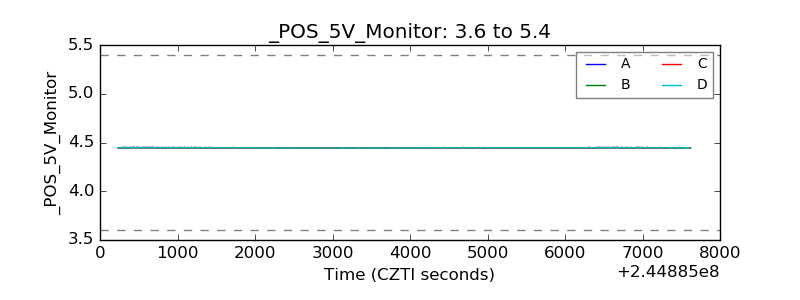 |
| _ROLL_ROT | 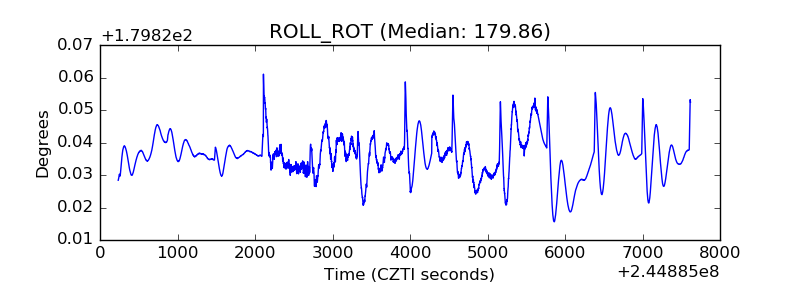 |
| _Roll_DEC | 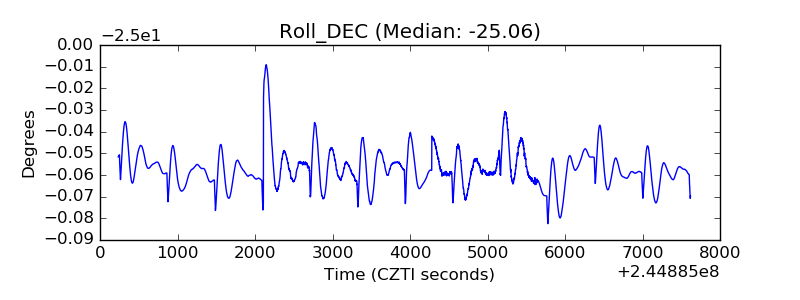 |
| _Roll_RA |  |
| Veto Counter | 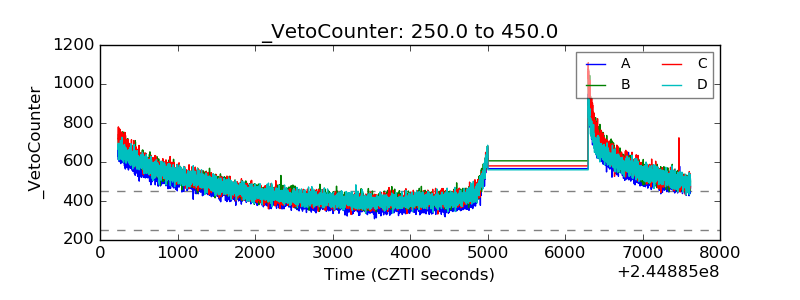 |