| Param | Original file | Final file |
|---|---|---|
| Filename | modeM0/AS1G08_068T01_9000001580_10928cztM0_level2.evt | modeM0/AS1G08_068T01_9000001580_10928cztM0_level2_quad_clean.evt |
| Size (bytes) | 488,753,280 | 97,842,240 |
| Size | 466.1 MB | 93.3 MB |
| Events in quadrant A | 3,999,378 | 645,188 |
| Events in quadrant B | 3,656,989 | 668,787 |
| Events in quadrant C | 2,722,850 | 658,176 |
| Events in quadrant D | 4,039,752 | 596,086 |
| Mode M0 | |||
|---|---|---|---|
| Quadrant | BADHDUFLAG | Total packets | Discarded packets |
| A | 0 | 15765 | 28 |
| B | 0 | 14417 | 14 |
| C | 0 | 11728 | 10 |
| D | 0 | 15659 | 42 |
| Mode SS | |||
|---|---|---|---|
| Quadrant | BADHDUFLAG | Total packets | Discarded packets |
| A | 0 | 116 | 2 |
| B | 0 | 116 | 0 |
| C | 0 | 116 | 0 |
| D | 0 | 116 | 0 |
| Mode M9 | |||
|---|---|---|---|
| Quadrant | BADHDUFLAG | Total packets | Discarded packets |
| A | 0 | 13 | 0 |
| B | 0 | 13 | 0 |
| C | 0 | 13 | 0 |
| D | 0 | 13 | 0 |
| Quadrant | Total seconds | Saturated seconds | Saturation percentage |
|---|---|---|---|
| A | 5639 | 415 | 7.359461% |
| B | 5642 | 273 | 4.838710% |
| C | 5644 | 63 | 1.116230% |
| D | 5638 | 405 | 7.183398% |
Noise dominated data is calculated using 1-second bins in cleaned event files. If a bin has >2000 counts, and if more than 50% of those come from <1% of pixels, then it is considered to be noise-dominated and hence unusable.
| Quadrant | # 1 sec bins | Bins with >0 counts | Bins with >2000 counts | High rate bins dominated by noise | Noise dominated (total time) | Noise dominated (detector-on time) | Marked lightcurve |
|---|---|---|---|---|---|---|---|
| A | 6917 | 5647 | 253 | 253 | 3.66% | 4.48% | 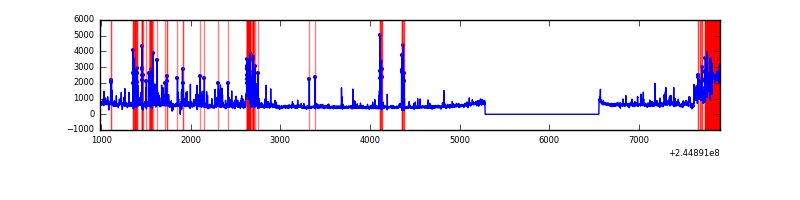 |
| B | 6918 | 5649 | 108 | 108 | 1.56% | 1.91% | 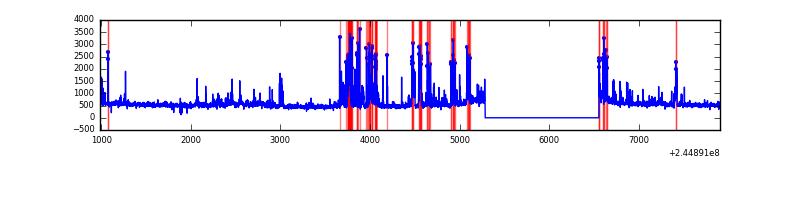 |
| C | 6918 | 5649 | 1 | 1 | 0.01% | 0.02% | 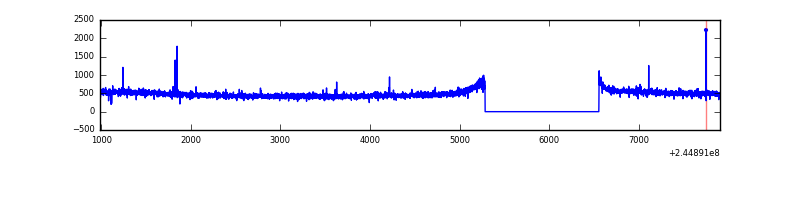 |
| D | 6918 | 5647 | 305 | 305 | 4.41% | 5.40% | 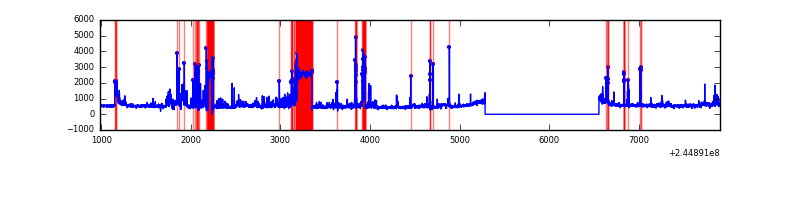 |
Top three noisy pixels from each quadrant. If the there are fewer than three noisy pixels in the level2.evt file, extra rows are filled as -1
| Pixel properties | Quadrant properties | ||||||
|---|---|---|---|---|---|---|---|
| Quadrant | DetID | PixID | Counts | Sigma | Mean | Median | Sigma |
| A | 8 | 5 | 688938 | 4831.4 | 708 | 696 | 142.5 |
| A | 15 | 223 | 294955 | 2065.67 | 708 | 696 | 142.5 |
| A | 15 | 239 | 181557 | 1269.63 | 708 | 696 | 142.5 |
| B | 4 | 239 | 707024 | 5208.4 | 715 | 701 | 135.6 |
| B | 15 | 204 | 74718 | 545.8 | 715 | 701 | 135.6 |
| B | 11 | 51 | 32572 | 235.02 | 715 | 701 | 135.6 |
| C | 14 | 234 | 5862 | 32.31 | 694 | 699 | 159.8 |
| C | 13 | 61 | 5227 | 28.33 | 694 | 699 | 159.8 |
| C | 12 | 4 | 4930 | 26.47 | 694 | 699 | 159.8 |
| D | 13 | 152 | 1009774 | 6177.27 | 677 | 659 | 163.4 |
| D | 8 | 195 | 109914 | 668.8 | 677 | 659 | 163.4 |
| D | 13 | 104 | 76708 | 465.53 | 677 | 659 | 163.4 |
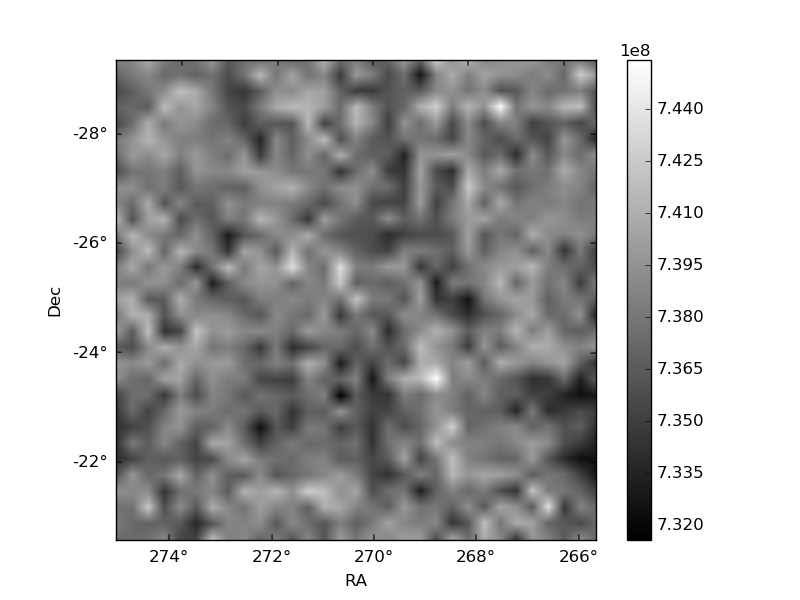
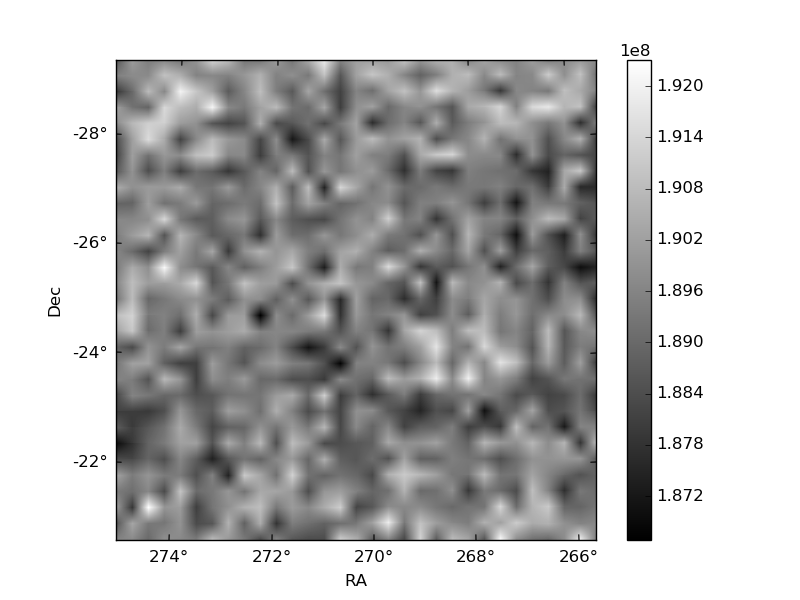
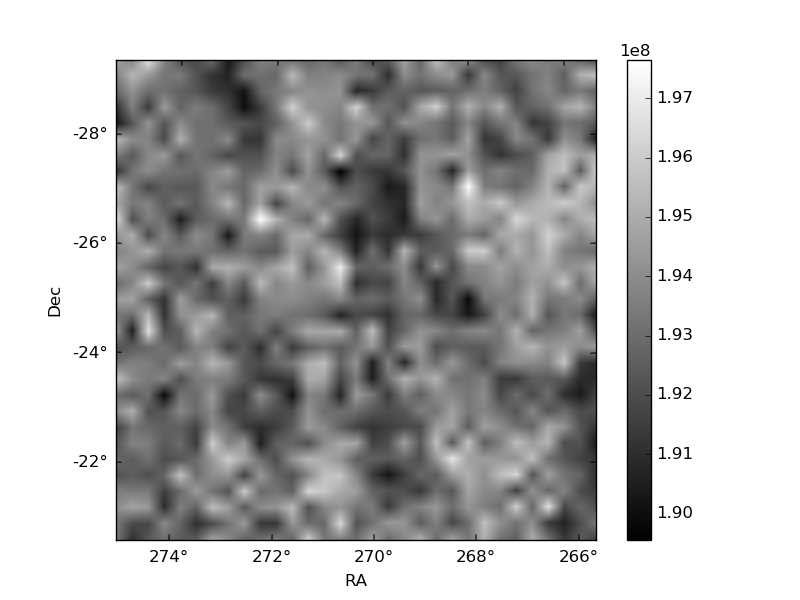
Histogram calculated using DETX and DETY for each event in the final _common_clean file
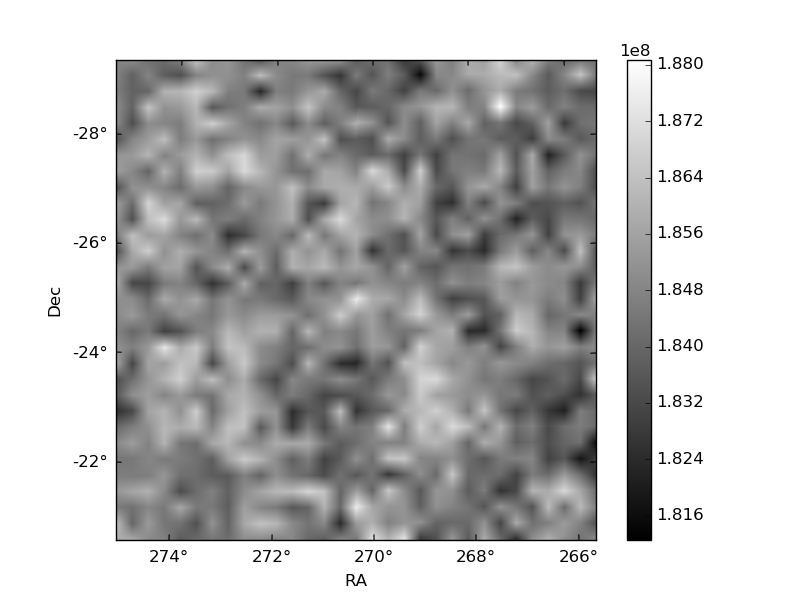
| Quadrant A | 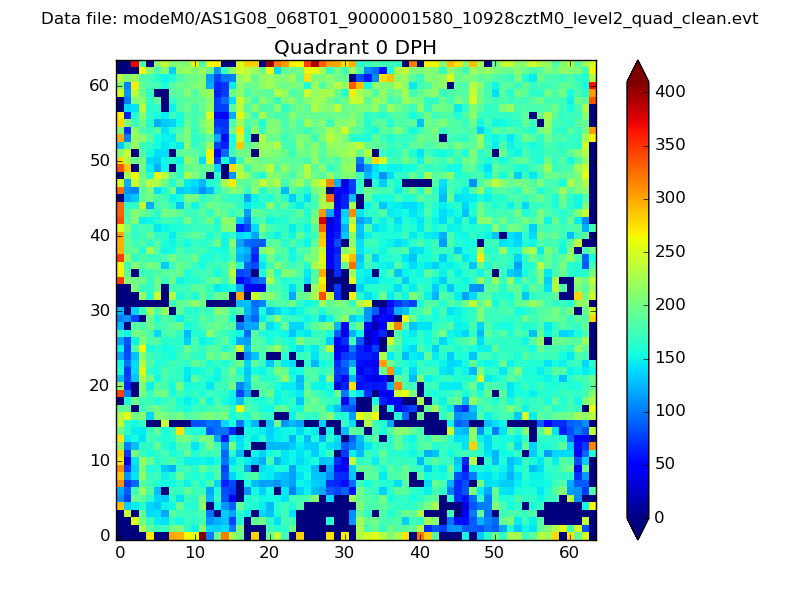 |
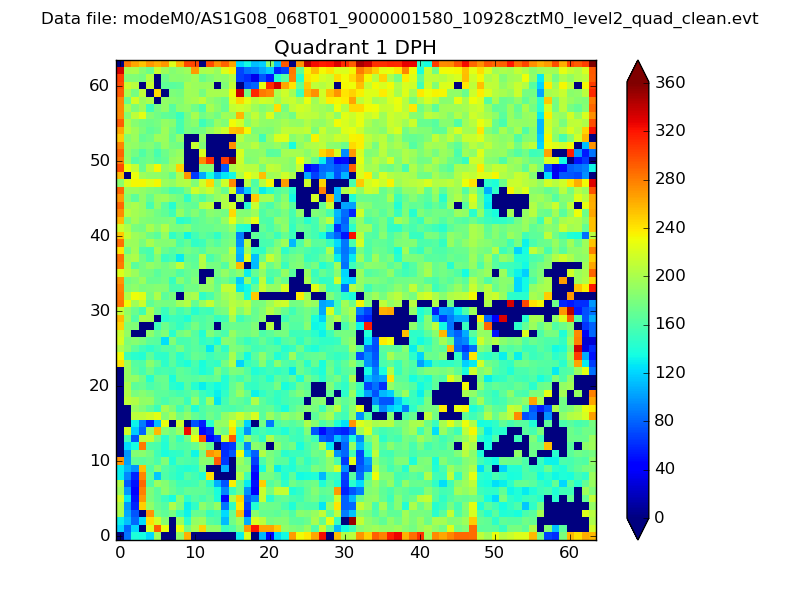 |
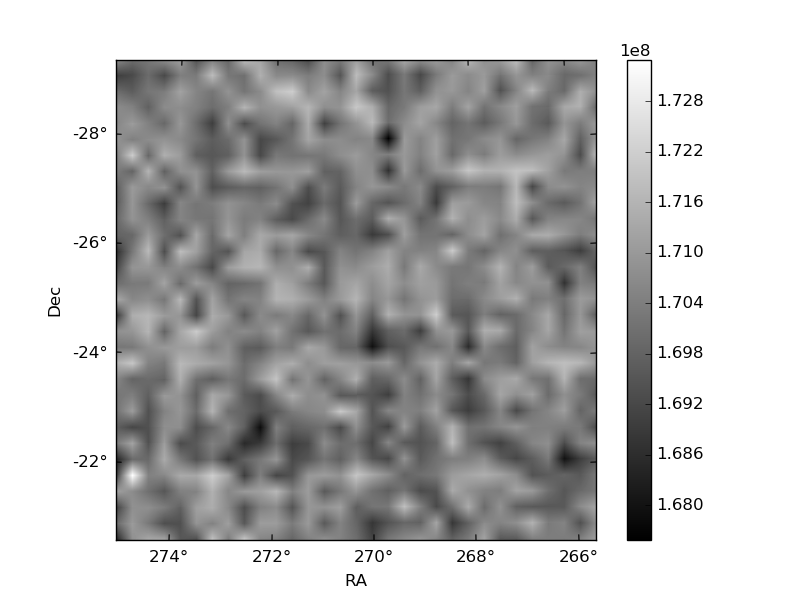
Quadrant B |
|---|---|---|---|
| Quadrant D | 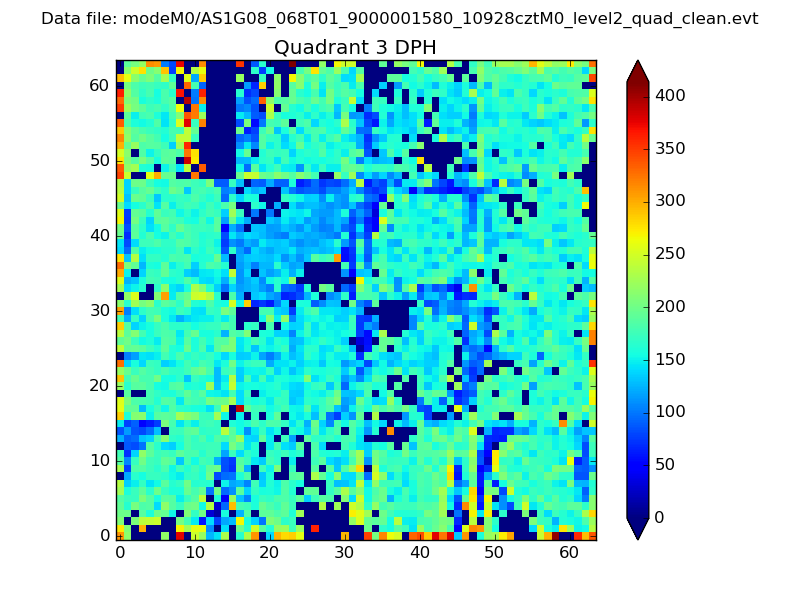 |
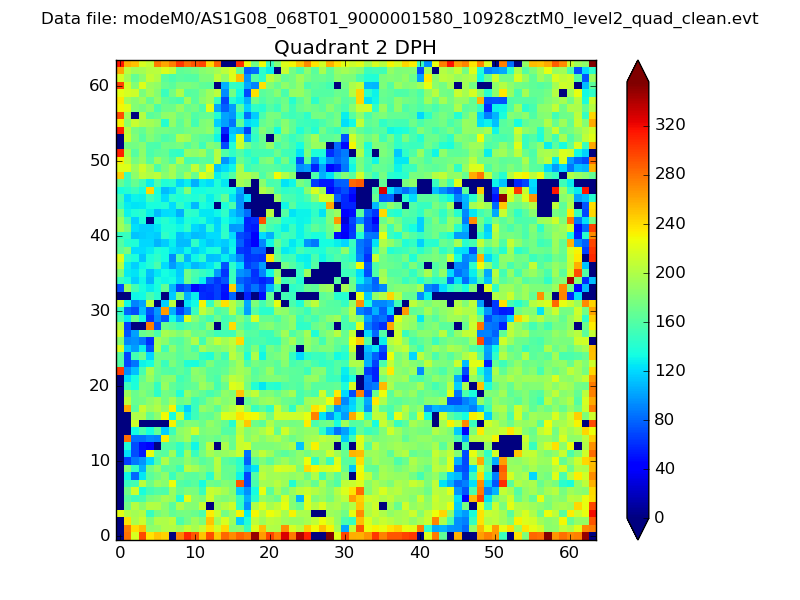 |
Quadrant C |
| Plot type | Count rate plots | Images |
|---|---|---|
| Comparison with Poisson distribution Blue bars denote a histogram of data divided into 1 sec bins. Red curve is a Poisson curve with rate = median count rate of data. |
 |
 |
| Quadrant-wise count rates Data is divided into 100 sec bins |
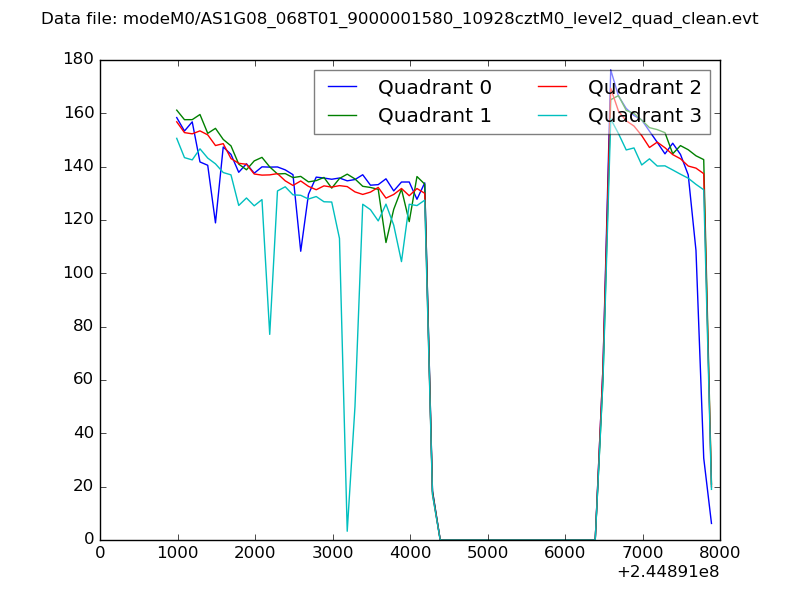 |
|
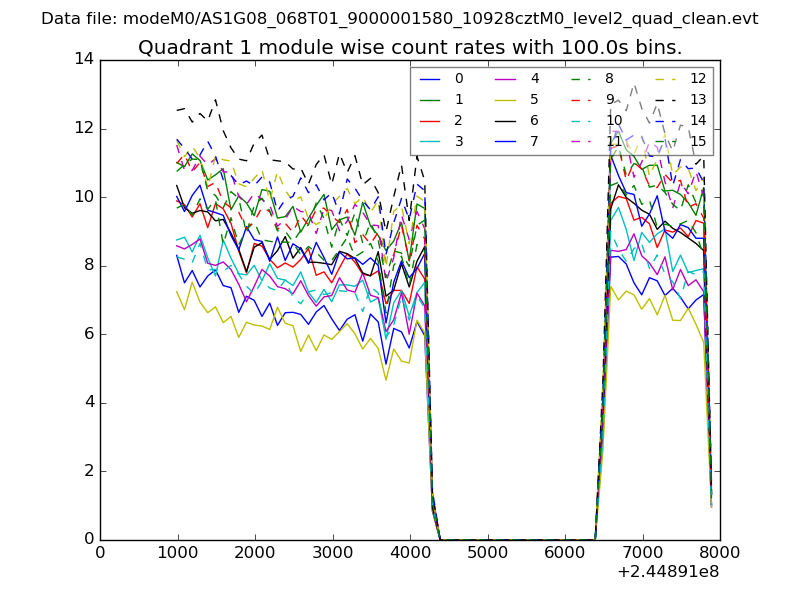
| Module-wise count rates for Quadrant A Data is divided into 100 sec bins |
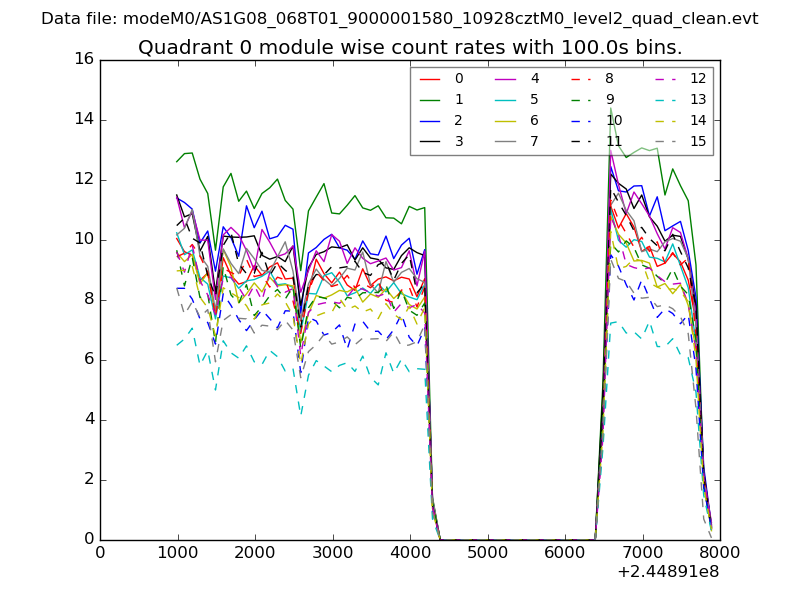 |
 |
| Module-wise count rates for Quadrant B Data is divided into 100 sec bins |
 |
 |
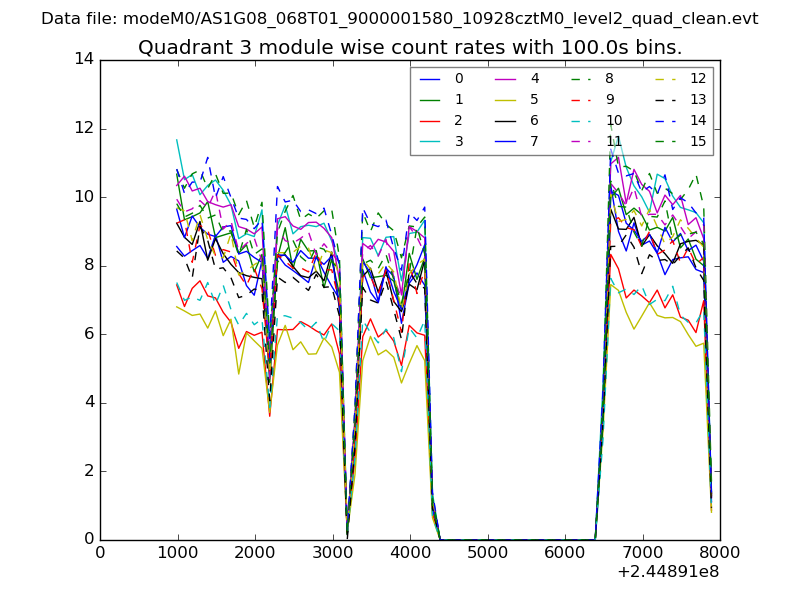
| Module-wise count rates for Quadrant C Data is divided into 100 sec bins |
 |
 |
| Module-wise count rates for Quadrant D Data is divided into 100 sec bins |
 |
 |
| Parameter | Plot |
|---|---|
| CZT HV Monitor | 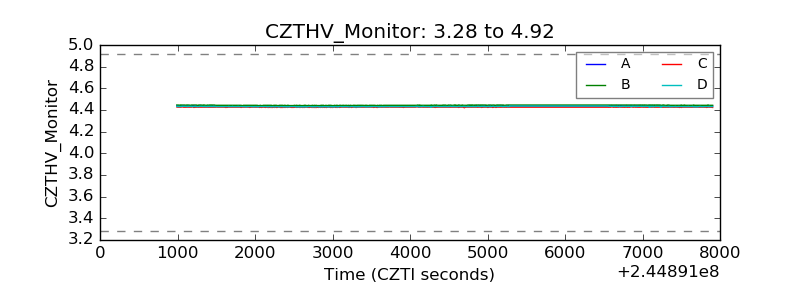 |
| D_VDD | 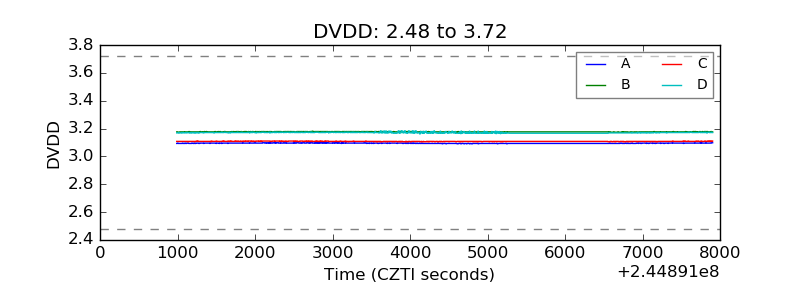 |
| Temperature 1 |  |
| Veto HV Monitor | 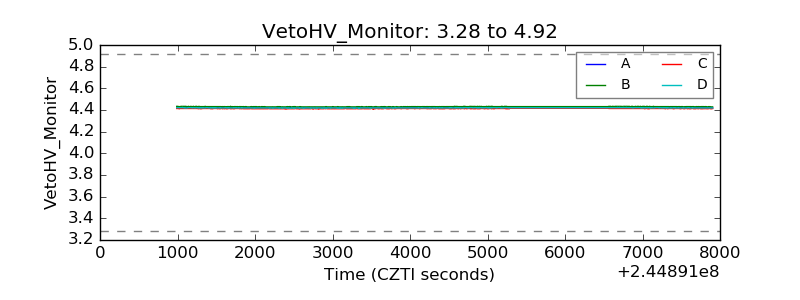 |
| Veto LLD | 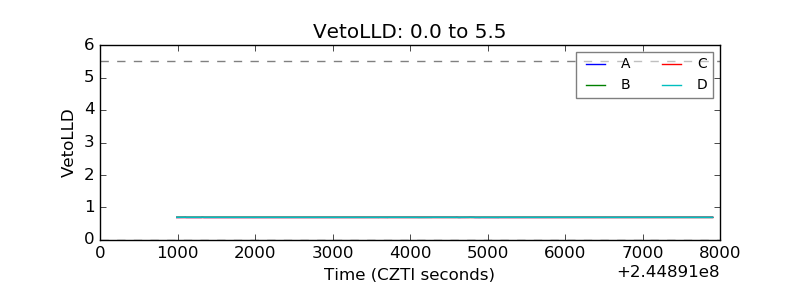 |
| Alpha Counter |  |
| _CPM_Rate | 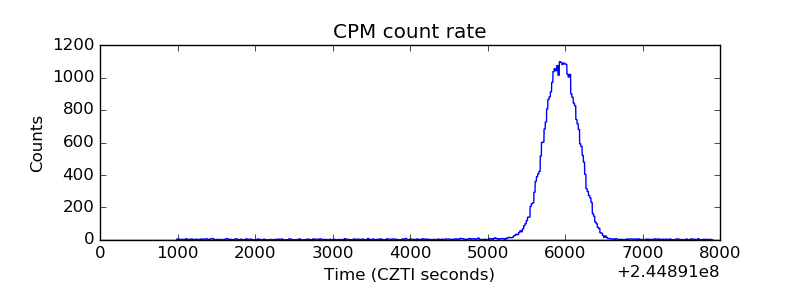 |
| CZT Counter |  |
| +2.5 Volts monitor |  |
| +5 Volts monitor |  |
| _ROLL_ROT | 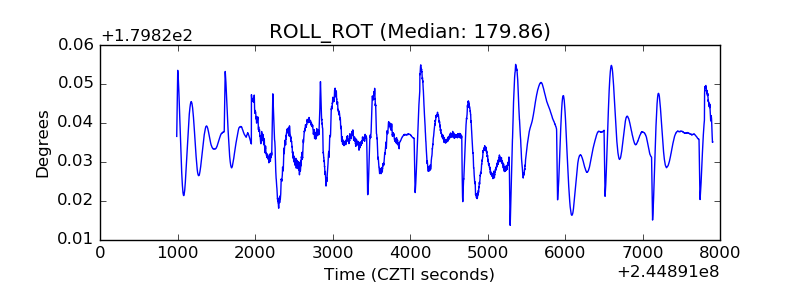 |
| _Roll_DEC | 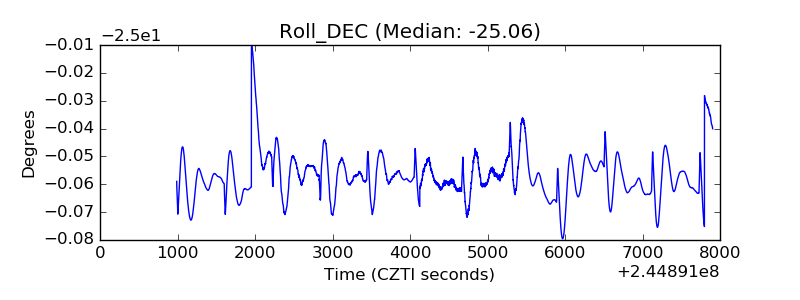 |
| _Roll_RA | 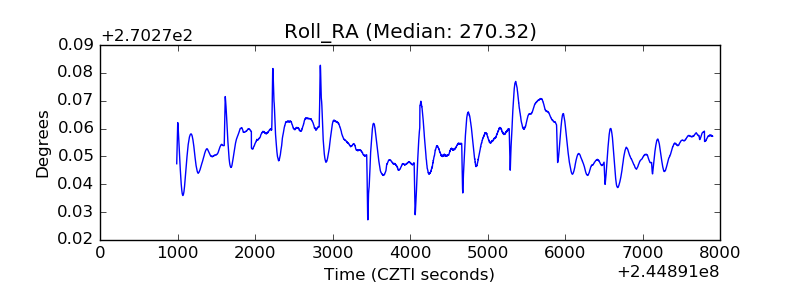 |
| Veto Counter | 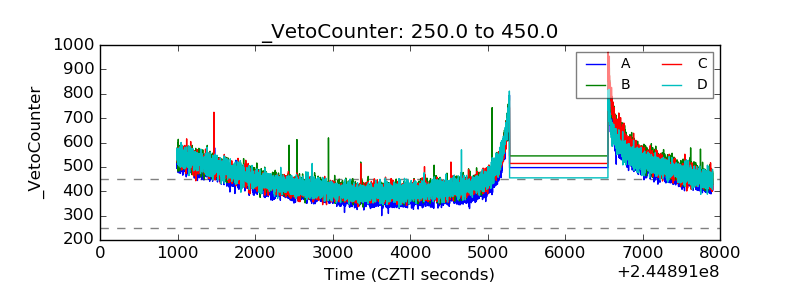 |