| Param | Original file | Final file |
|---|---|---|
| Filename | modeM0/AS1G08_068T01_9000001580_10929cztM0_level2.evt | modeM0/AS1G08_068T01_9000001580_10929cztM0_level2_quad_clean.evt |
| Size (bytes) | 165,939,840 | 34,159,680 |
| Size | 158.3 MB | 32.6 MB |
| Events in quadrant A | 2,185,540 | 197,576 |
| Events in quadrant B | 904,322 | 243,388 |
| Events in quadrant C | 782,311 | 236,672 |
| Events in quadrant D | 1,030,173 | 226,233 |
| Mode M0 | |||
|---|---|---|---|
| Quadrant | BADHDUFLAG | Total packets | Discarded packets |
| A | 0 | 7715 | 0 |
| B | 0 | 3761 | 0 |
| C | 0 | 3560 | 0 |
| D | 0 | 4175 | 0 |
| Mode SS | |||
|---|---|---|---|
| Quadrant | BADHDUFLAG | Total packets | Discarded packets |
| A | 0 | 36 | 0 |
| B | 0 | 36 | 0 |
| C | 0 | 36 | 0 |
| D | 0 | 36 | 0 |
| Quadrant | Total seconds | Saturated seconds | Saturation percentage |
|---|---|---|---|
| A | 1774 | 508 | 28.635851% |
| B | 1774 | 7 | 0.394589% |
| C | 1774 | 1 | 0.056370% |
| D | 1774 | 8 | 0.450958% |
Noise dominated data is calculated using 1-second bins in cleaned event files. If a bin has >2000 counts, and if more than 50% of those come from <1% of pixels, then it is considered to be noise-dominated and hence unusable.
| Quadrant | # 1 sec bins | Bins with >0 counts | Bins with >2000 counts | High rate bins dominated by noise | Noise dominated (total time) | Noise dominated (detector-on time) | Marked lightcurve |
|---|---|---|---|---|---|---|---|
| A | 1774 | 1774 | 448 | 448 | 25.25% | 25.25% | 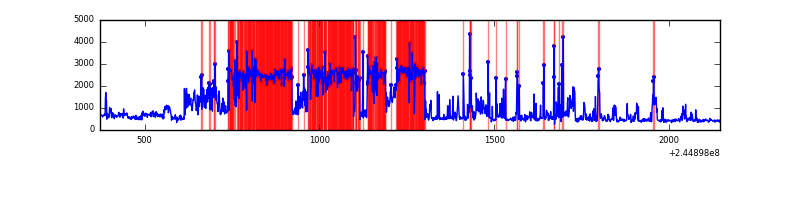 |
| B | 1774 | 1774 | 5 | 5 | 0.28% | 0.28% | 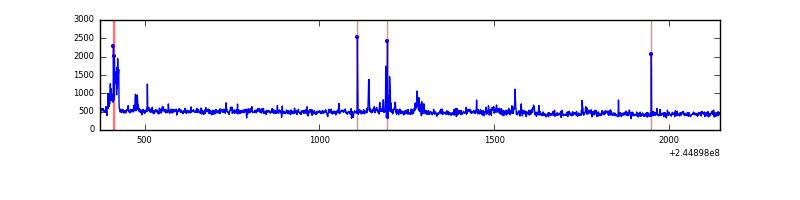 |
| C | 1774 | 1774 | 1 | 1 | 0.06% | 0.06% | 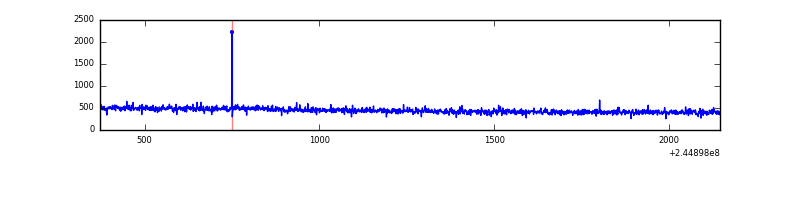 |
| D | 1774 | 1774 | 3 | 3 | 0.17% | 0.17% | 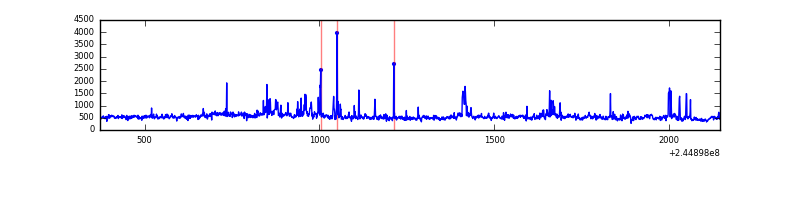 |
Top three noisy pixels from each quadrant. If the there are fewer than three noisy pixels in the level2.evt file, extra rows are filled as -1
| Pixel properties | Quadrant properties | ||||||
|---|---|---|---|---|---|---|---|
| Quadrant | DetID | PixID | Counts | Sigma | Mean | Median | Sigma |
| A | 15 | 223 | 742918 | 19753.85 | 176 | 173 | 37.6 |
| A | 15 | 239 | 378895 | 10072.39 | 176 | 173 | 37.6 |
| A | 8 | 5 | 239247 | 6358.35 | 176 | 173 | 37.6 |
| B | 4 | 239 | 45165 | 1085.36 | 209 | 206 | 41.4 |
| B | 15 | 204 | 30747 | 737.3 | 209 | 206 | 41.4 |
| B | 0 | 245 | 4361 | 100.31 | 209 | 206 | 41.4 |
| C | 7 | 205 | 3257 | 64.52 | 199 | 200 | 47.4 |
| C | 14 | 234 | 2143 | 41.01 | 199 | 200 | 47.4 |
| C | 13 | 61 | 1544 | 28.37 | 199 | 200 | 47.4 |
| D | 8 | 195 | 123985 | 2471.33 | 202 | 197 | 50.1 |
| D | 13 | 104 | 55417 | 1102.42 | 202 | 197 | 50.1 |
| D | 1 | 52 | 29201 | 579.04 | 202 | 197 | 50.1 |
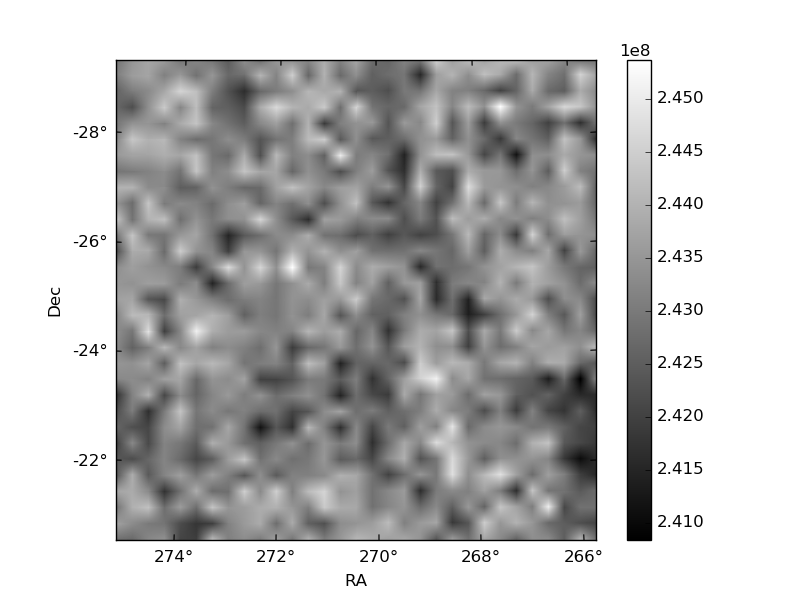
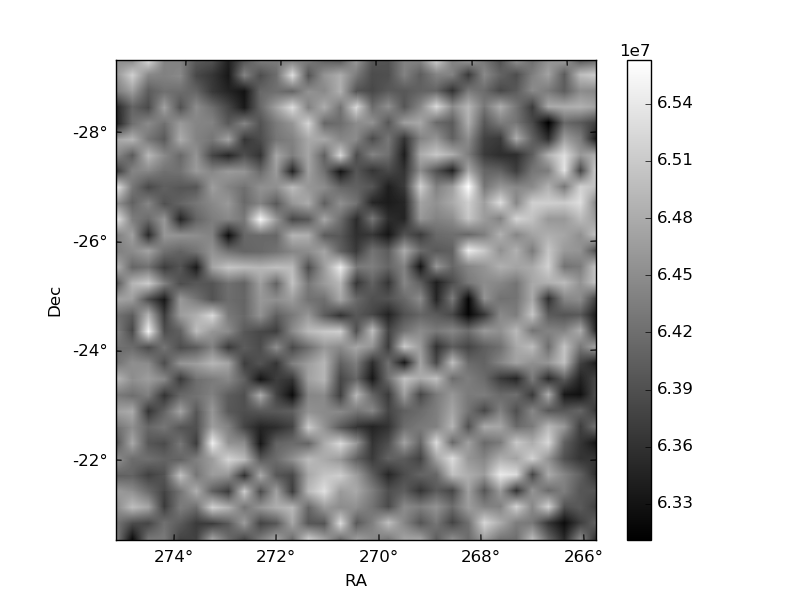
Histogram calculated using DETX and DETY for each event in the final _common_clean file
| Quadrant A | 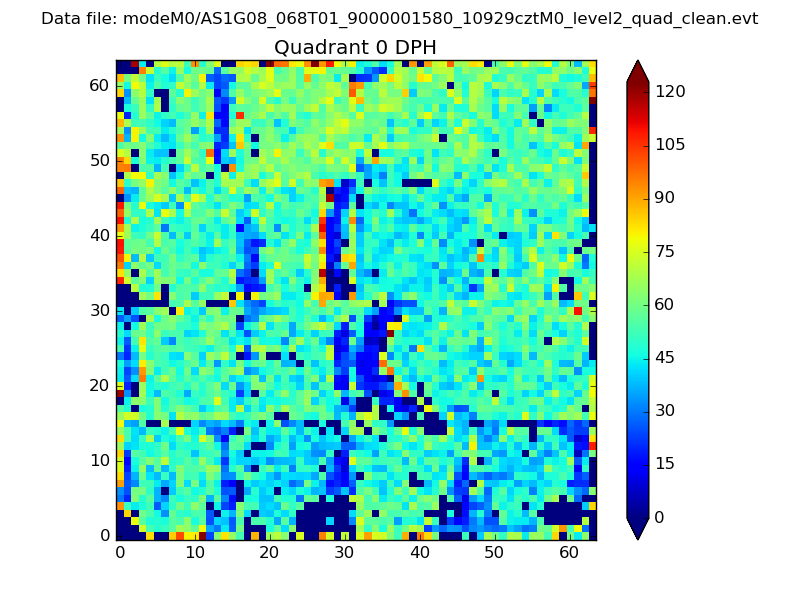 |
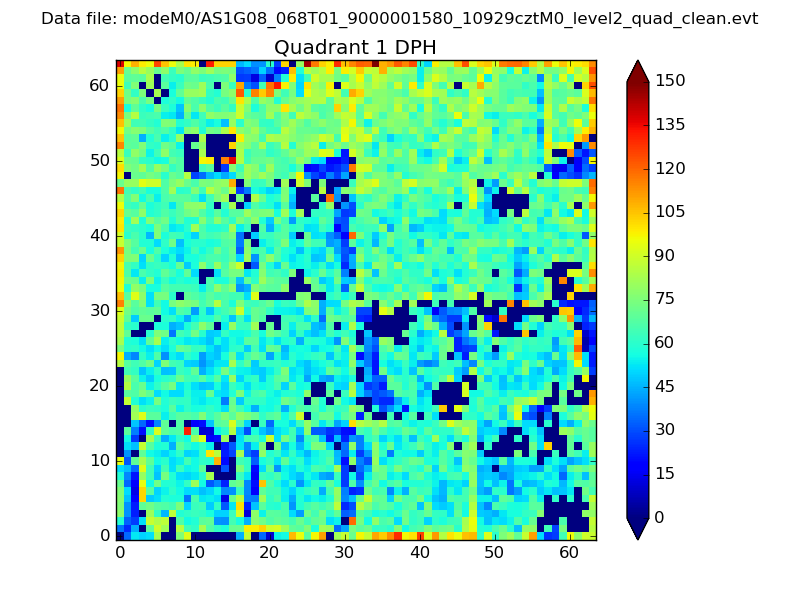 |
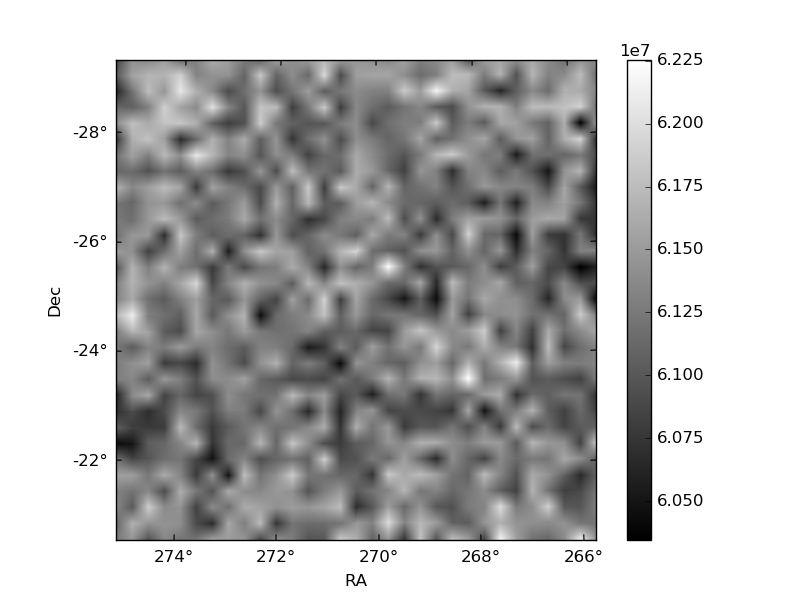
Quadrant B |
|---|---|---|---|
| Quadrant D | 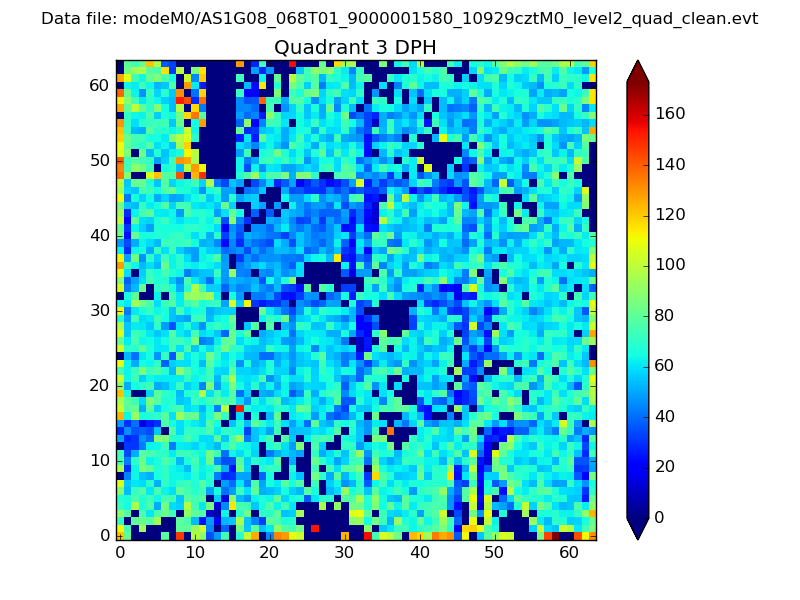 |
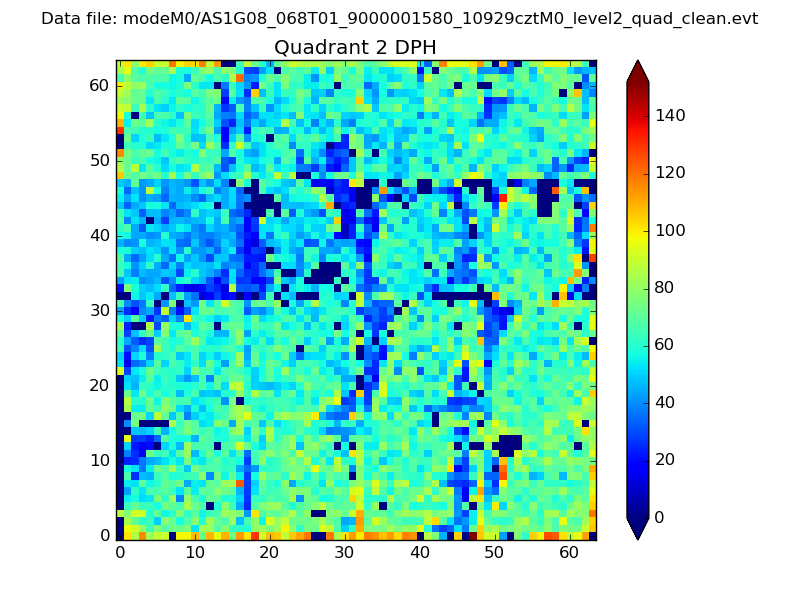 |
Quadrant C |
| Plot type | Count rate plots | Images |
|---|---|---|
| Comparison with Poisson distribution Blue bars denote a histogram of data divided into 1 sec bins. Red curve is a Poisson curve with rate = median count rate of data. |
 |
 |
| Quadrant-wise count rates Data is divided into 100 sec bins |
 |
|
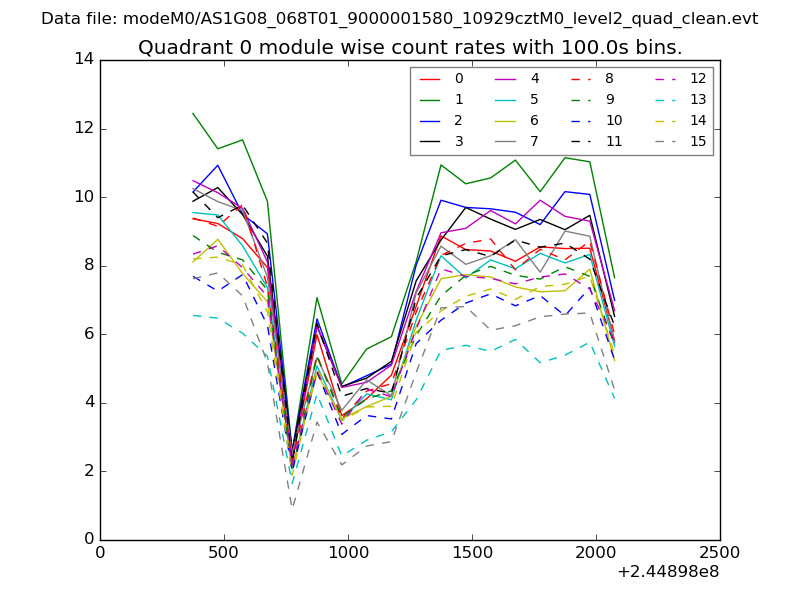
| Module-wise count rates for Quadrant A Data is divided into 100 sec bins |
 |
 |
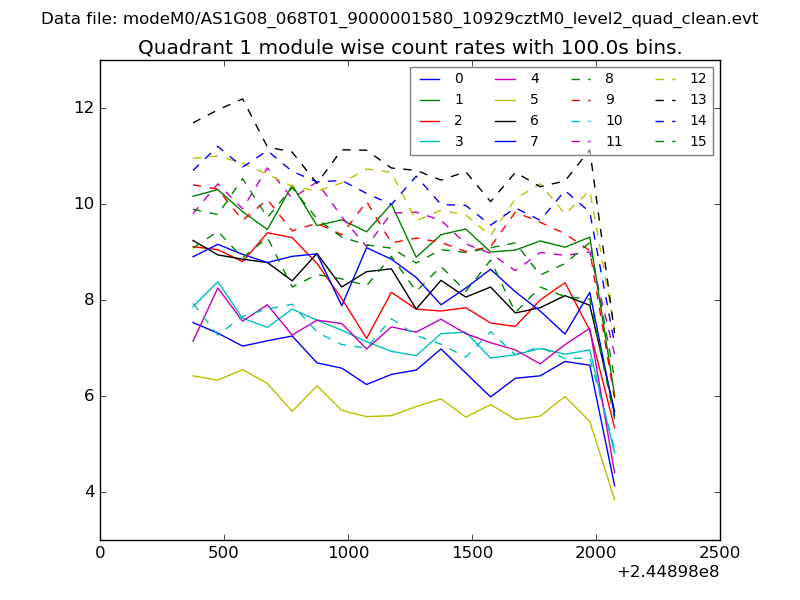
| Module-wise count rates for Quadrant B Data is divided into 100 sec bins |
 |
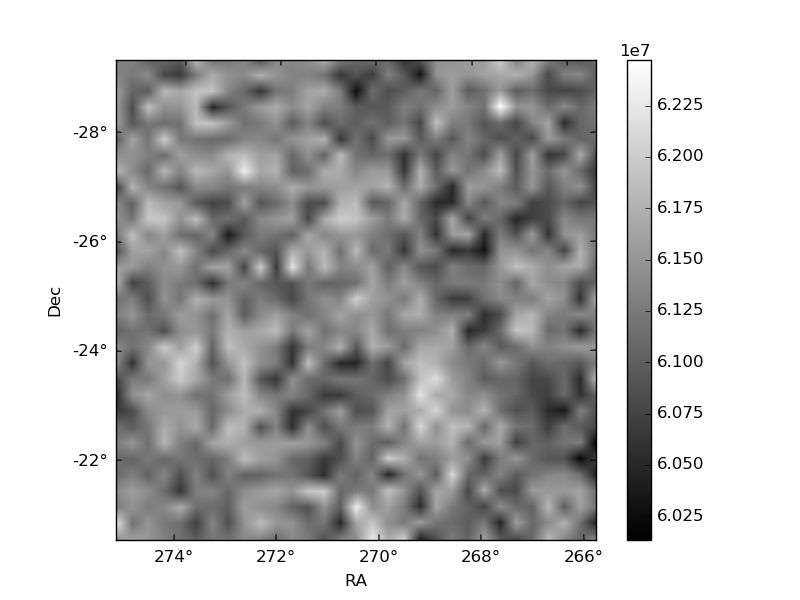 |
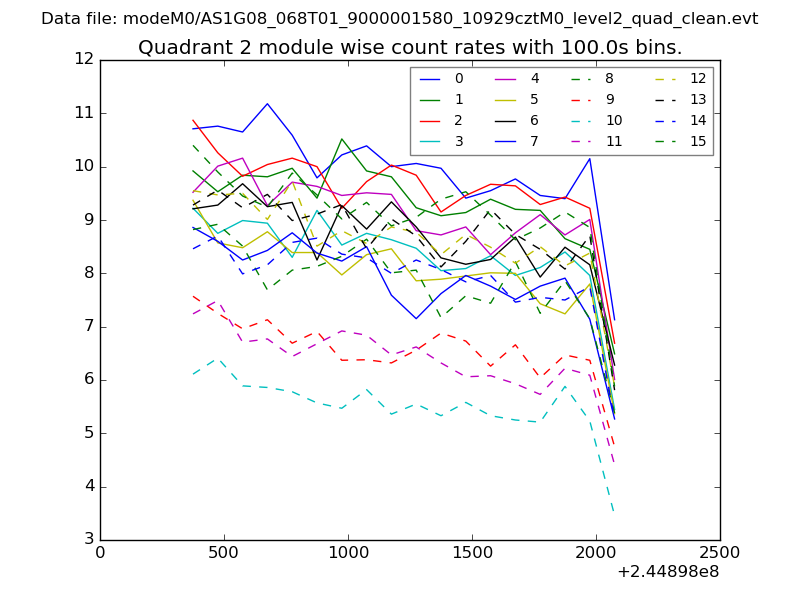
| Module-wise count rates for Quadrant C Data is divided into 100 sec bins |
 |
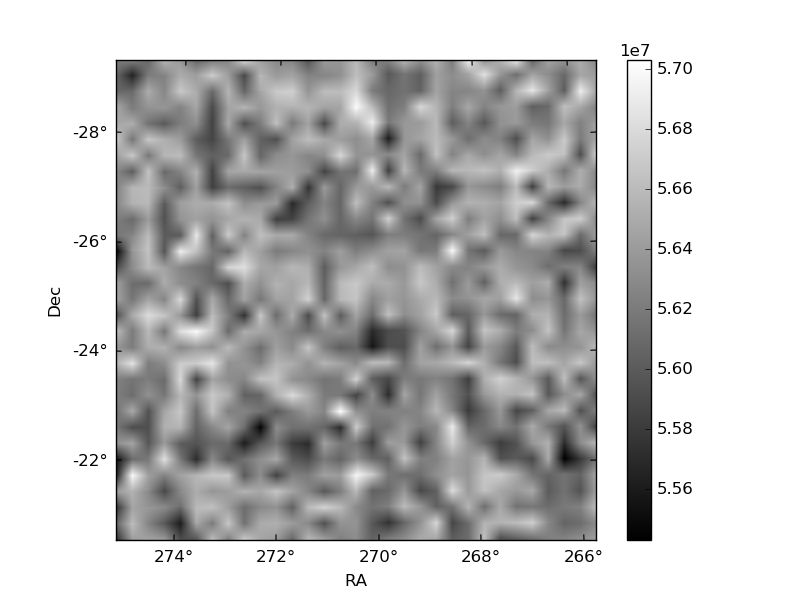 |
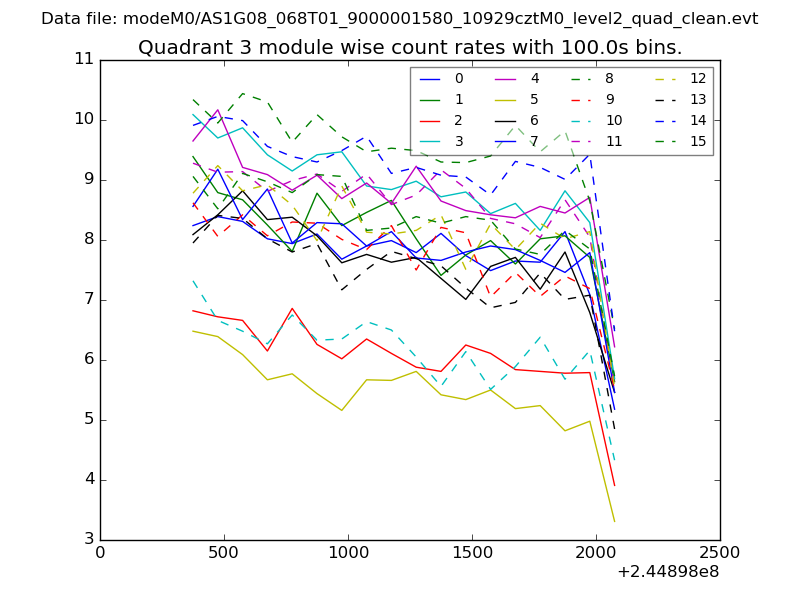
| Module-wise count rates for Quadrant D Data is divided into 100 sec bins |
 |
 |
| Parameter | Plot |
|---|---|
| CZT HV Monitor | 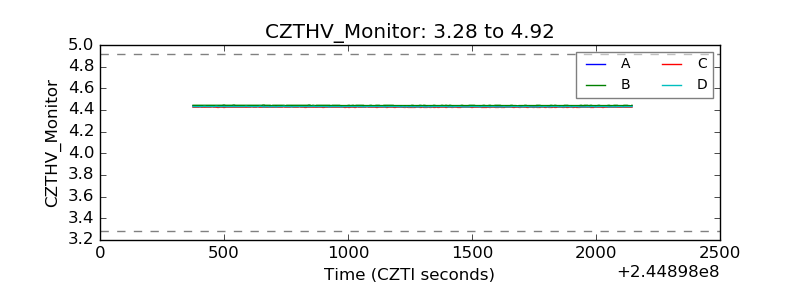 |
| D_VDD | 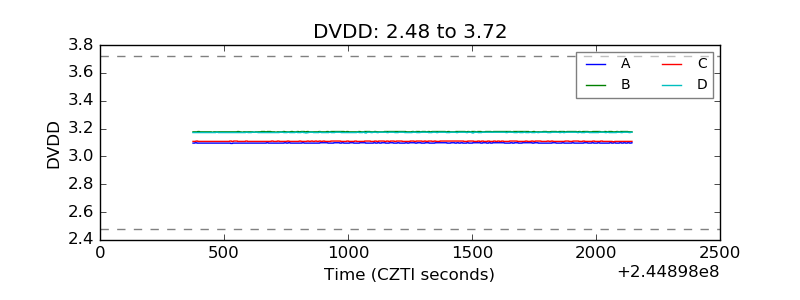 |
| Temperature 1 | 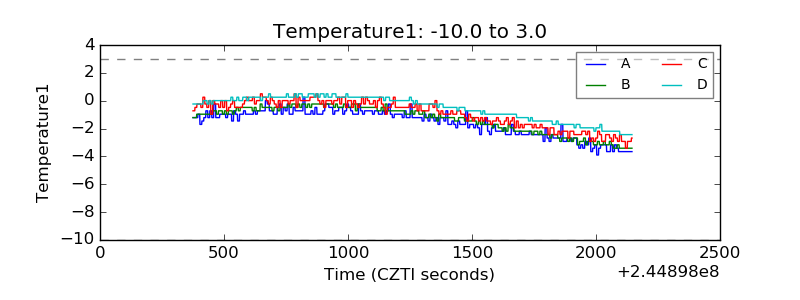 |
| Veto HV Monitor | 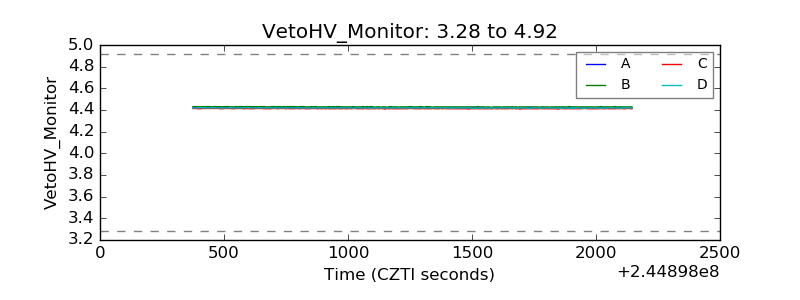 |
| Veto LLD | 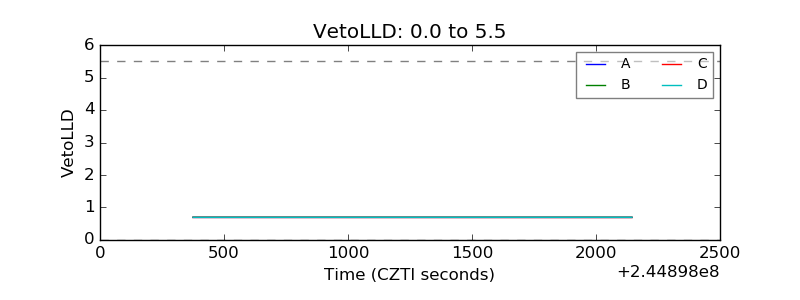 |
| Alpha Counter |  |
| _CPM_Rate |  |
| CZT Counter | 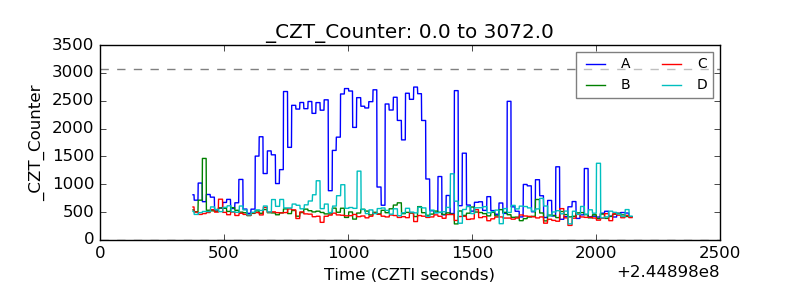 |
| +2.5 Volts monitor |  |
| +5 Volts monitor |  |
| _ROLL_ROT | 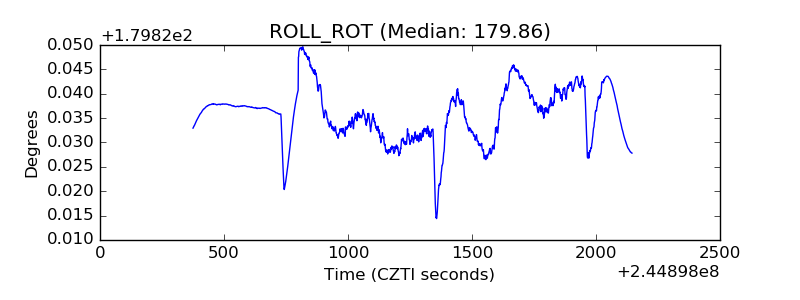 |
| _Roll_DEC | 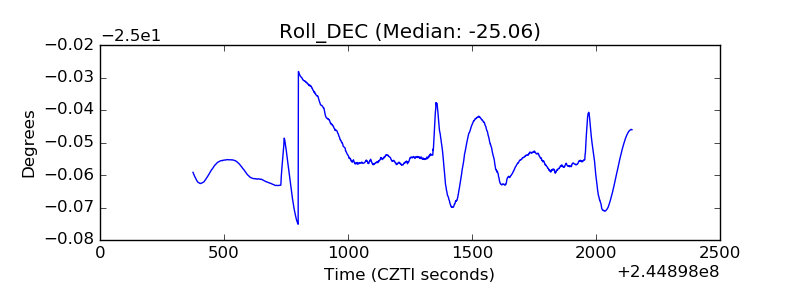 |
| _Roll_RA | 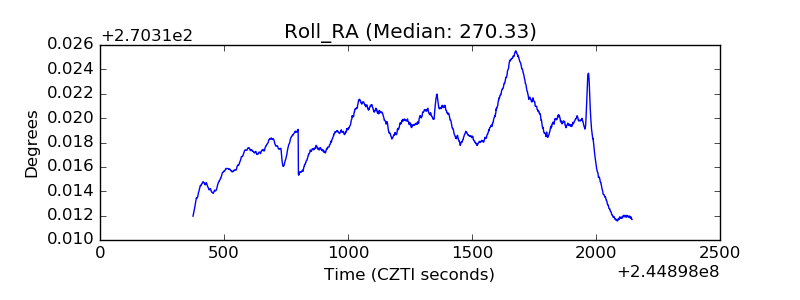 |
| Veto Counter | 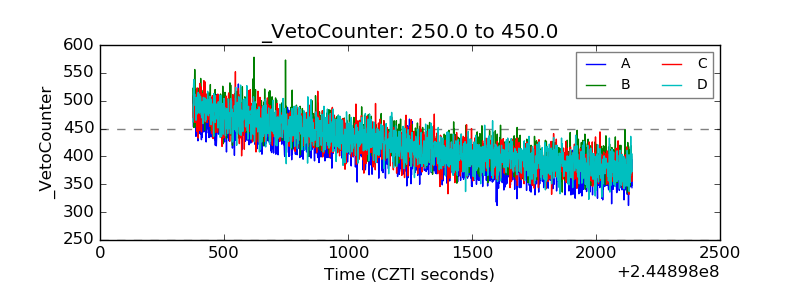 |