| Param | Original file | Final file |
|---|---|---|
| Filename | modeM0/AS1C03_013T01_9000001586cztM0_level2.fits | modeM0/AS1C03_013T01_9000001586cztM0_level2_quad_clean.evt |
| Size (bytes) | 323,372,160 | 207,596,160 |
| Size | 308.4 MB | 198.0 MB |
| Events in quadrant A | 2,014,840 | 1,088,309 |
| Events in quadrant B | 1,878,060 | 1,035,269 |
| Events in quadrant C | 1,993,736 | 1,040,073 |
| Events in quadrant D | 1,667,162 | 883,213 |
| Mode M0 | |||
|---|---|---|---|
| Quadrant | BADHDUFLAG | Total packets | Discarded packets |
| A | 0 | 73487 | 0 |
| B | 0 | 91330 | 0 |
| C | 0 | 67199 | 0 |
| D | 0 | 89964 | 0 |
| Mode M9 | |||
|---|---|---|---|
| Quadrant | BADHDUFLAG | Total packets | Discarded packets |
| A | 0 | 77 | 0 |
| B | 0 | 77 | 0 |
| C | 0 | 77 | 0 |
| D | 0 | 77 | 0 |
| Mode SS | |||
|---|---|---|---|
| Quadrant | BADHDUFLAG | Total packets | Discarded packets |
| A | 0 | 664 | 0 |
| B | 0 | 664 | 0 |
| C | 0 | 664 | 0 |
| D | 0 | 664 | 0 |
| Quadrant | Total seconds | Saturated seconds | Saturation percentage |
|---|---|---|---|
| A | 32569 | 679 | 2.084805% |
| B | 32571 | 2423 | 7.439133% |
| C | 32571 | 252 | 0.773694% |
| D | 32568 | 2348 | 7.209531% |
Noise dominated data is calculated using 1-second bins in cleaned event files. If a bin has >2000 counts, and if more than 50% of those come from <1% of pixels, then it is considered to be noise-dominated and hence unusable.
| Quadrant | # 1 sec bins | Bins with >0 counts | Bins with >2000 counts | High rate bins dominated by noise | Noise dominated (total time) | Noise dominated (detector-on time) | Marked lightcurve |
|---|---|---|---|---|---|---|---|
| A | 39837 | 32581 | 0 | 0 | 0.00% | 0.00% | 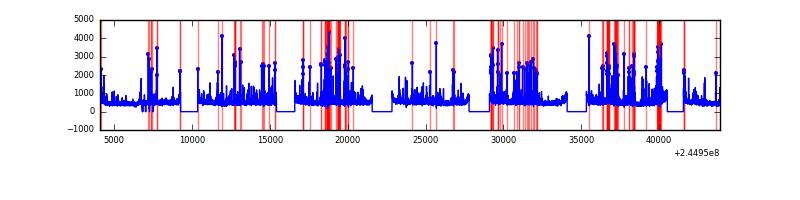 |
| B | 39837 | 32579 | 0 | 0 | 0.00% | 0.00% | 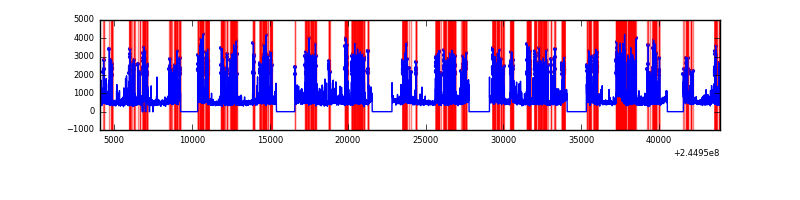 |
| C | 39837 | 32585 | 0 | 0 | 0.00% | 0.00% | 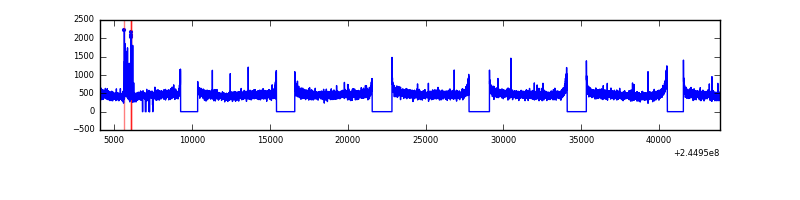 |
| D | 39837 | 32396 | 0 | 0 | 0.00% | 0.00% | 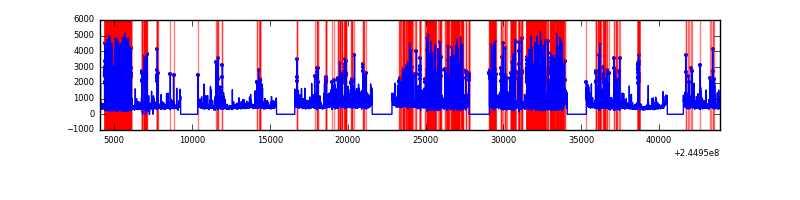 |
Top three noisy pixels from each quadrant. If the there are fewer than three noisy pixels in the level2.evt file, extra rows are filled as -1
| Pixel properties | Quadrant properties | ||||||
|---|---|---|---|---|---|---|---|
| Quadrant | DetID | PixID | Counts | Sigma | Mean | Median | Sigma |
| A | 0 | 29 | 1914 | 10.87 | 526 | 494 | 130.6 |
| A | 7 | 110 | 1644 | 8.8 | 526 | 494 | 130.6 |
| A | 0 | 30 | 1528 | 7.91 | 526 | 494 | 130.6 |
| B | 2 | 9 | 1624 | 11.56 | 496 | 474 | 99.5 |
| B | 5 | 128 | 1229 | 7.59 | 496 | 474 | 99.5 |
| B | 14 | 254 | 1220 | 7.5 | 496 | 474 | 99.5 |
| C | 1 | 80 | 1380 | 6.48 | 526 | 492 | 137.0 |
| C | 1 | 81 | 1360 | 6.34 | 526 | 492 | 137.0 |
| C | 9 | 188 | 1347 | 6.24 | 526 | 492 | 137.0 |
| D | 6 | 231 | 1189 | 6.04 | 476 | 434 | 125.1 |
| D | 7 | 3 | 1183 | 5.99 | 476 | 434 | 125.1 |
| D | 7 | 5 | 1179 | 5.96 | 476 | 434 | 125.1 |
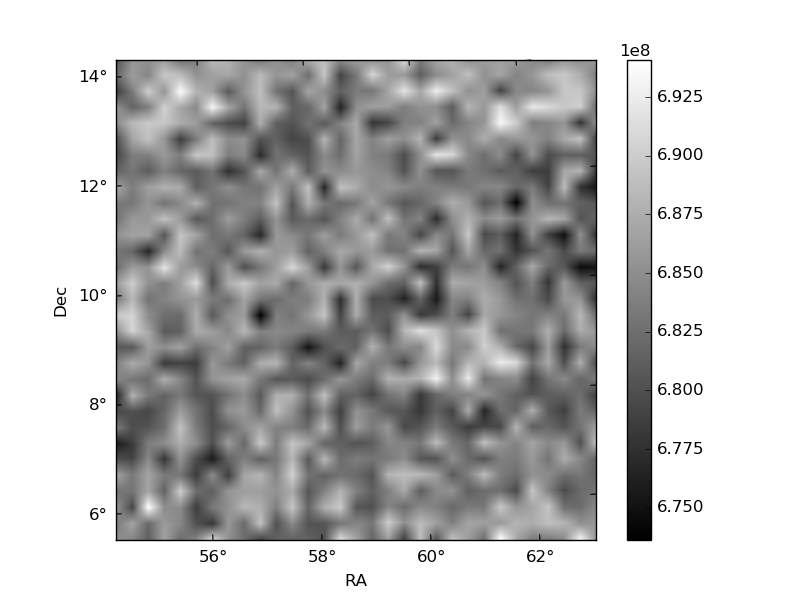
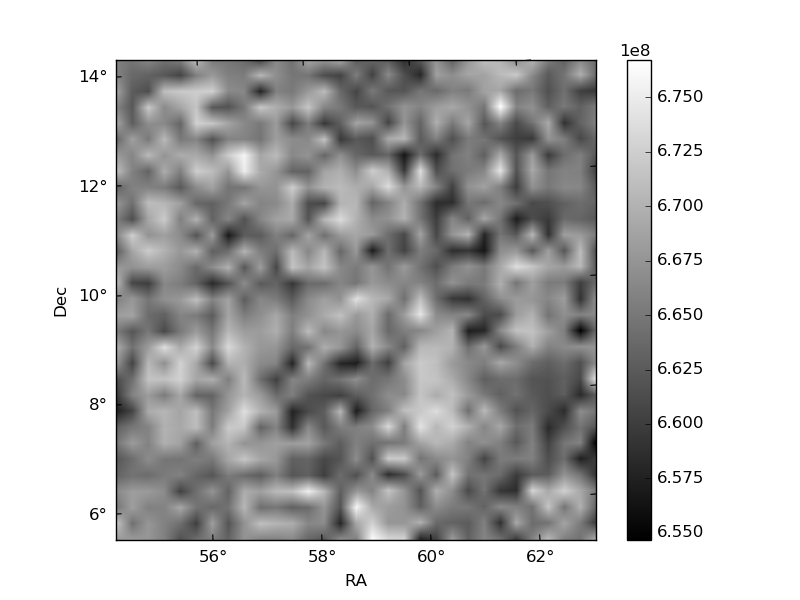
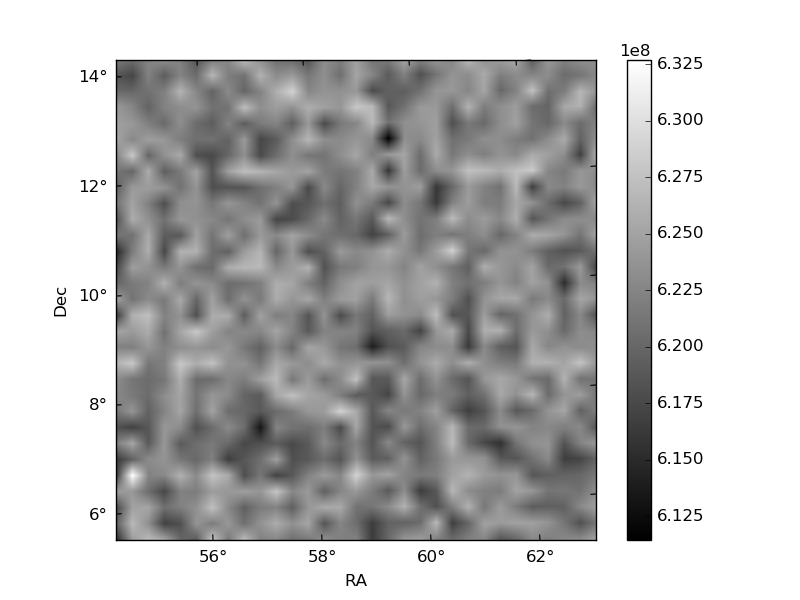
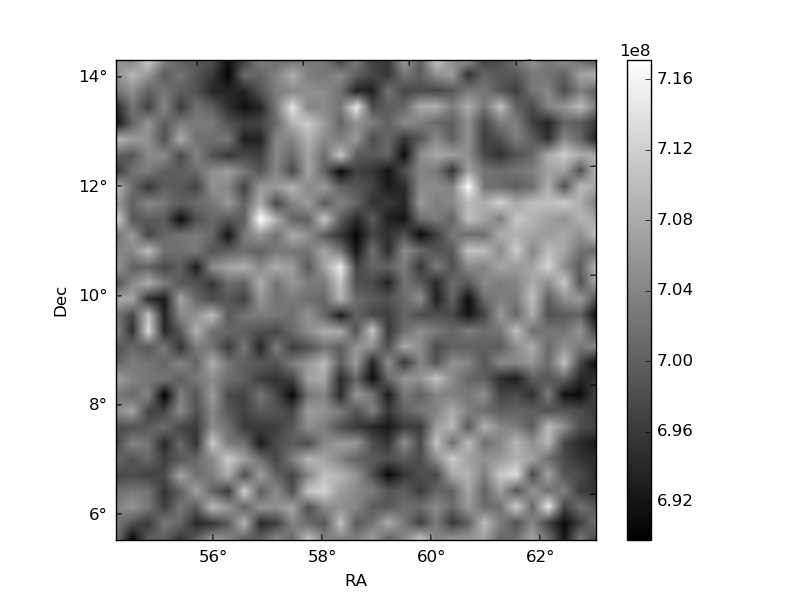
Histogram calculated using DETX and DETY for each event in the final _common_clean file
| Quadrant A | 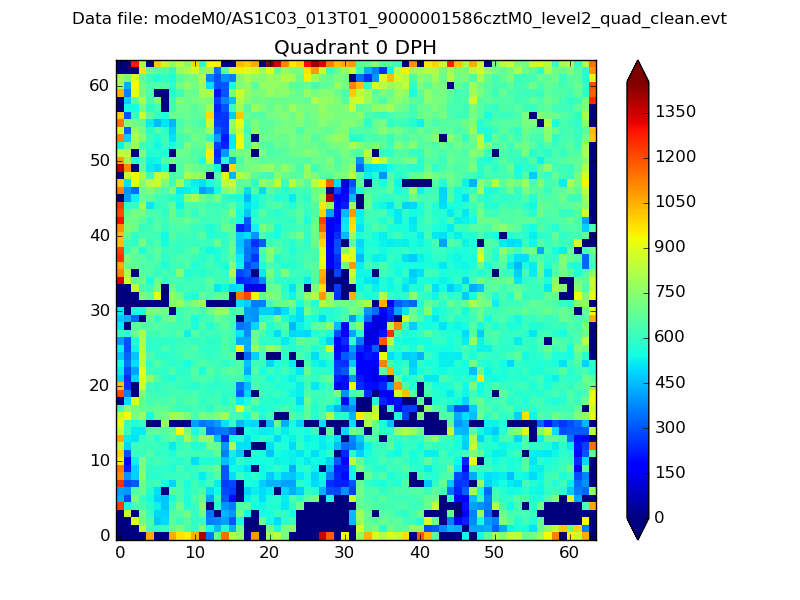 |
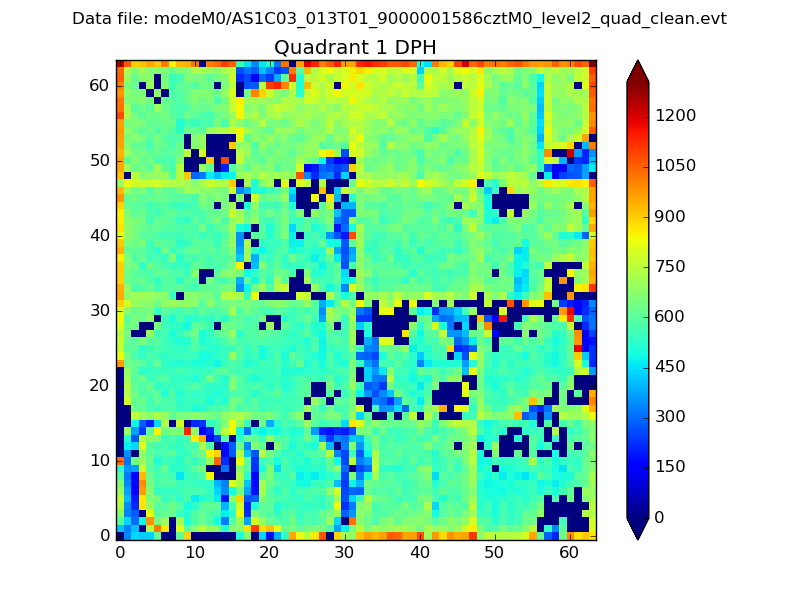 |
Quadrant B |
|---|---|---|---|
| Quadrant D | 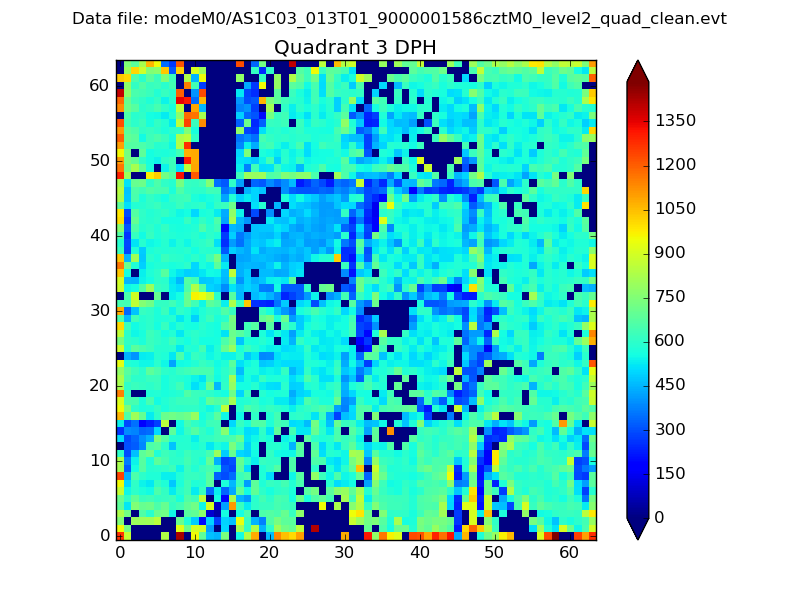 |
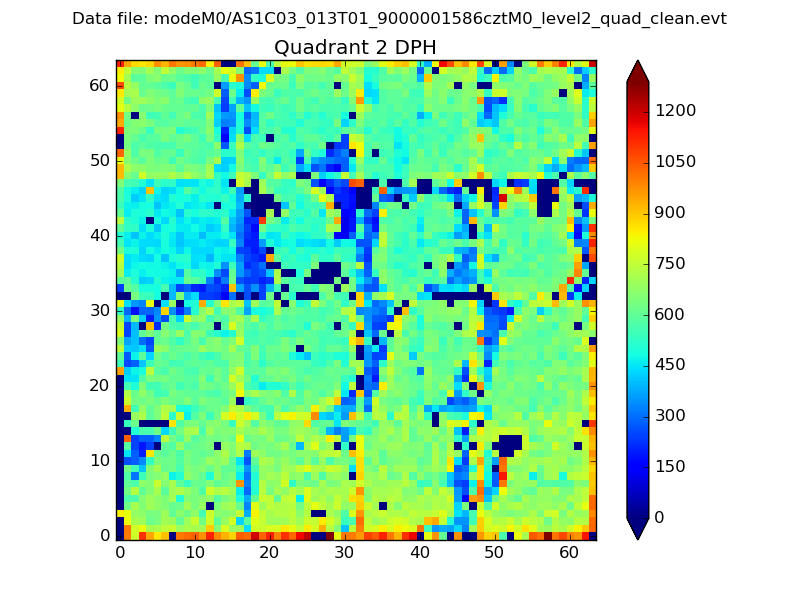 |
Quadrant C |
| Plot type | Count rate plots | Images |
|---|---|---|
| Comparison with Poisson distribution Blue bars denote a histogram of data divided into 1 sec bins. Red curve is a Poisson curve with rate = median count rate of data. |
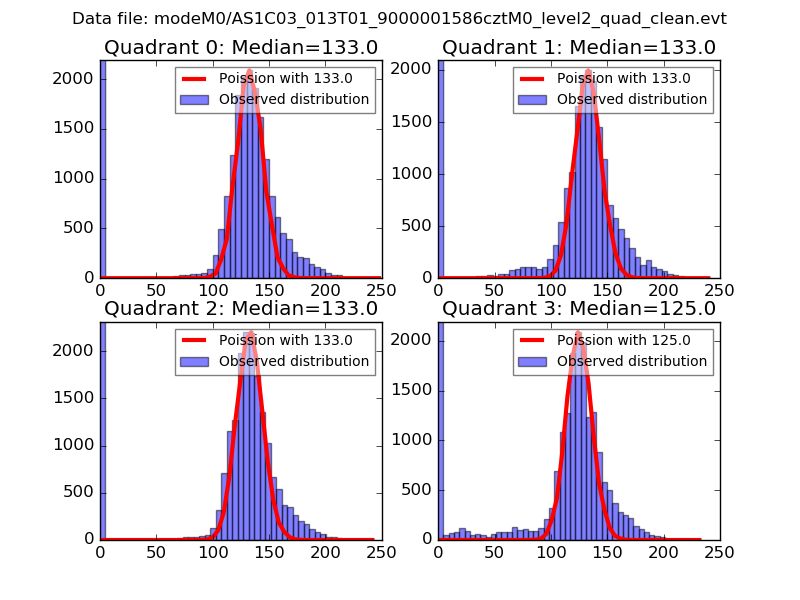 |
 |
| Quadrant-wise count rates Data is divided into 100 sec bins |
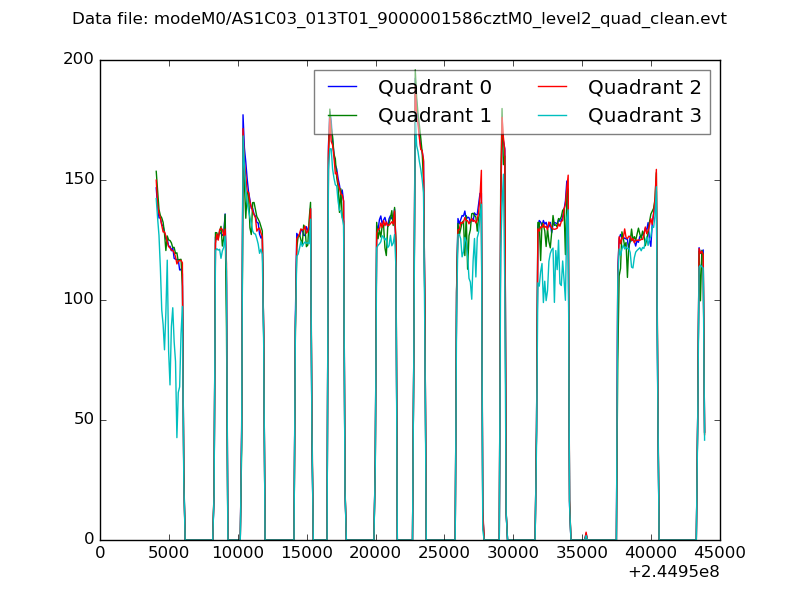 |
|
| Module-wise count rates for Quadrant A Data is divided into 100 sec bins |
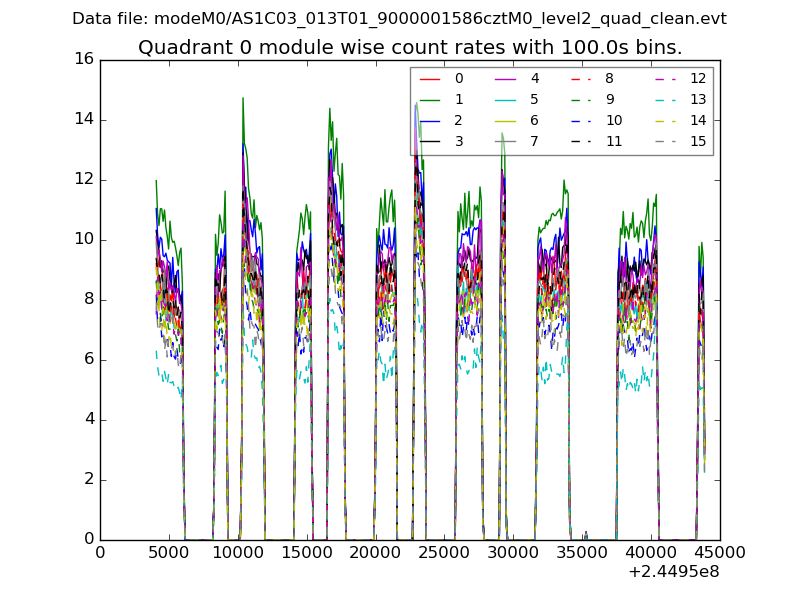 |
 |
| Module-wise count rates for Quadrant B Data is divided into 100 sec bins |
 |
 |
| Module-wise count rates for Quadrant C Data is divided into 100 sec bins |
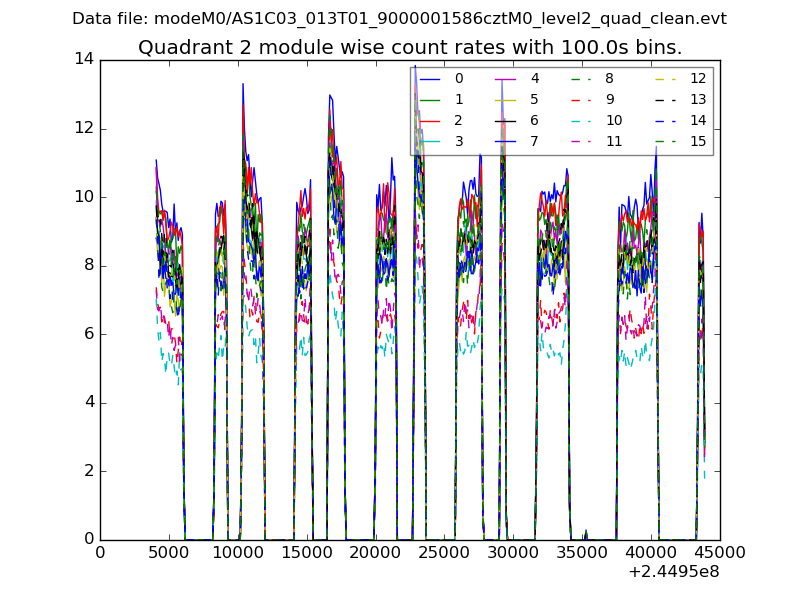 |
 |
| Module-wise count rates for Quadrant D Data is divided into 100 sec bins |
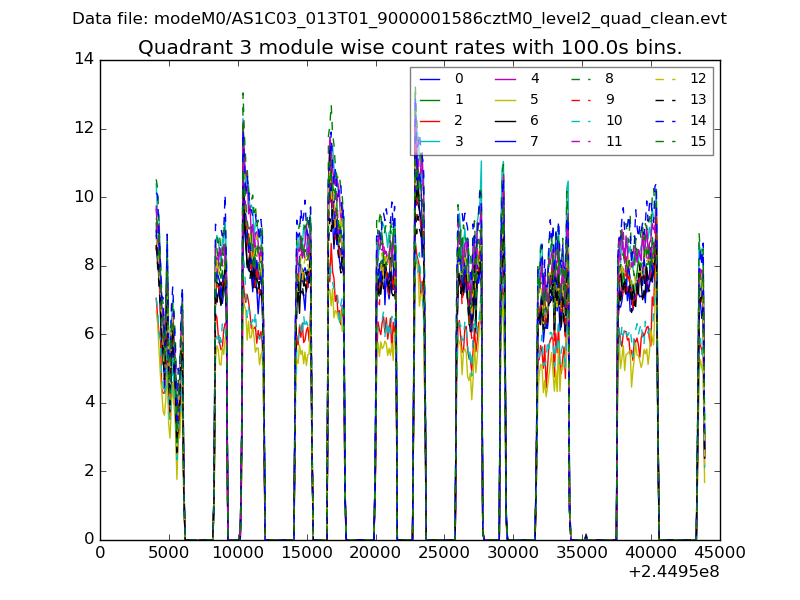 |
 |
| Parameter | Plot |
|---|---|
| CZT HV Monitor |  |
| D_VDD | 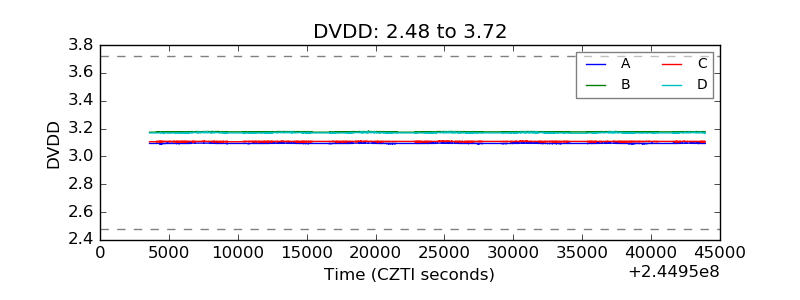 |
| Temperature 1 | 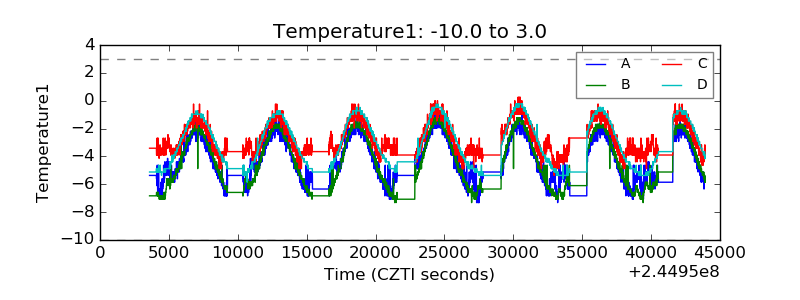 |
| Veto HV Monitor | 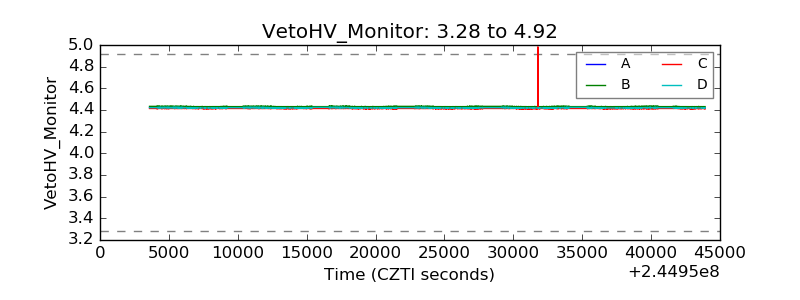 |
| Veto LLD | 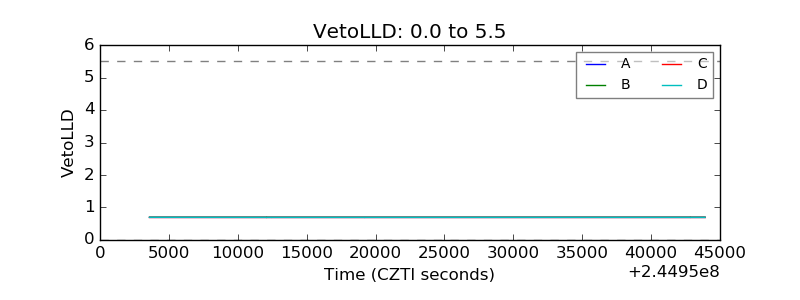 |
| Alpha Counter |  |
| _CPM_Rate |  |
| CZT Counter |  |
| +2.5 Volts monitor |  |
| +5 Volts monitor |  |
| _ROLL_ROT | 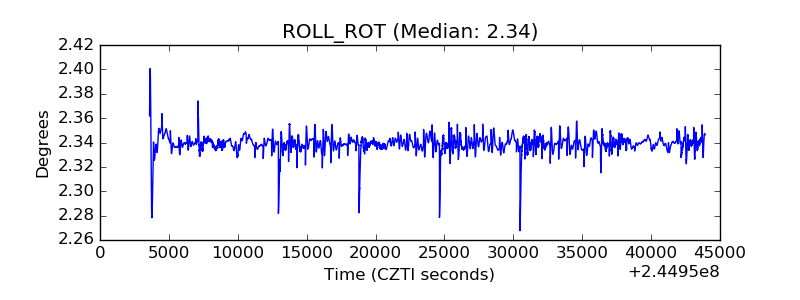 |
| _Roll_DEC | 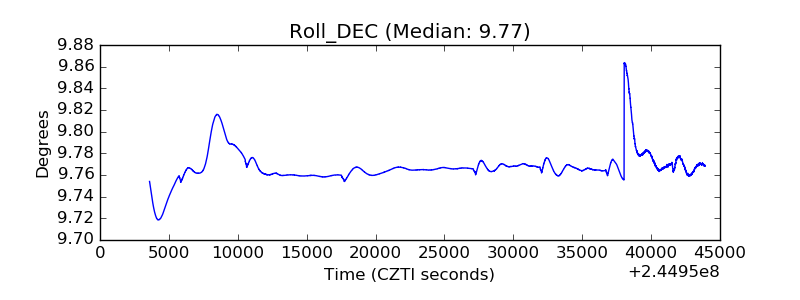 |
| _Roll_RA | 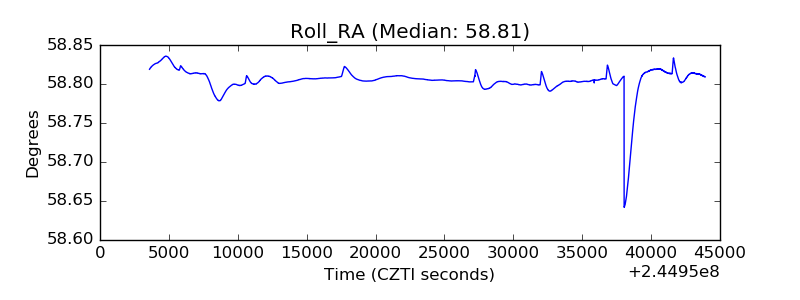 |
| Veto Counter | 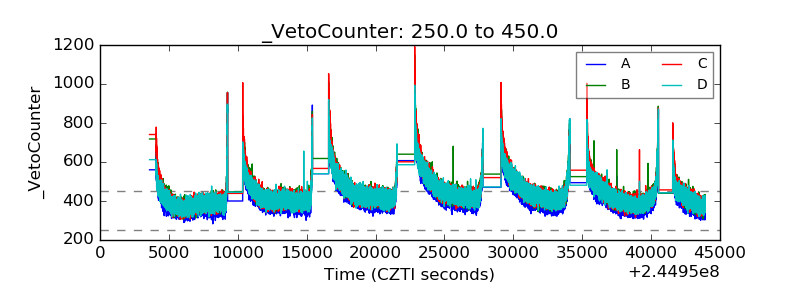 |