| Param | Original file | Final file |
|---|---|---|
| Filename | modeM0/AS1C03_013T01_9000001586_10937cztM0_level2.evt | modeM0/AS1C03_013T01_9000001586_10937cztM0_level2_quad_clean.evt |
| Size (bytes) | 159,742,080 | 29,759,040 |
| Size | 152.3 MB | 28.4 MB |
| Events in quadrant A | 817,877 | 206,880 |
| Events in quadrant B | 947,241 | 211,308 |
| Events in quadrant C | 741,595 | 207,758 |
| Events in quadrant D | 2,217,314 | 153,989 |
| Mode M0 | |||
|---|---|---|---|
| Quadrant | BADHDUFLAG | Total packets | Discarded packets |
| A | 0 | 3567 | 2 |
| B | 0 | 3887 | 1 |
| C | 0 | 3354 | 1 |
| D | 0 | 7724 | 1 |
| Mode M9 | |||
|---|---|---|---|
| Quadrant | BADHDUFLAG | Total packets | Discarded packets |
| A | 0 | 5 | 0 |
| B | 0 | 5 | 0 |
| C | 0 | 5 | 0 |
| D | 0 | 5 | 0 |
| Mode SS | |||
|---|---|---|---|
| Quadrant | BADHDUFLAG | Total packets | Discarded packets |
| A | 0 | 34 | 0 |
| B | 0 | 34 | 0 |
| C | 0 | 34 | 0 |
| D | 0 | 34 | 0 |
| Quadrant | Total seconds | Saturated seconds | Saturation percentage |
|---|---|---|---|
| A | 1633 | 5 | 0.306185% |
| B | 1633 | 20 | 1.224740% |
| C | 1633 | 5 | 0.306185% |
| D | 1633 | 597 | 36.558481% |
Noise dominated data is calculated using 1-second bins in cleaned event files. If a bin has >2000 counts, and if more than 50% of those come from <1% of pixels, then it is considered to be noise-dominated and hence unusable.
| Quadrant | # 1 sec bins | Bins with >0 counts | Bins with >2000 counts | High rate bins dominated by noise | Noise dominated (total time) | Noise dominated (detector-on time) | Marked lightcurve |
|---|---|---|---|---|---|---|---|
| A | 1633 | 1633 | 1 | 1 | 0.06% | 0.06% | 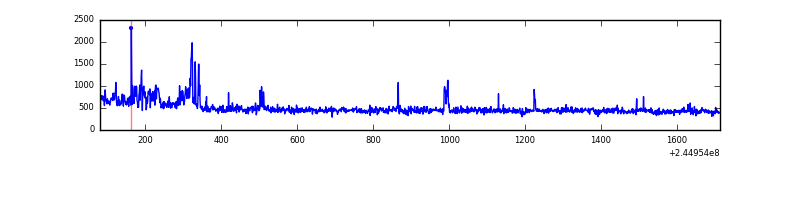 |
| B | 1633 | 1633 | 13 | 13 | 0.80% | 0.80% | 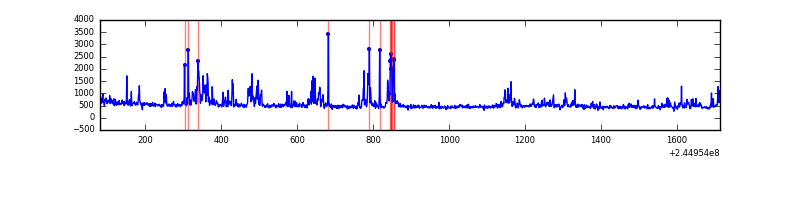 |
| C | 1633 | 1633 | 1 | 1 | 0.06% | 0.06% | 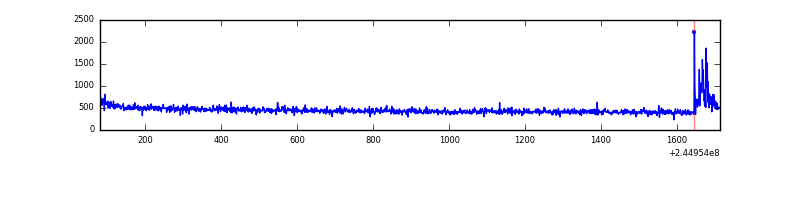 |
| D | 1632 | 1632 | 540 | 540 | 33.09% | 33.09% | 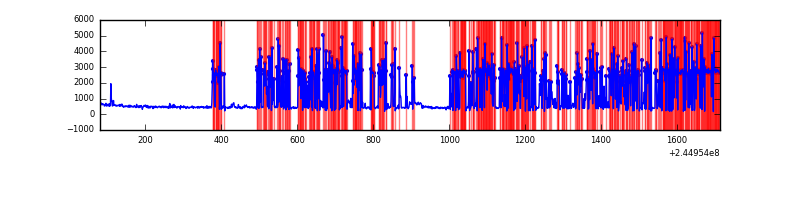 |
Top three noisy pixels from each quadrant. If the there are fewer than three noisy pixels in the level2.evt file, extra rows are filled as -1
| Pixel properties | Quadrant properties | ||||||
|---|---|---|---|---|---|---|---|
| Quadrant | DetID | PixID | Counts | Sigma | Mean | Median | Sigma |
| A | 15 | 223 | 50878 | 1253.38 | 189 | 185 | 40.4 |
| A | 15 | 239 | 17179 | 420.17 | 189 | 185 | 40.4 |
| A | 8 | 5 | 10290 | 249.84 | 189 | 185 | 40.4 |
| B | 4 | 239 | 186316 | 4861.09 | 189 | 185 | 38.3 |
| B | 4 | 81 | 9994 | 256.18 | 189 | 185 | 38.3 |
| B | 0 | 214 | 7452 | 189.79 | 189 | 185 | 38.3 |
| C | 14 | 234 | 27289 | 616.02 | 182 | 183 | 44.0 |
| C | 13 | 61 | 1364 | 26.84 | 182 | 183 | 44.0 |
| C | 8 | 222 | 660 | 10.84 | 182 | 183 | 44.0 |
| D | 1 | 52 | 1648101 | 45492.21 | 145 | 141 | 36.2 |
| D | 2 | 14 | 7340 | 198.73 | 145 | 141 | 36.2 |
| D | 13 | 249 | 5456 | 146.72 | 145 | 141 | 36.2 |
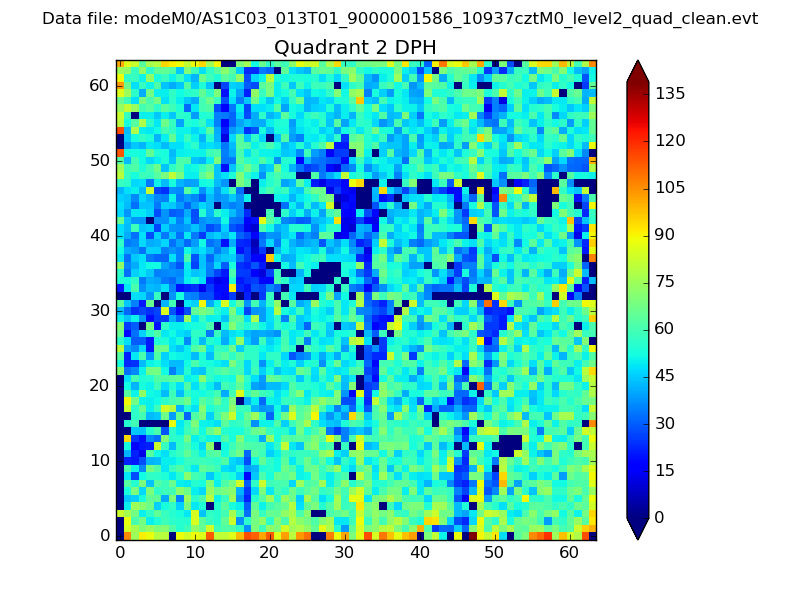
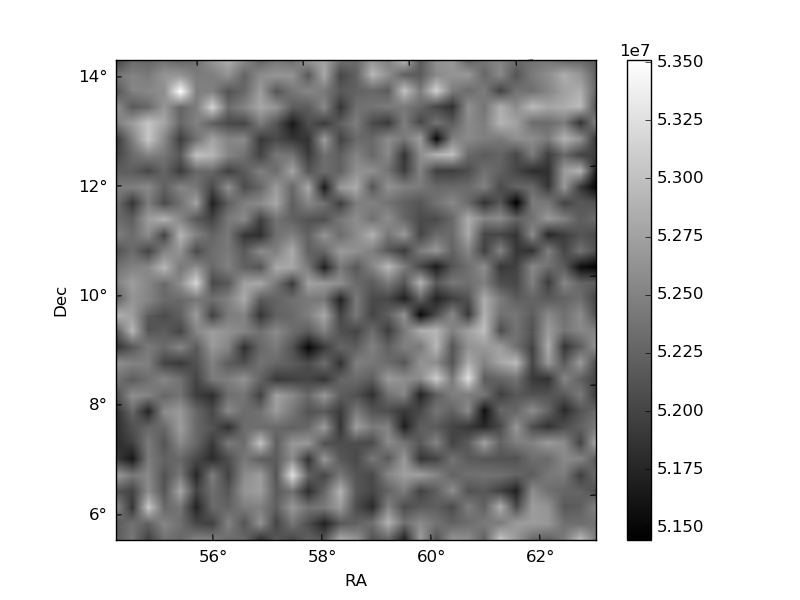
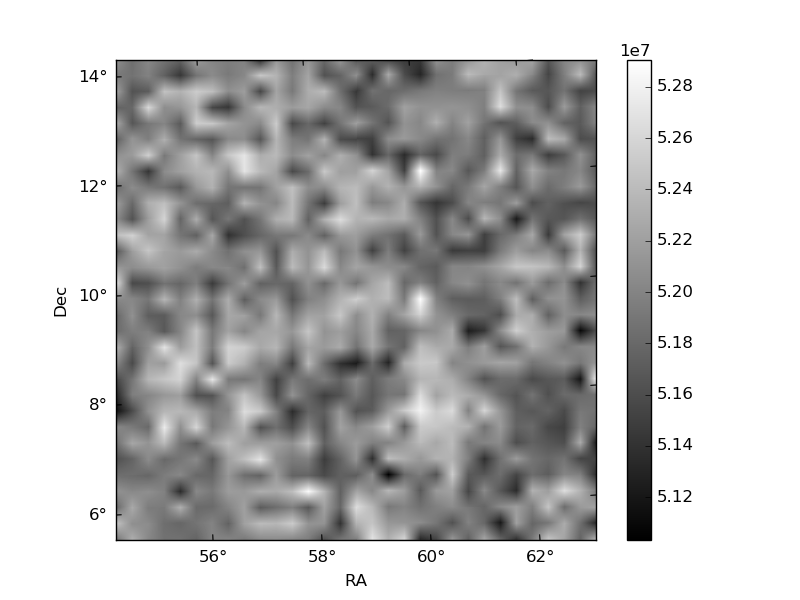
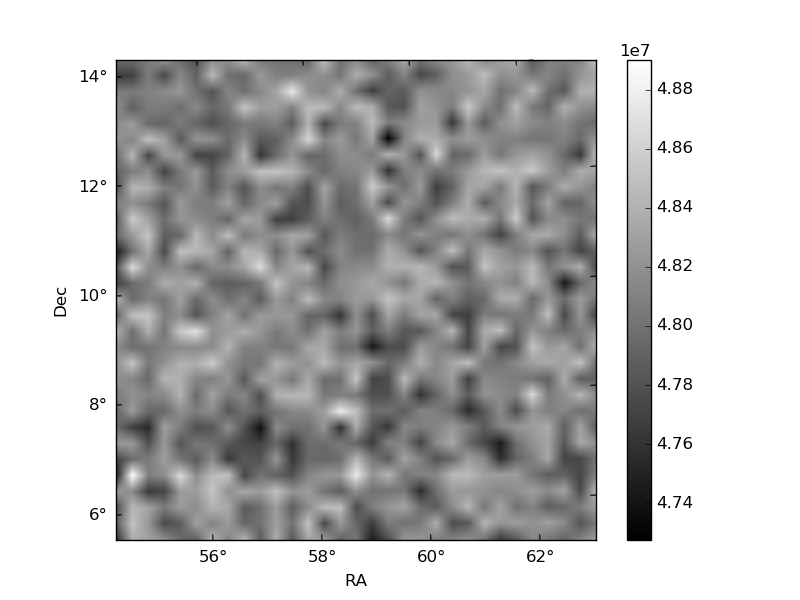
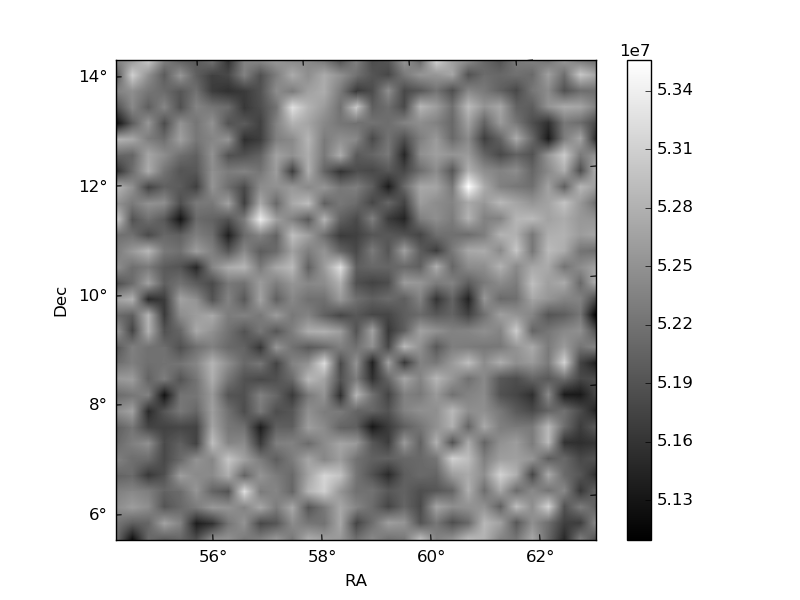
Histogram calculated using DETX and DETY for each event in the final _common_clean file
| Quadrant A | 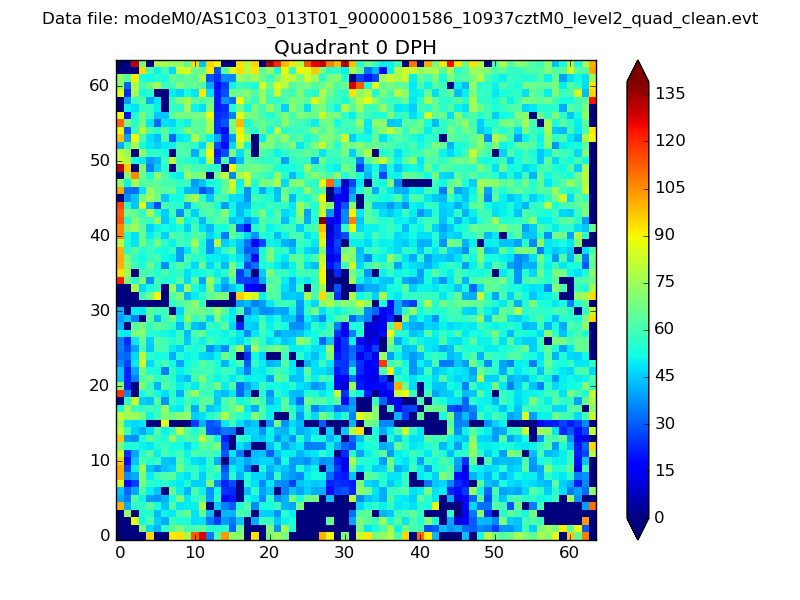 |
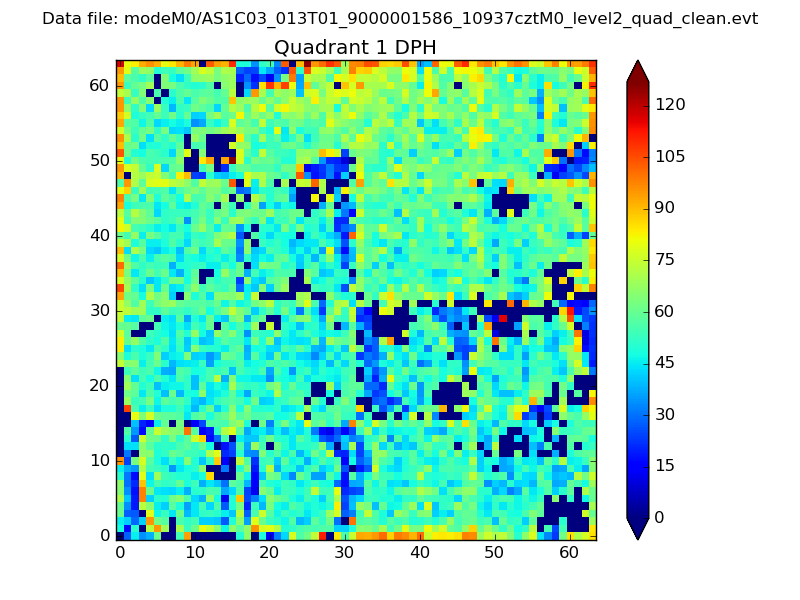 |
Quadrant B |
|---|---|---|---|
| Quadrant D | 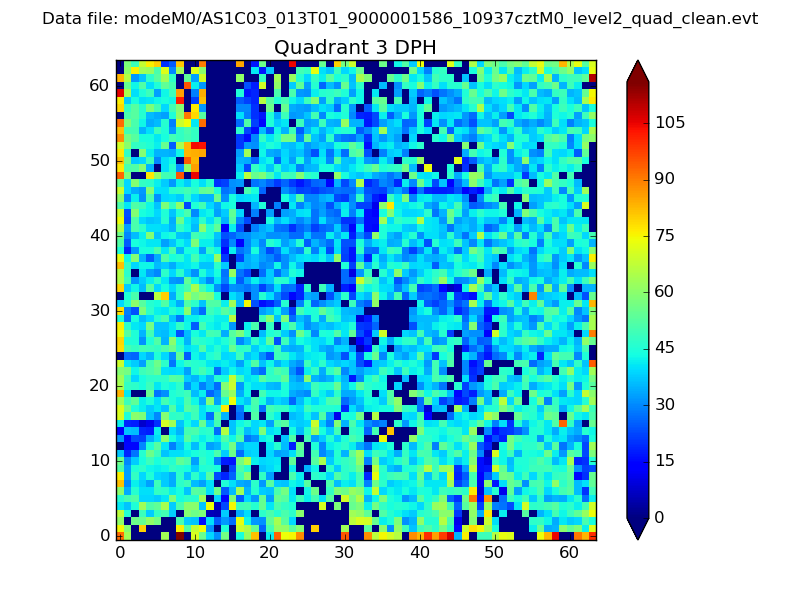 |
 |
Quadrant C |
| Plot type | Count rate plots | Images |
|---|---|---|
| Comparison with Poisson distribution Blue bars denote a histogram of data divided into 1 sec bins. Red curve is a Poisson curve with rate = median count rate of data. |
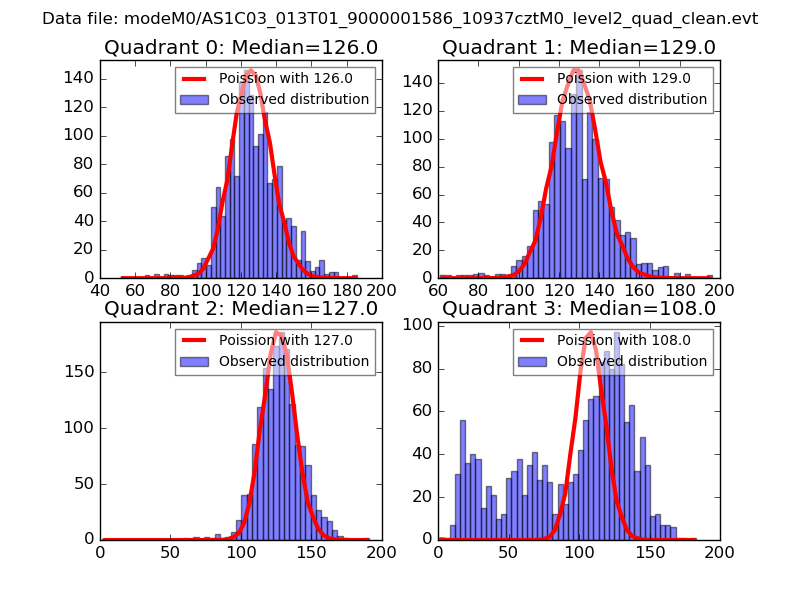 |
 |
| Quadrant-wise count rates Data is divided into 100 sec bins |
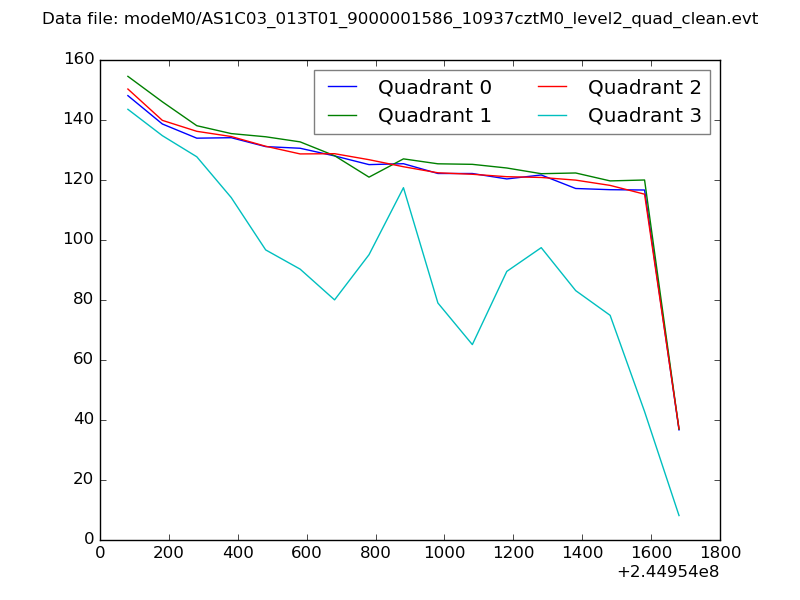 |
|
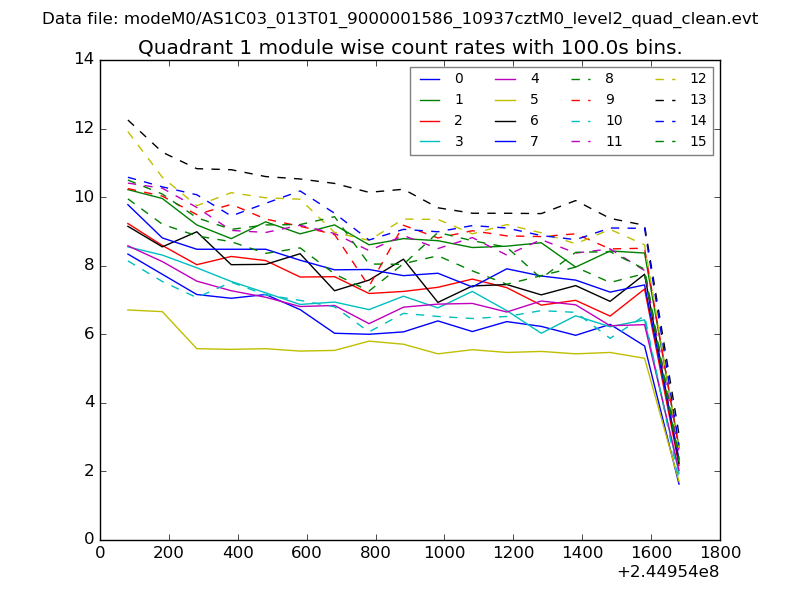
| Module-wise count rates for Quadrant A Data is divided into 100 sec bins |
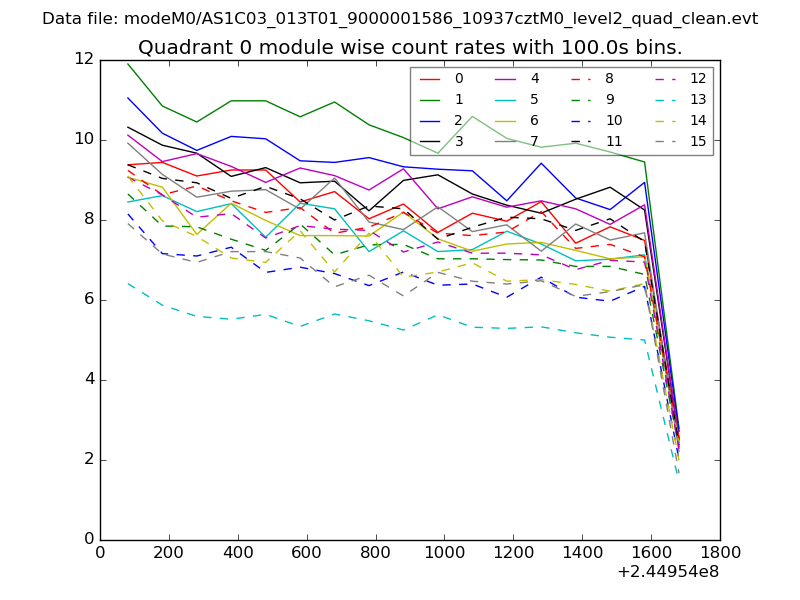 |
 |
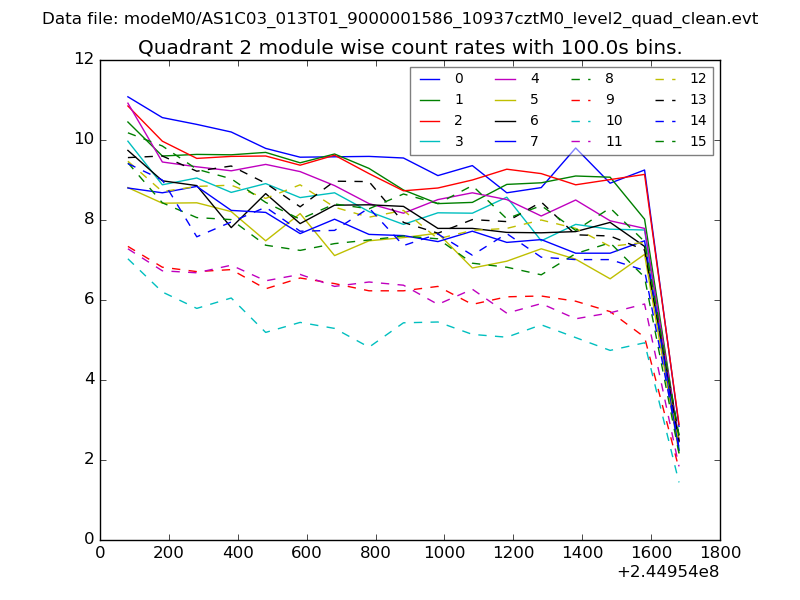
| Module-wise count rates for Quadrant B Data is divided into 100 sec bins |
 |
 |
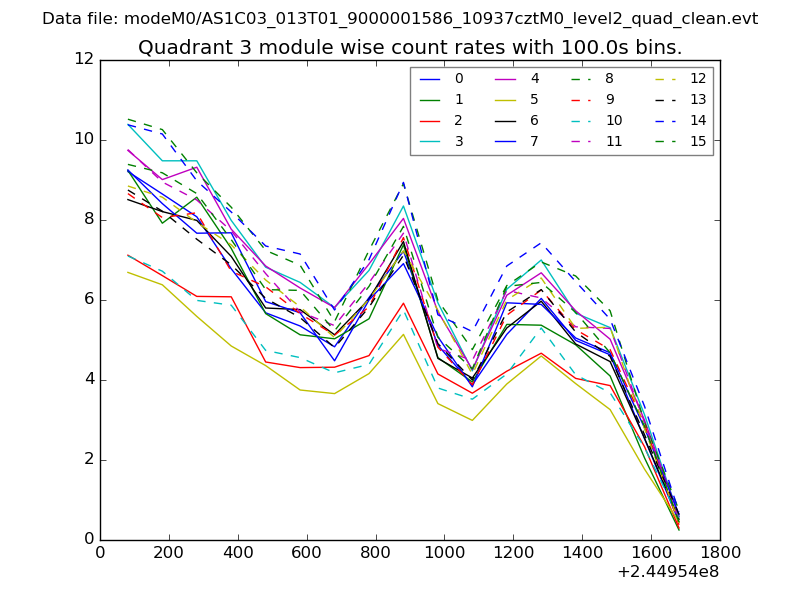
| Module-wise count rates for Quadrant C Data is divided into 100 sec bins |
 |
 |
| Module-wise count rates for Quadrant D Data is divided into 100 sec bins |
 |
 |
| Parameter | Plot |
|---|---|
| CZT HV Monitor | 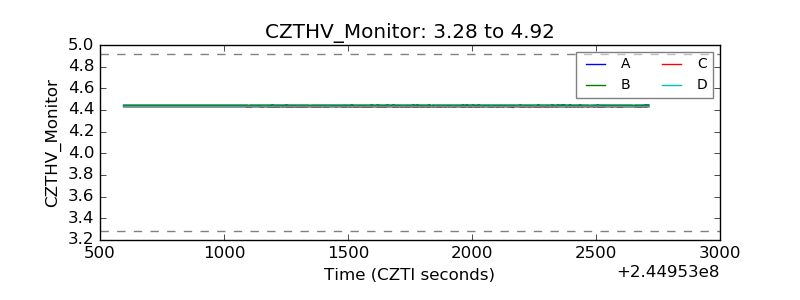 |
| D_VDD | 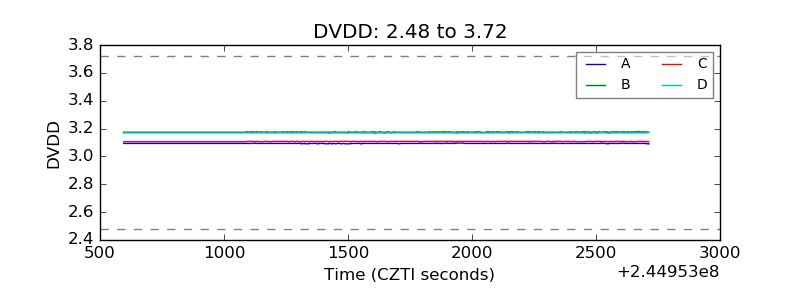 |
| Temperature 1 | 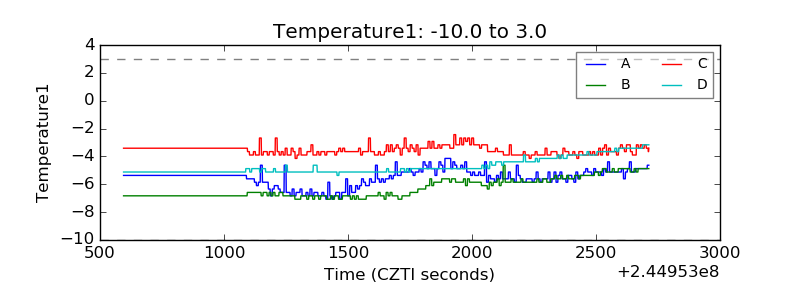 |
| Veto HV Monitor | 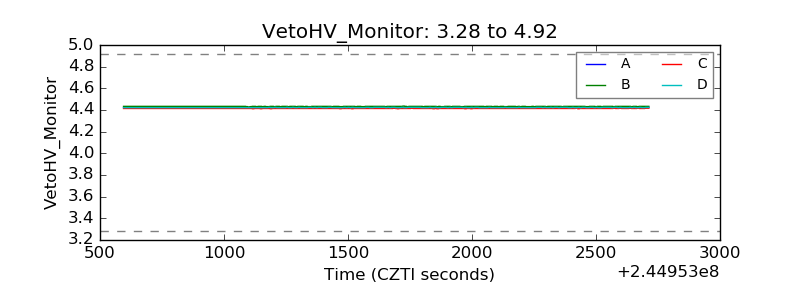 |
| Veto LLD | 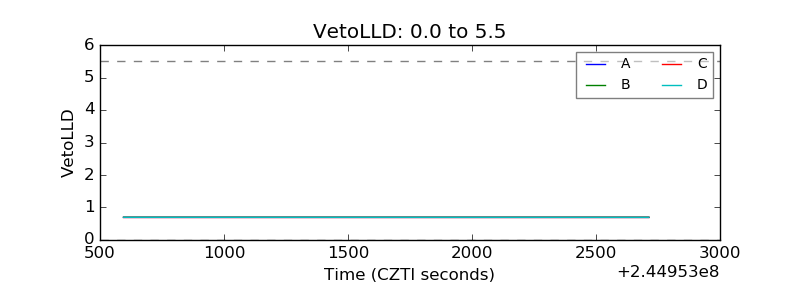 |
| Alpha Counter | 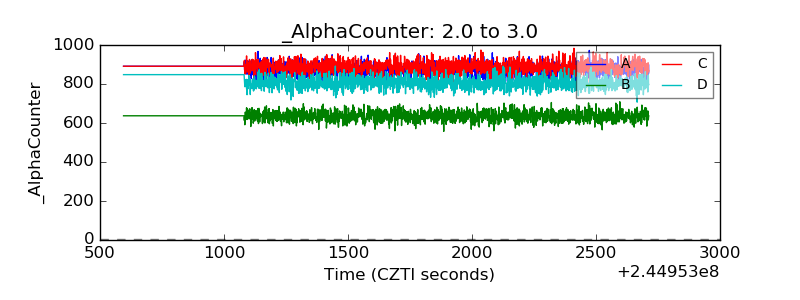 |
| _CPM_Rate | 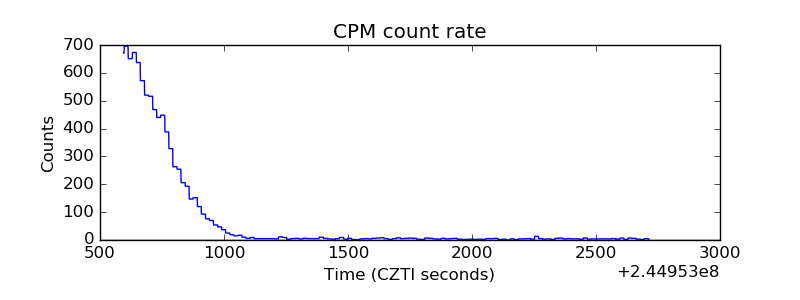 |
| CZT Counter | 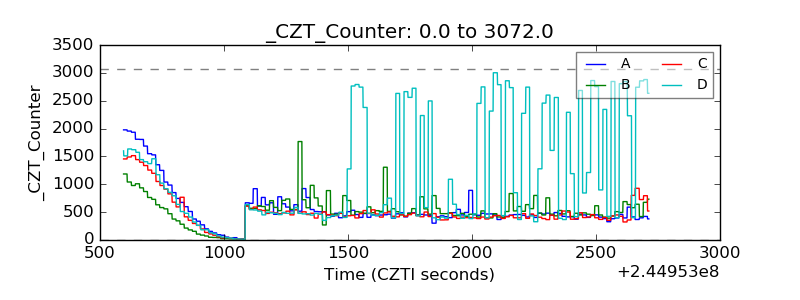 |
| +2.5 Volts monitor | 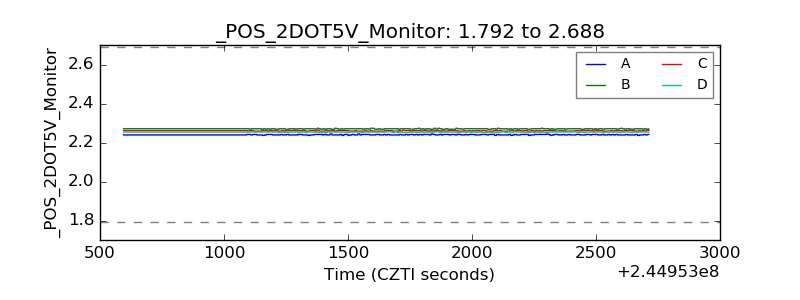 |
| +5 Volts monitor |  |
| _ROLL_ROT | 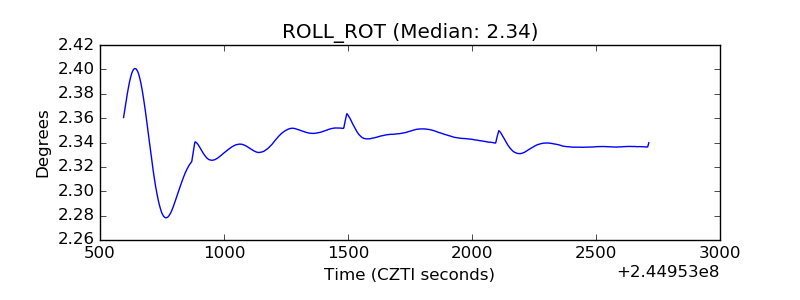 |
| _Roll_DEC | 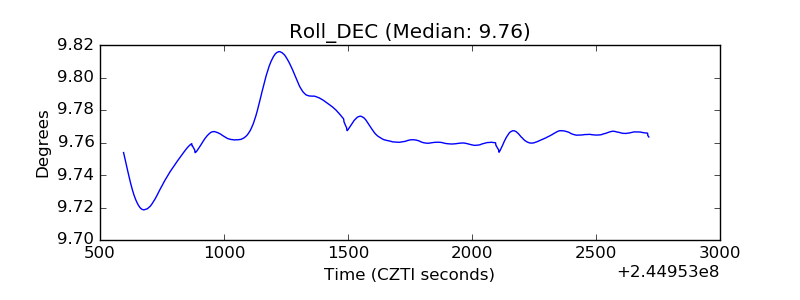 |
| _Roll_RA |  |
| Veto Counter | 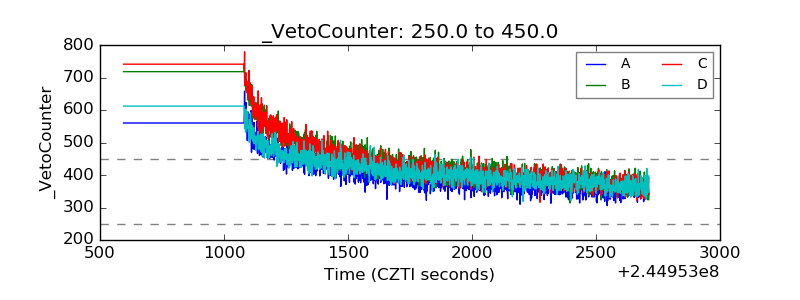 |