| Param | Original file | Final file |
|---|---|---|
| Filename | modeM0/AS1C03_013T01_9000001586_10939cztM0_level2.evt | modeM0/AS1C03_013T01_9000001586_10939cztM0_level2_quad_clean.evt |
| Size (bytes) | 479,240,640 | 76,605,120 |
| Size | 457.0 MB | 73.1 MB |
| Events in quadrant A | 2,982,274 | 493,976 |
| Events in quadrant B | 3,943,789 | 489,515 |
| Events in quadrant C | 2,788,428 | 493,445 |
| Events in quadrant D | 4,397,019 | 428,435 |
| Mode M0 | |||
|---|---|---|---|
| Quadrant | BADHDUFLAG | Total packets | Discarded packets |
| A | 0 | 12818 | 196 |
| B | 0 | 15836 | 278 |
| C | 0 | 12480 | 180 |
| D | 0 | 17244 | 223 |
| Mode M9 | |||
|---|---|---|---|
| Quadrant | BADHDUFLAG | Total packets | Discarded packets |
| A | 0 | 11 | 0 |
| B | 0 | 11 | 0 |
| C | 0 | 11 | 0 |
| D | 0 | 11 | 0 |
| Mode SS | |||
|---|---|---|---|
| Quadrant | BADHDUFLAG | Total packets | Discarded packets |
| A | 0 | 122 | 2 |
| B | 0 | 121 | 1 |
| C | 0 | 122 | 2 |
| D | 0 | 122 | 2 |
| Quadrant | Total seconds | Saturated seconds | Saturation percentage |
|---|---|---|---|
| A | 5924 | 63 | 1.063471% |
| B | 5925 | 320 | 5.400844% |
| C | 5925 | 30 | 0.506329% |
| D | 5922 | 643 | 10.857818% |
Noise dominated data is calculated using 1-second bins in cleaned event files. If a bin has >2000 counts, and if more than 50% of those come from <1% of pixels, then it is considered to be noise-dominated and hence unusable.
| Quadrant | # 1 sec bins | Bins with >0 counts | Bins with >2000 counts | High rate bins dominated by noise | Noise dominated (total time) | Noise dominated (detector-on time) | Marked lightcurve |
|---|---|---|---|---|---|---|---|
| A | 7152 | 5943 | 12 | 12 | 0.17% | 0.20% | 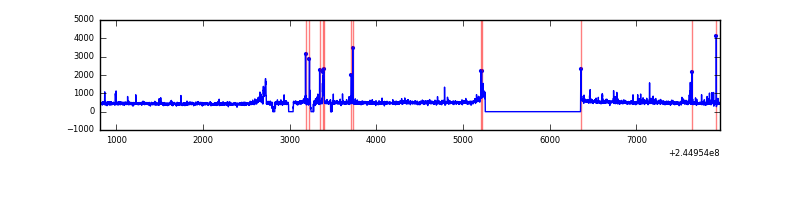 |
| B | 7152 | 5940 | 205 | 205 | 2.87% | 3.45% | 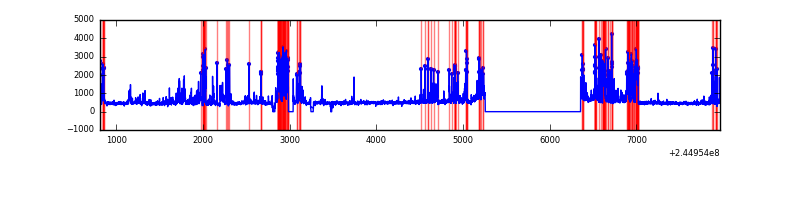 |
| C | 7152 | 5942 | 4 | 4 | 0.06% | 0.07% | 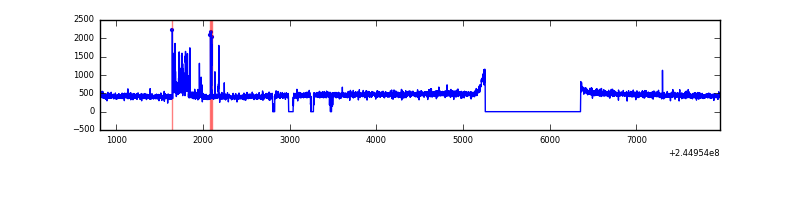 |
| D | 7152 | 5937 | 552 | 552 | 7.72% | 9.30% | 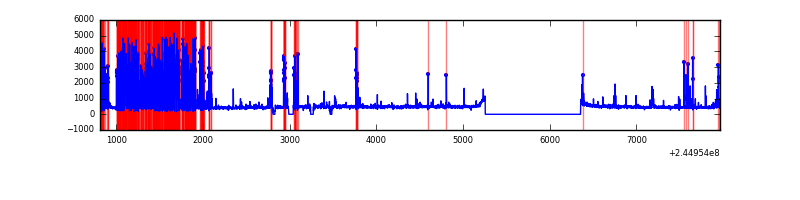 |
Top three noisy pixels from each quadrant. If the there are fewer than three noisy pixels in the level2.evt file, extra rows are filled as -1
| Pixel properties | Quadrant properties | ||||||
|---|---|---|---|---|---|---|---|
| Quadrant | DetID | PixID | Counts | Sigma | Mean | Median | Sigma |
| A | 8 | 5 | 97318 | 662.93 | 712 | 699 | 145.7 |
| A | 15 | 174 | 57226 | 387.85 | 712 | 699 | 145.7 |
| A | 15 | 223 | 39644 | 267.21 | 712 | 699 | 145.7 |
| B | 4 | 239 | 1091025 | 8142.23 | 696 | 680 | 133.9 |
| B | 0 | 219 | 46077 | 339.01 | 696 | 680 | 133.9 |
| B | 0 | 187 | 32094 | 234.59 | 696 | 680 | 133.9 |
| C | 14 | 234 | 115158 | 720.68 | 684 | 689 | 158.8 |
| C | 13 | 61 | 5149 | 28.08 | 684 | 689 | 158.8 |
| C | 8 | 222 | 2697 | 12.64 | 684 | 689 | 158.8 |
| D | 1 | 52 | 1715294 | 10821.87 | 652 | 634 | 158.4 |
| D | 13 | 104 | 53003 | 330.52 | 652 | 634 | 158.4 |
| D | 13 | 249 | 40540 | 251.86 | 652 | 634 | 158.4 |
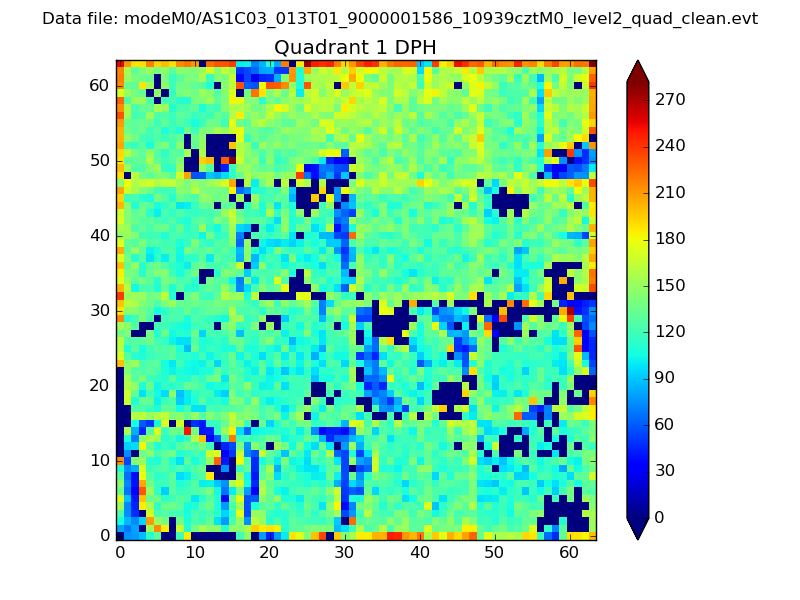
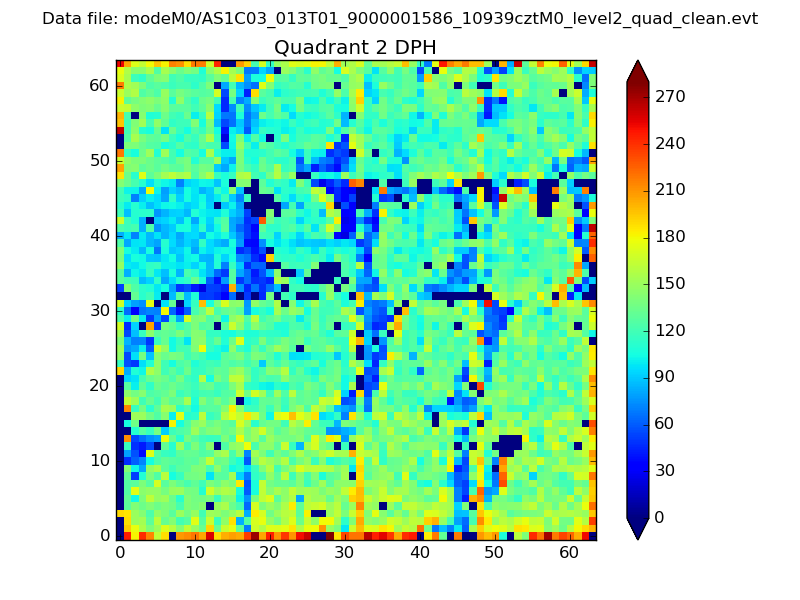
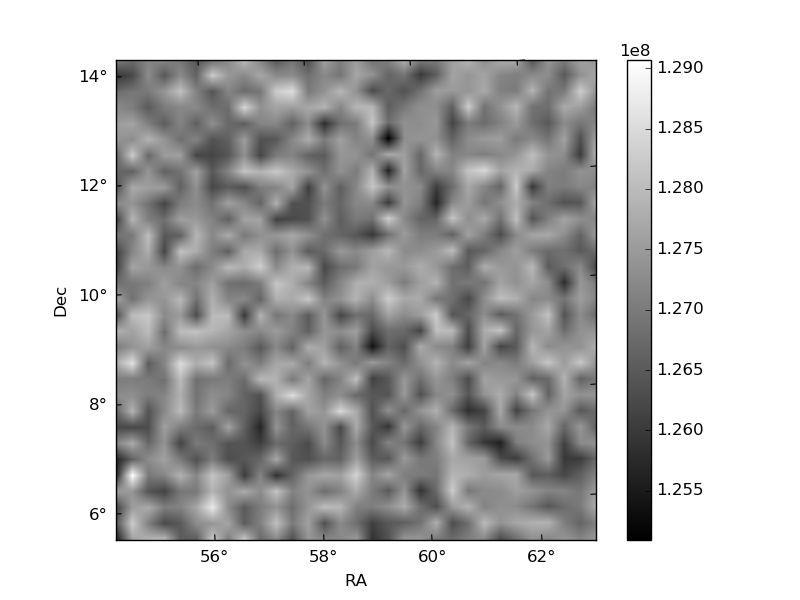
Histogram calculated using DETX and DETY for each event in the final _common_clean file
| Quadrant A |  |
 |
Quadrant B |
|---|---|---|---|
| Quadrant D | 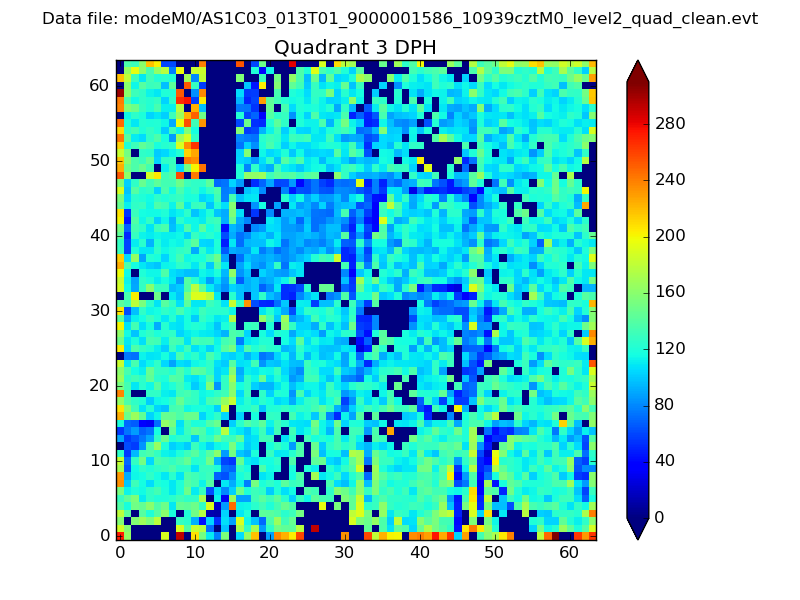 |
 |
Quadrant C |
| Plot type | Count rate plots | Images |
|---|---|---|
| Comparison with Poisson distribution Blue bars denote a histogram of data divided into 1 sec bins. Red curve is a Poisson curve with rate = median count rate of data. |
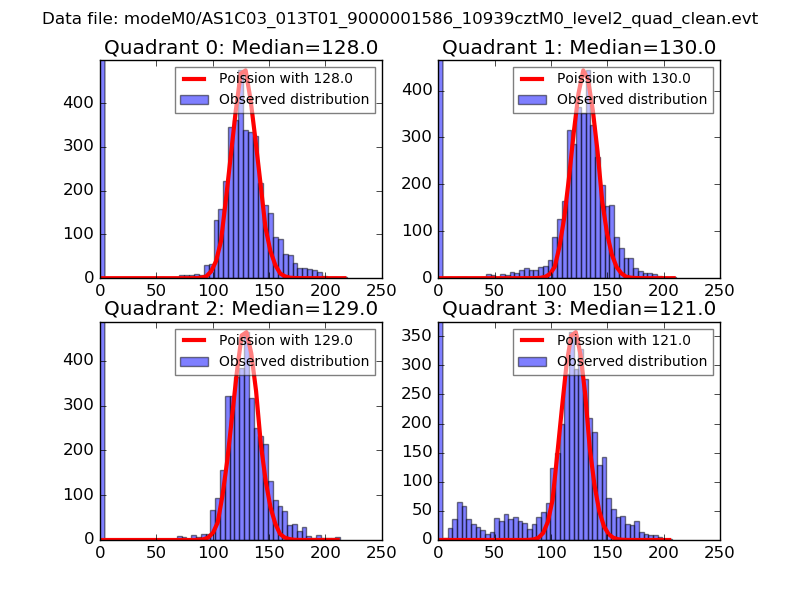 |
 |
| Quadrant-wise count rates Data is divided into 100 sec bins |
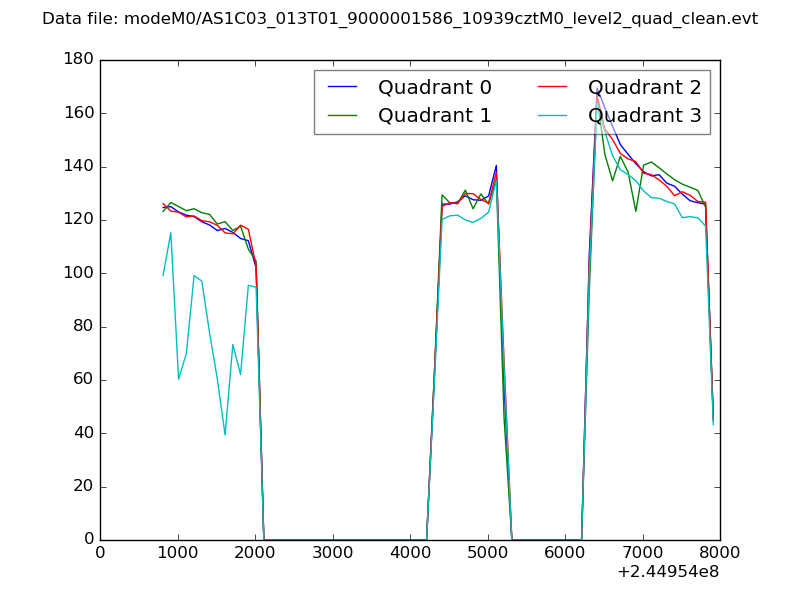 |
|
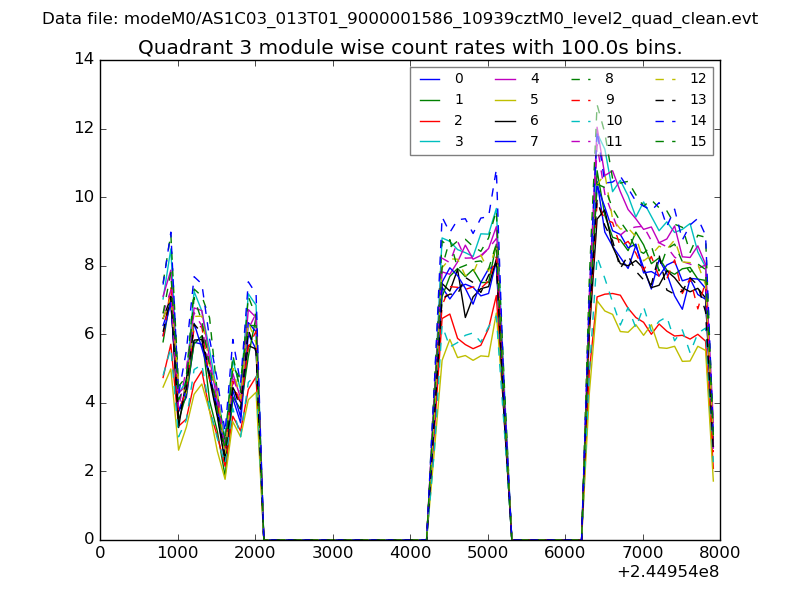
| Module-wise count rates for Quadrant A Data is divided into 100 sec bins |
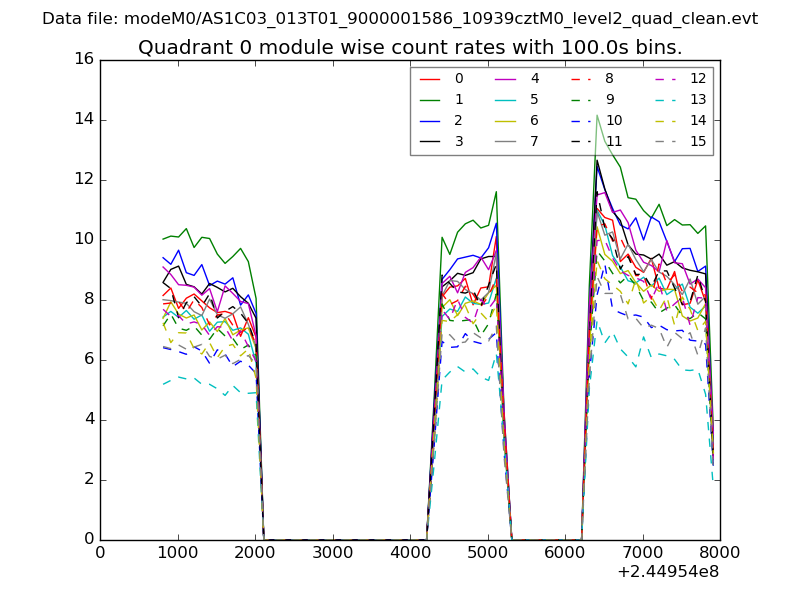 |
 |
| Module-wise count rates for Quadrant B Data is divided into 100 sec bins |
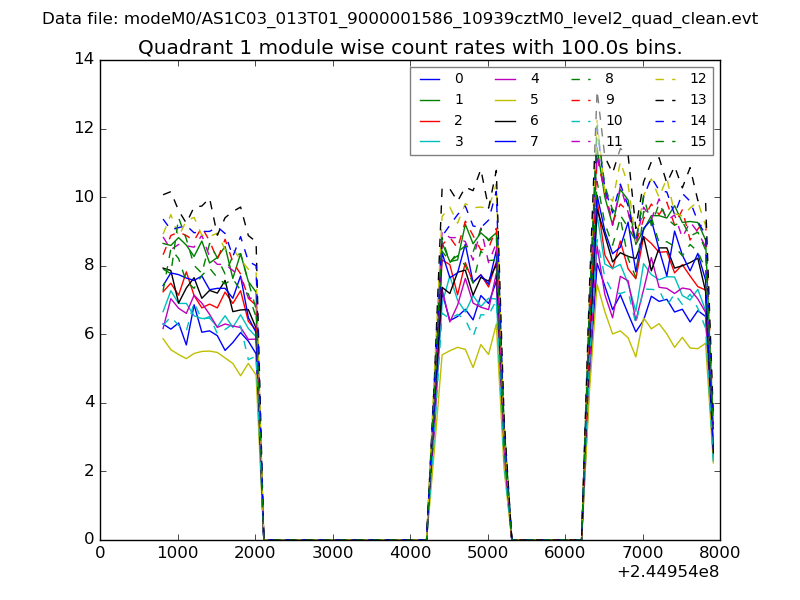 |
 |
| Module-wise count rates for Quadrant C Data is divided into 100 sec bins |
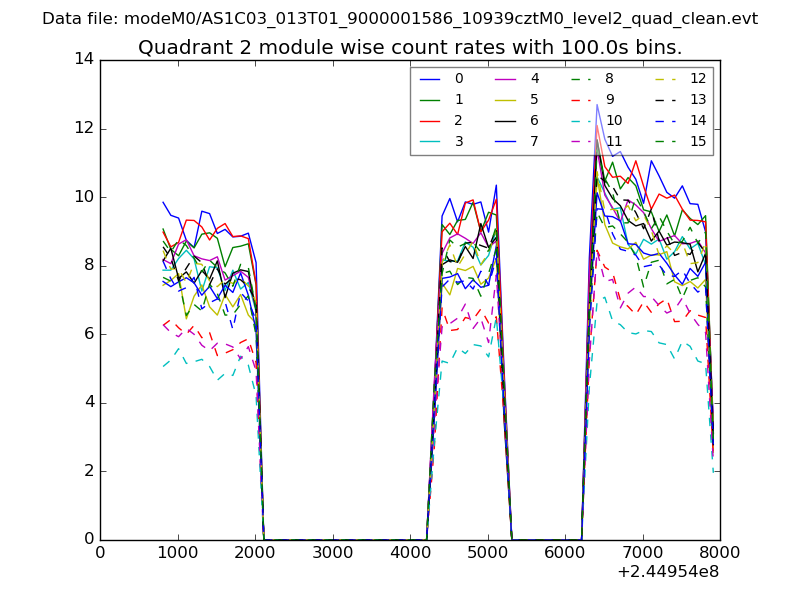 |
 |
| Module-wise count rates for Quadrant D Data is divided into 100 sec bins |
 |
 |
| Parameter | Plot |
|---|---|
| CZT HV Monitor | 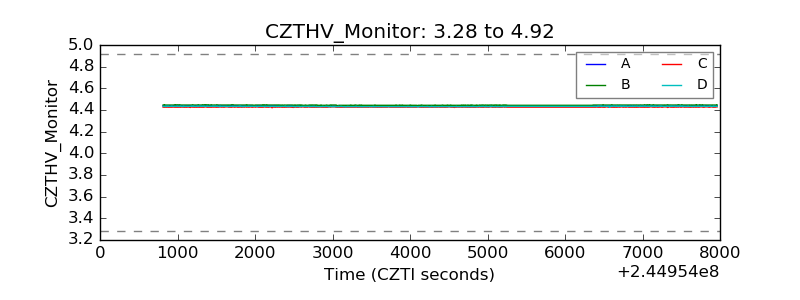 |
| D_VDD | 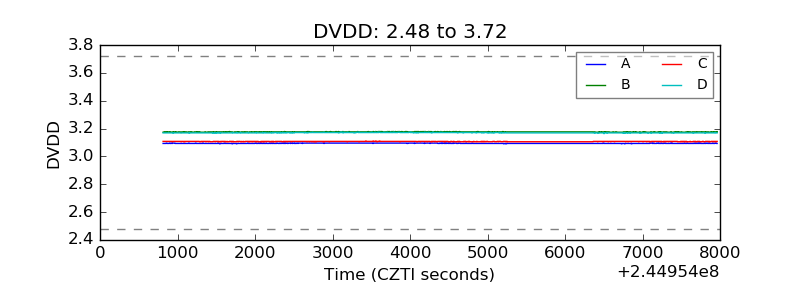 |
| Temperature 1 | 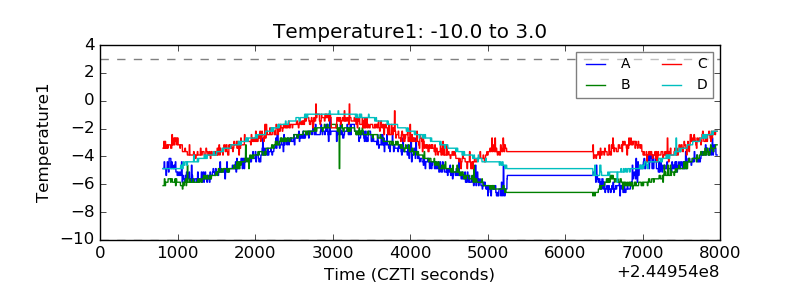 |
| Veto HV Monitor | 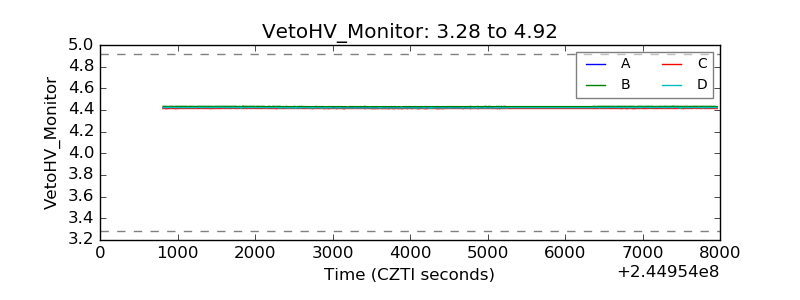 |
| Veto LLD | 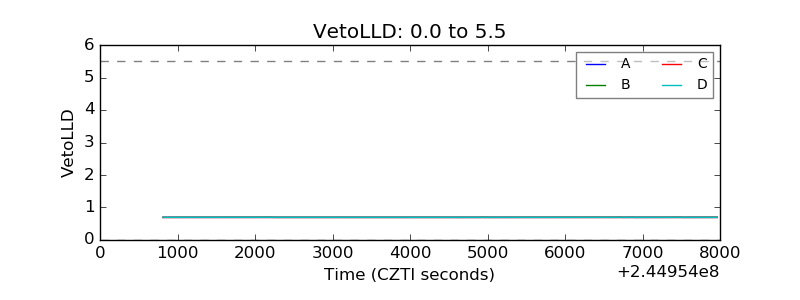 |
| Alpha Counter | 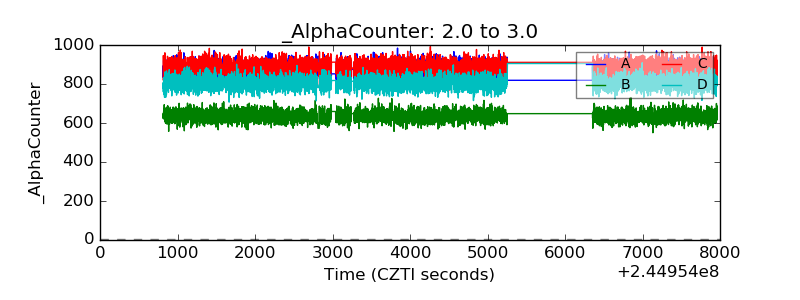 |
| _CPM_Rate | 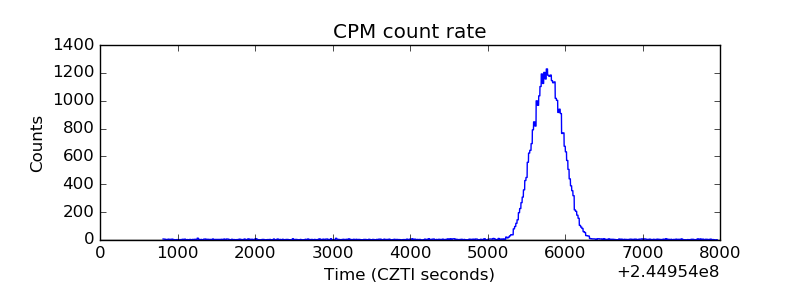 |
| CZT Counter | 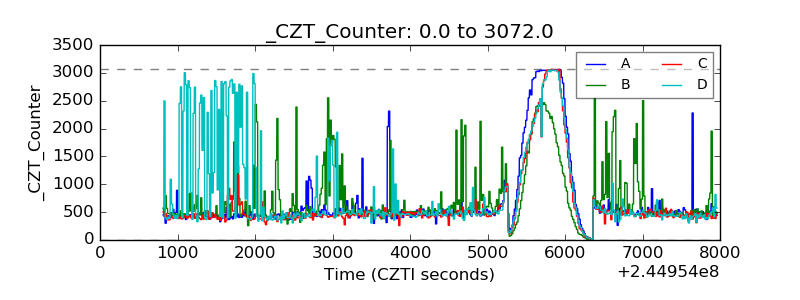 |
| +2.5 Volts monitor |  |
| +5 Volts monitor | 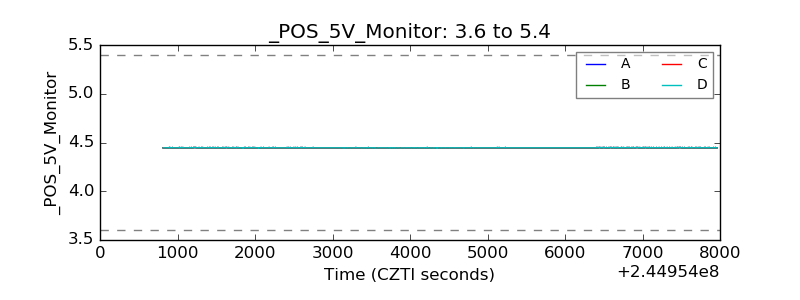 |
| _ROLL_ROT | 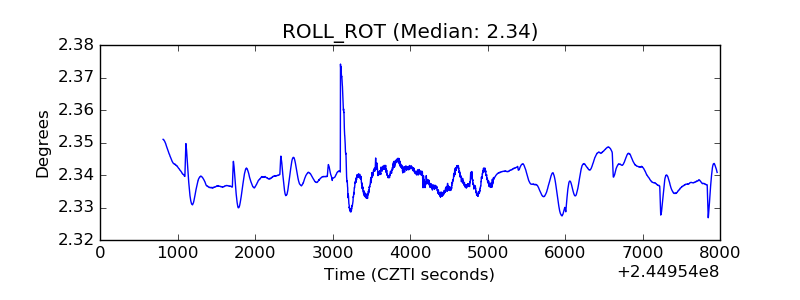 |
| _Roll_DEC | 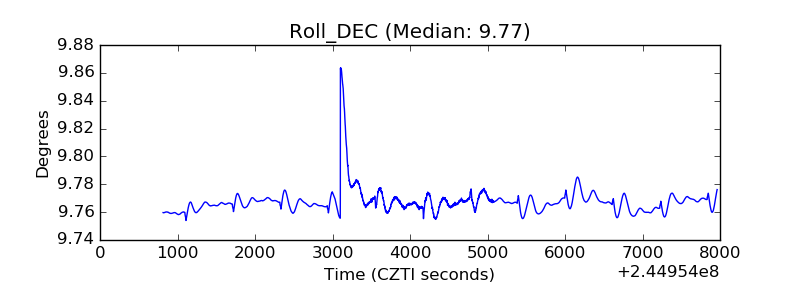 |
| _Roll_RA |  |
| Veto Counter | 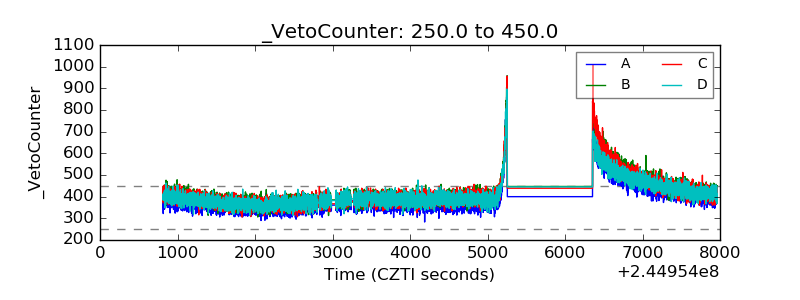 |