| Param | Original file | Final file |
|---|---|---|
| Filename | modeM0/AS1C03_013T01_9000001586_10940cztM0_level2.evt | modeM0/AS1C03_013T01_9000001586_10940cztM0_level2_quad_clean.evt |
| Size (bytes) | 445,484,160 | 71,262,720 |
| Size | 424.8 MB | 68.0 MB |
| Events in quadrant A | 3,108,616 | 446,283 |
| Events in quadrant B | 4,126,501 | 441,834 |
| Events in quadrant C | 2,712,410 | 444,197 |
| Events in quadrant D | 3,152,554 | 422,601 |
| Mode M0 | |||
|---|---|---|---|
| Quadrant | BADHDUFLAG | Total packets | Discarded packets |
| A | 0 | 12755 | 2 |
| B | 0 | 15945 | 1 |
| C | 0 | 11751 | 1 |
| D | 0 | 13113 | 1 |
| Mode M9 | |||
|---|---|---|---|
| Quadrant | BADHDUFLAG | Total packets | Discarded packets |
| A | 0 | 12 | 0 |
| B | 0 | 12 | 0 |
| C | 0 | 12 | 0 |
| D | 0 | 12 | 0 |
| Mode SS | |||
|---|---|---|---|
| Quadrant | BADHDUFLAG | Total packets | Discarded packets |
| A | 0 | 118 | 0 |
| B | 0 | 118 | 0 |
| C | 0 | 118 | 0 |
| D | 0 | 118 | 0 |
| Quadrant | Total seconds | Saturated seconds | Saturation percentage |
|---|---|---|---|
| A | 5759 | 81 | 1.406494% |
| B | 5759 | 368 | 6.389998% |
| C | 5759 | 28 | 0.486196% |
| D | 5759 | 62 | 1.076576% |
Noise dominated data is calculated using 1-second bins in cleaned event files. If a bin has >2000 counts, and if more than 50% of those come from <1% of pixels, then it is considered to be noise-dominated and hence unusable.
| Quadrant | # 1 sec bins | Bins with >0 counts | Bins with >2000 counts | High rate bins dominated by noise | Noise dominated (total time) | Noise dominated (detector-on time) | Marked lightcurve |
|---|---|---|---|---|---|---|---|
| A | 6939 | 5759 | 19 | 19 | 0.27% | 0.33% | 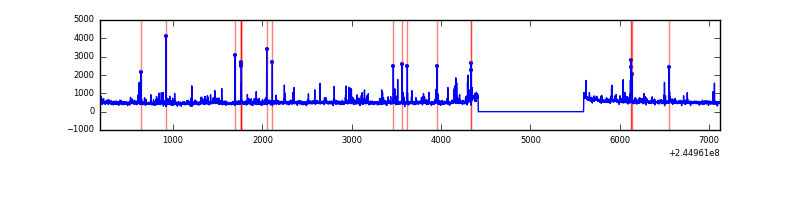 |
| B | 6939 | 5760 | 224 | 224 | 3.23% | 3.89% | 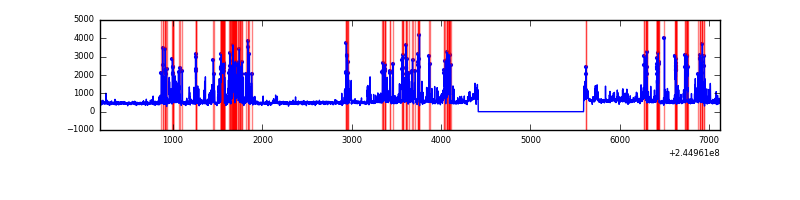 |
| C | 6939 | 5760 | 0 | 0 | 0.00% | 0.00% |  |
| D | 6939 | 5760 | 24 | 24 | 0.35% | 0.42% | 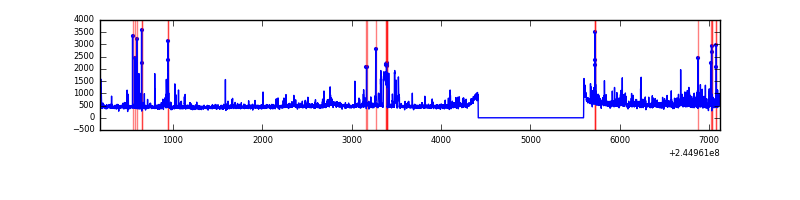 |
Top three noisy pixels from each quadrant. If the there are fewer than three noisy pixels in the level2.evt file, extra rows are filled as -1
| Pixel properties | Quadrant properties | ||||||
|---|---|---|---|---|---|---|---|
| Quadrant | DetID | PixID | Counts | Sigma | Mean | Median | Sigma |
| A | 8 | 5 | 269409 | 1830.13 | 724 | 708 | 146.8 |
| A | 15 | 174 | 31832 | 211.99 | 724 | 708 | 146.8 |
| A | 11 | 29 | 8997 | 56.46 | 724 | 708 | 146.8 |
| B | 4 | 239 | 1238488 | 9201.62 | 705 | 690 | 134.5 |
| B | 0 | 214 | 35227 | 256.74 | 705 | 690 | 134.5 |
| B | 11 | 51 | 35082 | 255.67 | 705 | 690 | 134.5 |
| C | 13 | 61 | 5029 | 26.76 | 695 | 698 | 161.8 |
| C | 8 | 222 | 2735 | 12.58 | 695 | 698 | 161.8 |
| C | 3 | 202 | 1682 | 6.08 | 695 | 698 | 161.8 |
| D | 1 | 52 | 351872 | 2085.26 | 698 | 677 | 168.4 |
| D | 5 | 97 | 37554 | 218.96 | 698 | 677 | 168.4 |
| D | 13 | 249 | 26188 | 151.47 | 698 | 677 | 168.4 |
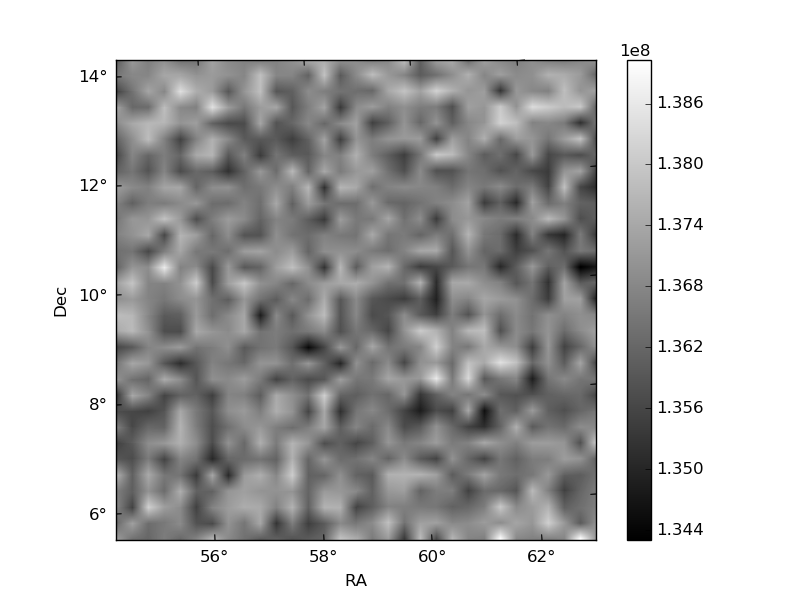
Histogram calculated using DETX and DETY for each event in the final _common_clean file
| Quadrant A | 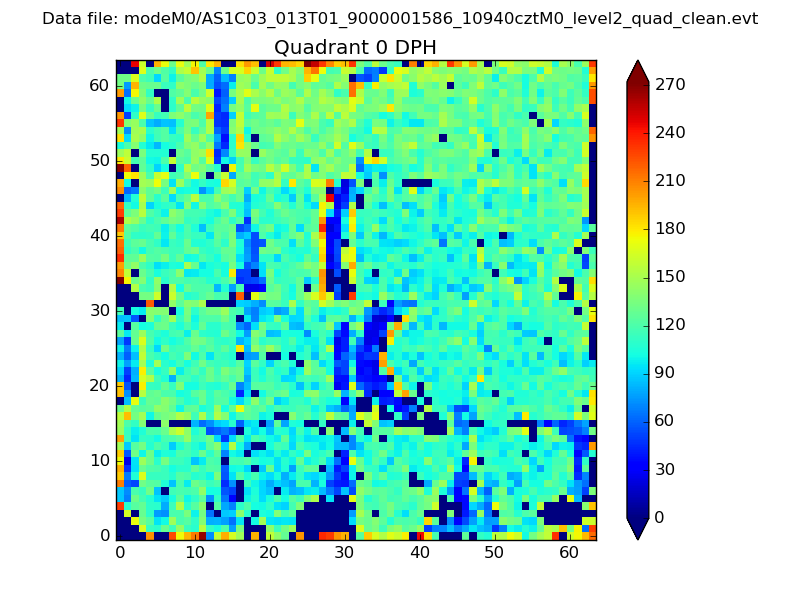 |
 |
Quadrant B |
|---|---|---|---|
| Quadrant D |  |
 |
Quadrant C |
| Plot type | Count rate plots | Images |
|---|---|---|
| Comparison with Poisson distribution Blue bars denote a histogram of data divided into 1 sec bins. Red curve is a Poisson curve with rate = median count rate of data. |
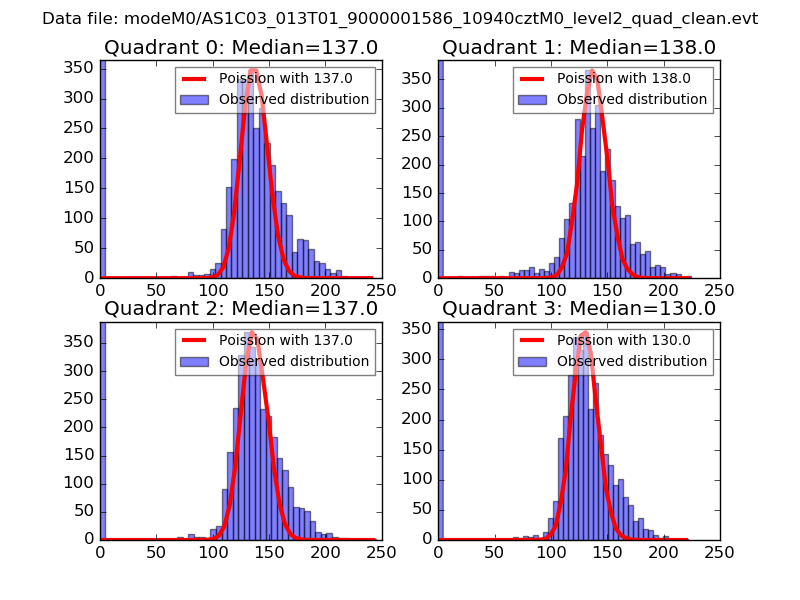 |
 |
| Quadrant-wise count rates Data is divided into 100 sec bins |
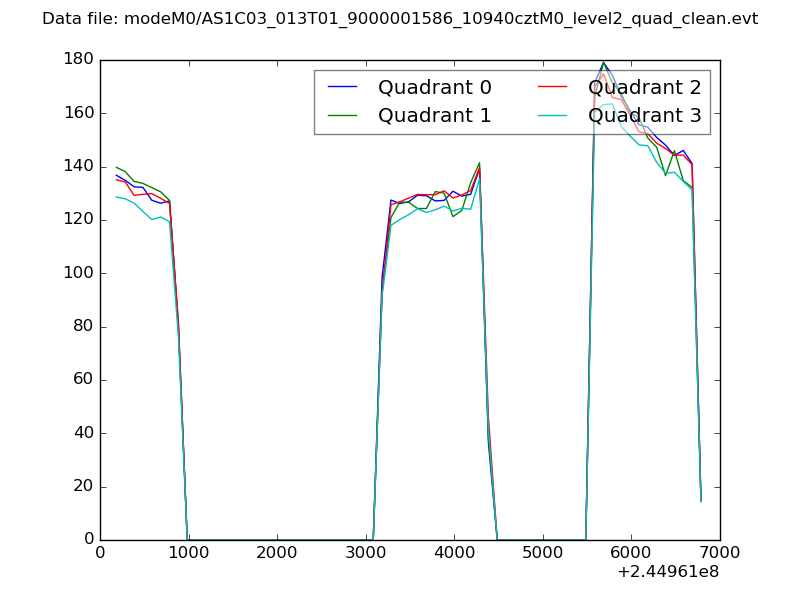 |
|
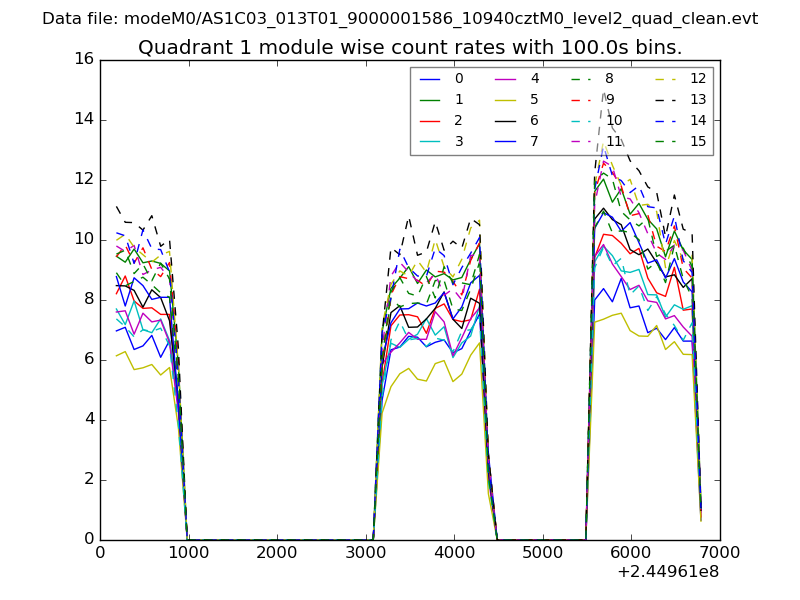
| Module-wise count rates for Quadrant A Data is divided into 100 sec bins |
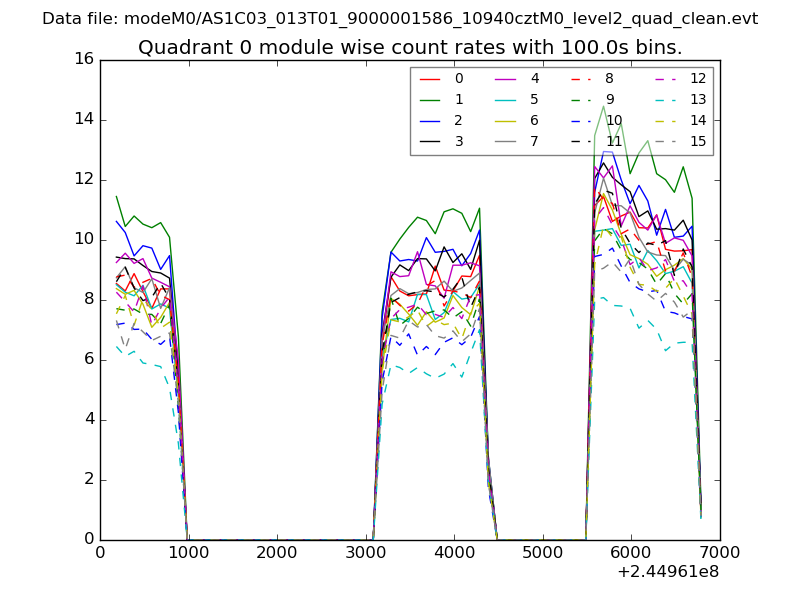 |
 |
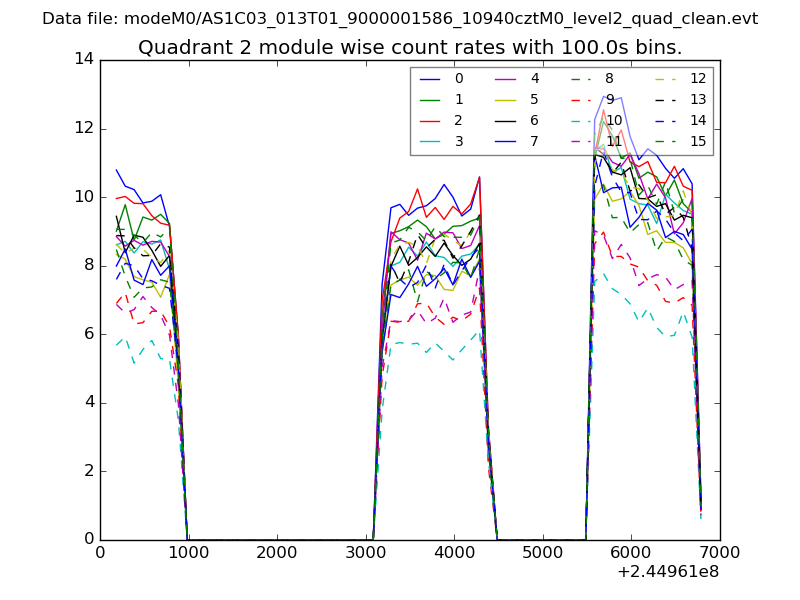
| Module-wise count rates for Quadrant B Data is divided into 100 sec bins |
 |
 |
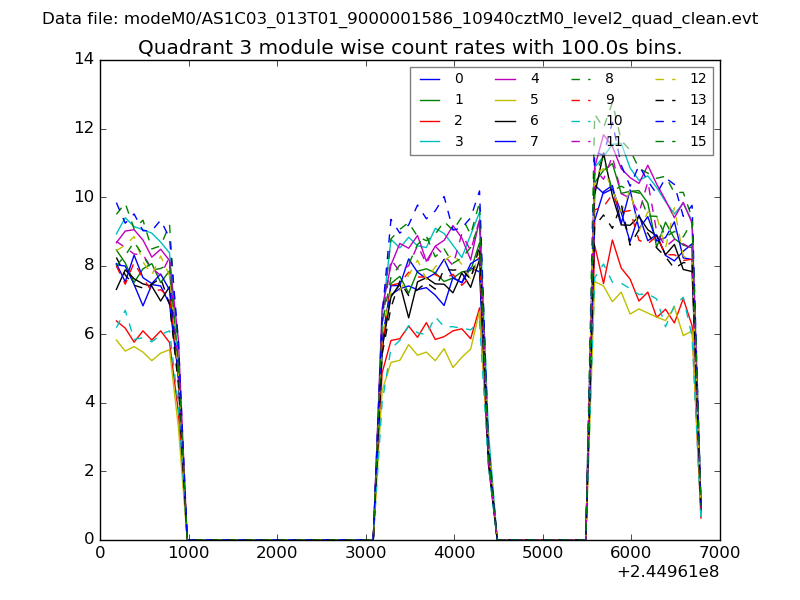
| Module-wise count rates for Quadrant C Data is divided into 100 sec bins |
 |
 |
| Module-wise count rates for Quadrant D Data is divided into 100 sec bins |
 |
 |
| Parameter | Plot |
|---|---|
| CZT HV Monitor | 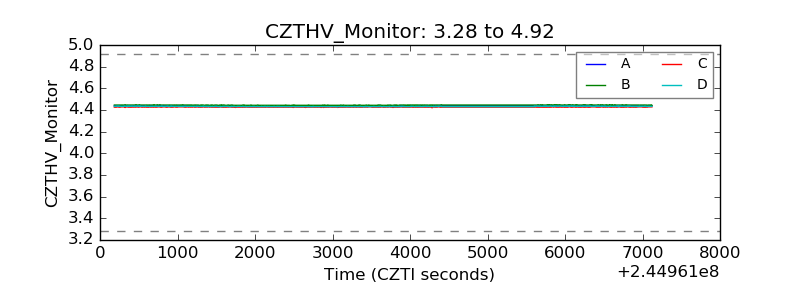 |
| D_VDD | 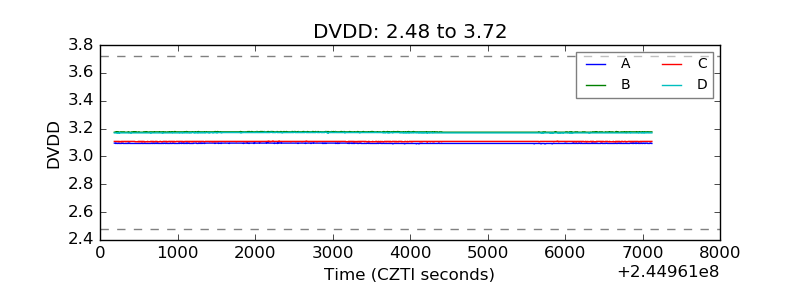 |
| Temperature 1 | 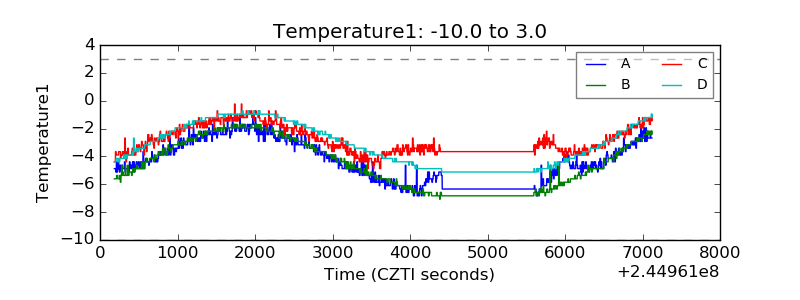 |
| Veto HV Monitor | 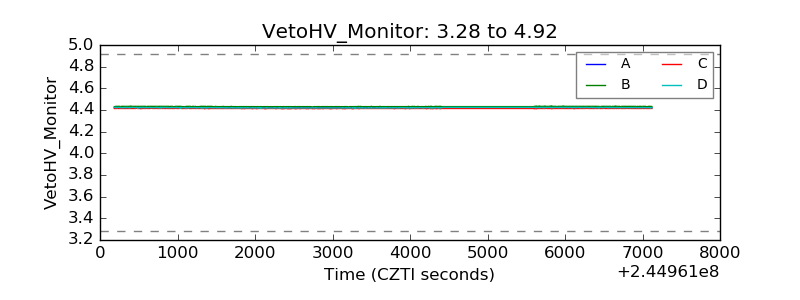 |
| Veto LLD | 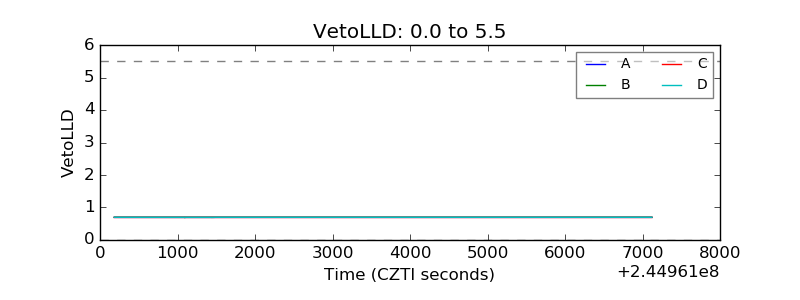 |
| Alpha Counter | 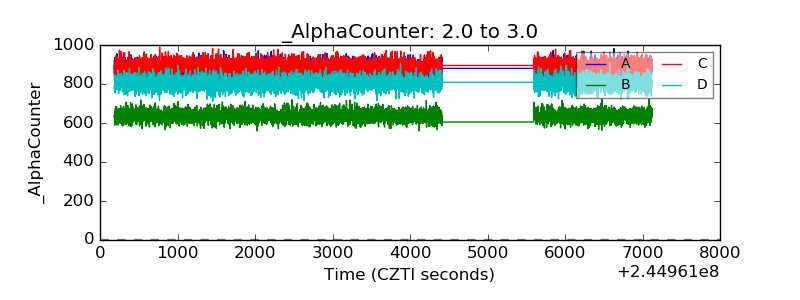 |
| _CPM_Rate | 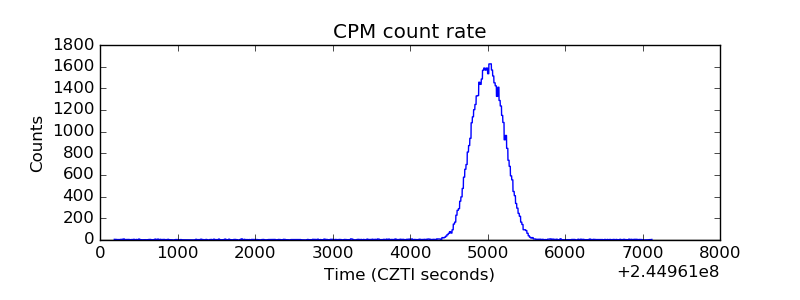 |
| CZT Counter |  |
| +2.5 Volts monitor |  |
| +5 Volts monitor | 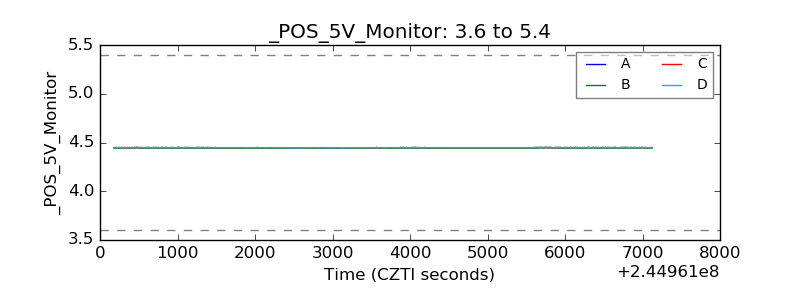 |
| _ROLL_ROT | 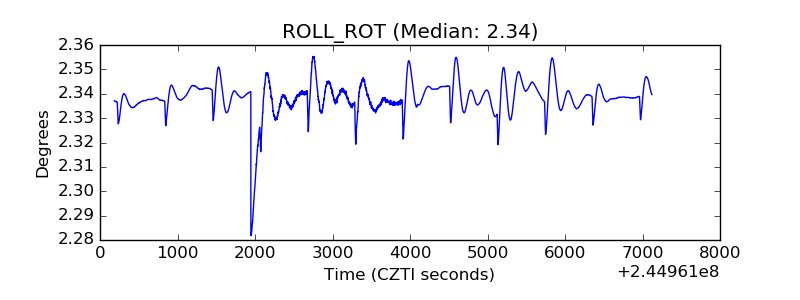 |
| _Roll_DEC | 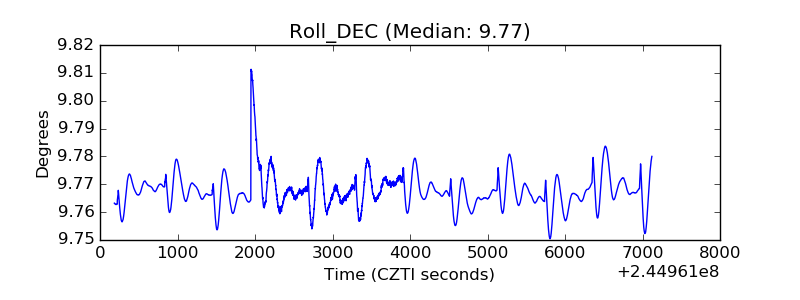 |
| _Roll_RA | 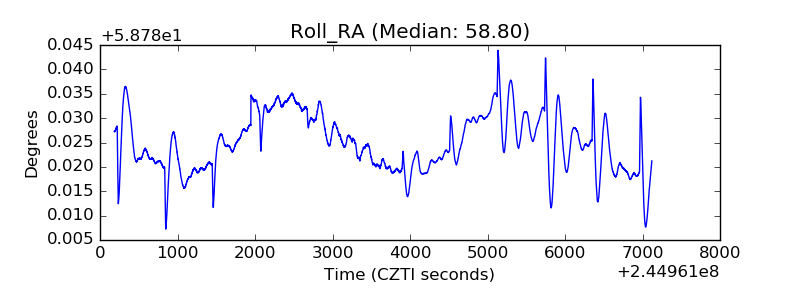 |
| Veto Counter | 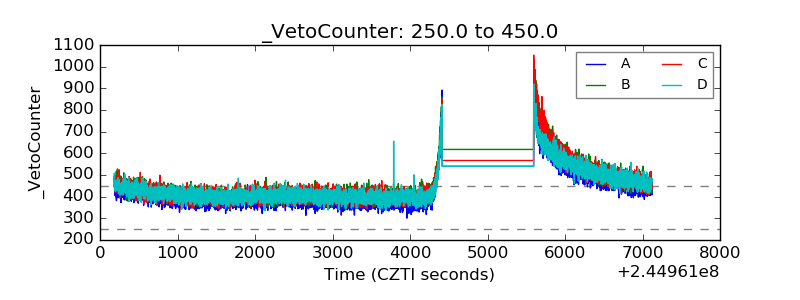 |