| Param | Original file | Final file |
|---|---|---|
| Filename | modeM0/AS1C03_013T01_9000001586_10941cztM0_level2.evt | modeM0/AS1C03_013T01_9000001586_10941cztM0_level2_quad_clean.evt |
| Size (bytes) | 519,920,640 | 75,657,600 |
| Size | 495.8 MB | 72.2 MB |
| Events in quadrant A | 3,485,986 | 478,082 |
| Events in quadrant B | 4,369,411 | 471,272 |
| Events in quadrant C | 2,961,961 | 472,907 |
| Events in quadrant D | 4,517,398 | 445,034 |
| Mode M0 | |||
|---|---|---|---|
| Quadrant | BADHDUFLAG | Total packets | Discarded packets |
| A | 0 | 13989 | 4 |
| B | 0 | 16862 | 1 |
| C | 0 | 12447 | 1 |
| D | 0 | 17435 | 1 |
| Mode M9 | |||
|---|---|---|---|
| Quadrant | BADHDUFLAG | Total packets | Discarded packets |
| A | 0 | 13 | 0 |
| B | 0 | 13 | 0 |
| C | 0 | 13 | 0 |
| D | 0 | 13 | 0 |
| Mode SS | |||
|---|---|---|---|
| Quadrant | BADHDUFLAG | Total packets | Discarded packets |
| A | 0 | 124 | 0 |
| B | 0 | 124 | 0 |
| C | 0 | 124 | 0 |
| D | 0 | 124 | 0 |
| Quadrant | Total seconds | Saturated seconds | Saturation percentage |
|---|---|---|---|
| A | 6062 | 112 | 1.847575% |
| B | 6063 | 337 | 5.558304% |
| C | 6063 | 20 | 0.329870% |
| D | 6063 | 163 | 2.688438% |
Noise dominated data is calculated using 1-second bins in cleaned event files. If a bin has >2000 counts, and if more than 50% of those come from <1% of pixels, then it is considered to be noise-dominated and hence unusable.
| Quadrant | # 1 sec bins | Bins with >0 counts | Bins with >2000 counts | High rate bins dominated by noise | Noise dominated (total time) | Noise dominated (detector-on time) | Marked lightcurve |
|---|---|---|---|---|---|---|---|
| A | 7338 | 6064 | 56 | 56 | 0.76% | 0.92% | 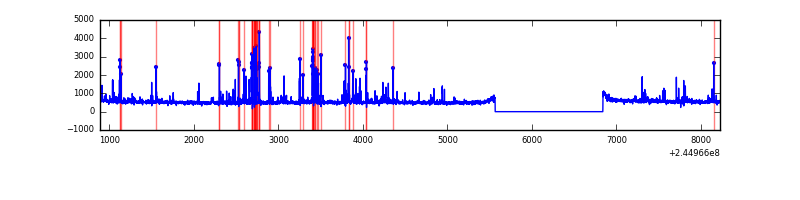 |
| B | 7338 | 6064 | 204 | 204 | 2.78% | 3.36% | 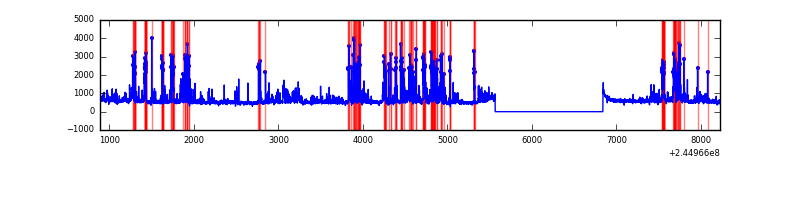 |
| C | 7338 | 6064 | 0 | 0 | 0.00% | 0.00% | 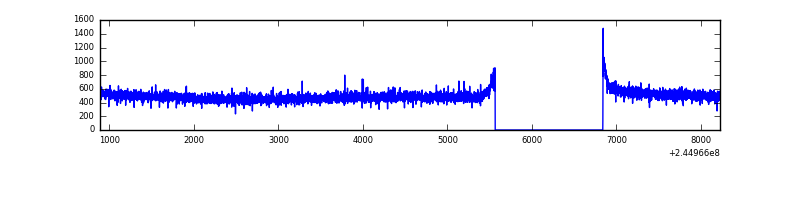 |
| D | 7338 | 6064 | 129 | 129 | 1.76% | 2.13% | 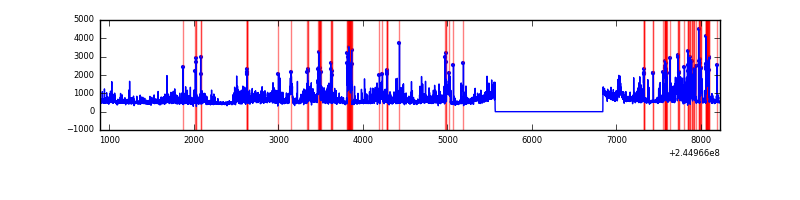 |
Top three noisy pixels from each quadrant. If the there are fewer than three noisy pixels in the level2.evt file, extra rows are filled as -1
| Pixel properties | Quadrant properties | ||||||
|---|---|---|---|---|---|---|---|
| Quadrant | DetID | PixID | Counts | Sigma | Mean | Median | Sigma |
| A | 8 | 5 | 377692 | 2366.4 | 790 | 776 | 159.3 |
| A | 8 | 15 | 18639 | 112.15 | 790 | 776 | 159.3 |
| A | 11 | 29 | 12474 | 73.44 | 790 | 776 | 159.3 |
| B | 4 | 239 | 1221851 | 8410.91 | 773 | 757 | 145.2 |
| B | 0 | 214 | 48678 | 330.08 | 773 | 757 | 145.2 |
| B | 3 | 189 | 33282 | 224.03 | 773 | 757 | 145.2 |
| C | 13 | 61 | 5616 | 27.9 | 759 | 762 | 174.0 |
| C | 8 | 222 | 2003 | 7.13 | 759 | 762 | 174.0 |
| C | 3 | 202 | 1988 | 7.04 | 759 | 762 | 174.0 |
| D | 1 | 52 | 1365601 | 7545.83 | 759 | 739 | 180.9 |
| D | 5 | 222 | 104826 | 575.46 | 759 | 739 | 180.9 |
| D | 5 | 97 | 36055 | 195.25 | 759 | 739 | 180.9 |
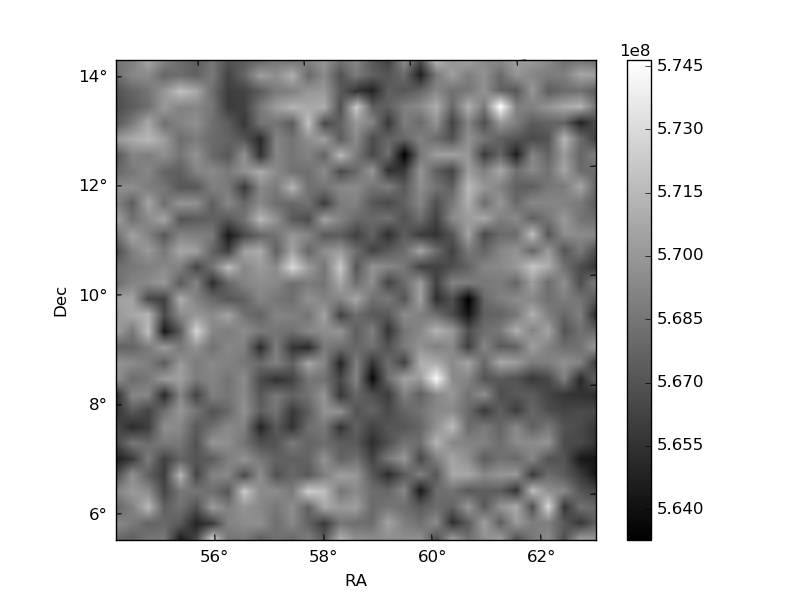
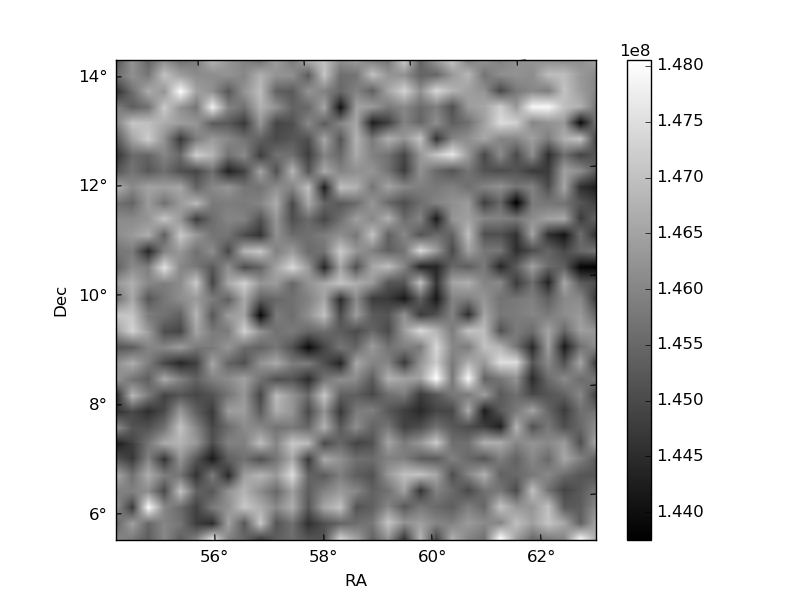
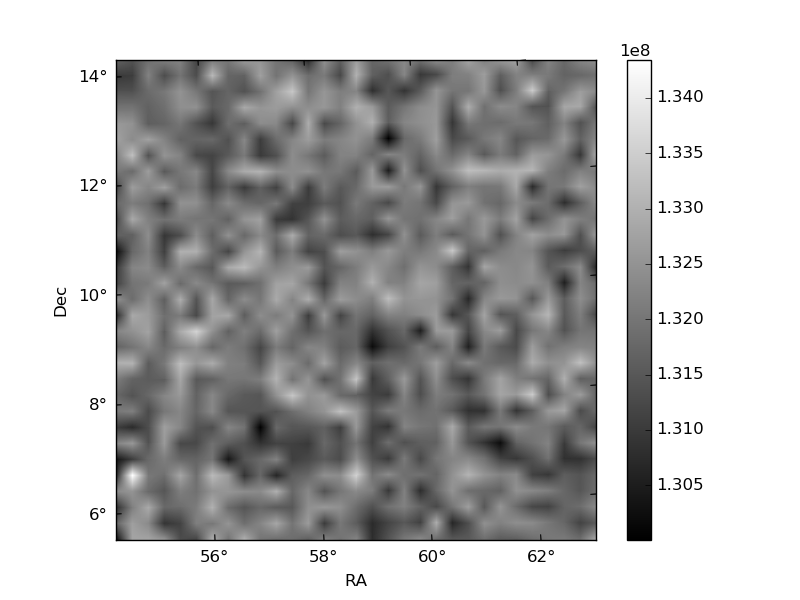
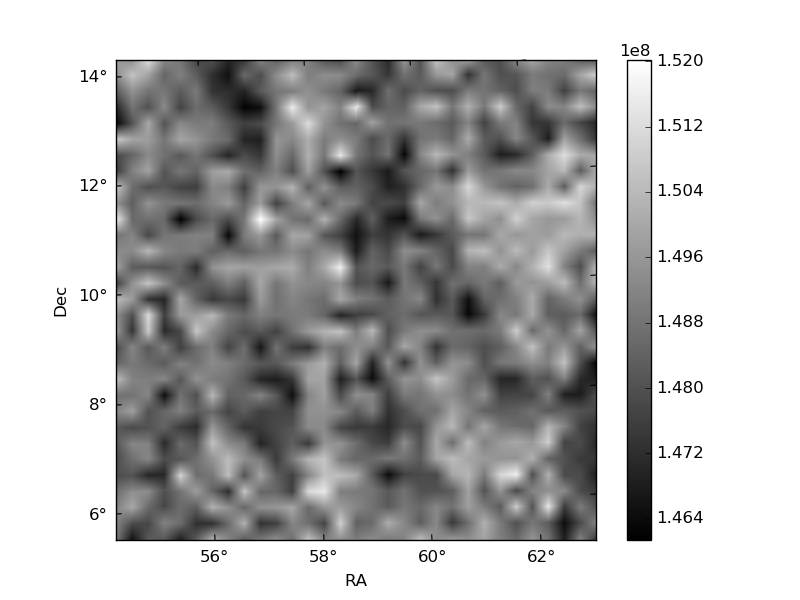
Histogram calculated using DETX and DETY for each event in the final _common_clean file
| Quadrant A | 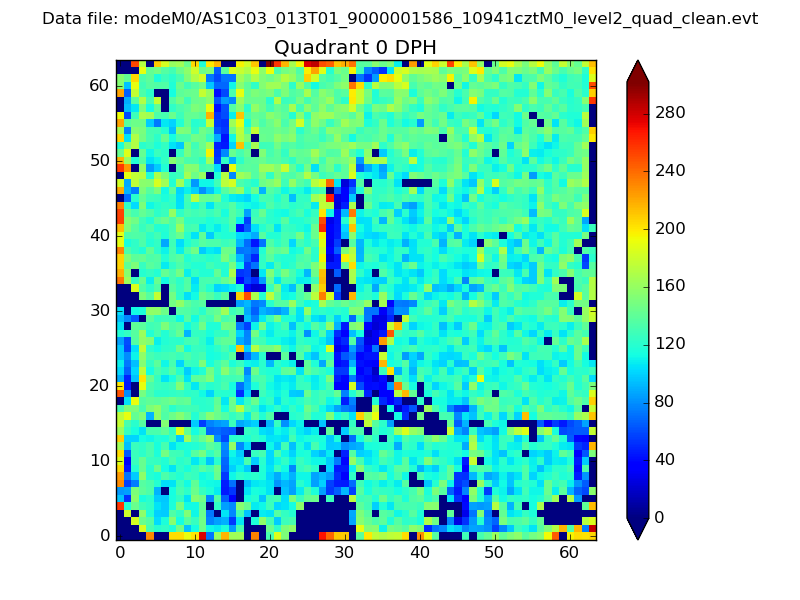 |
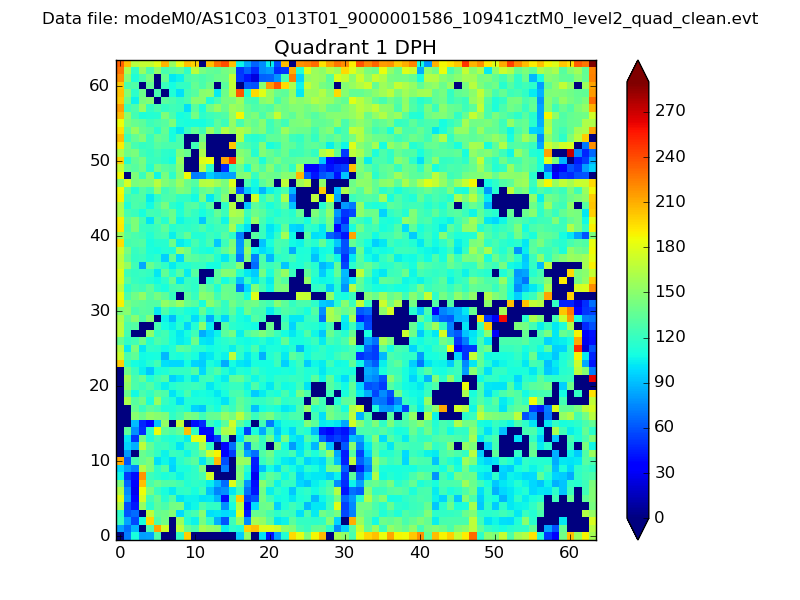 |
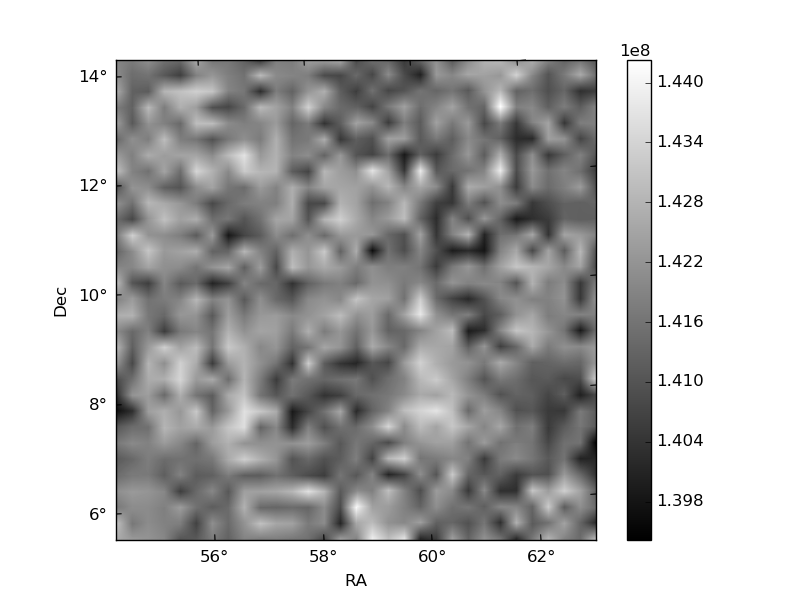
Quadrant B |
|---|---|---|---|
| Quadrant D | 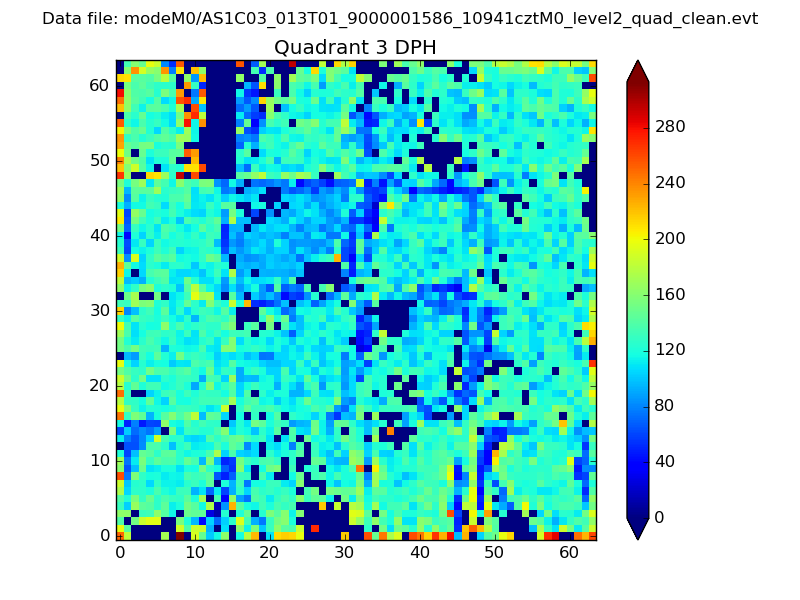 |
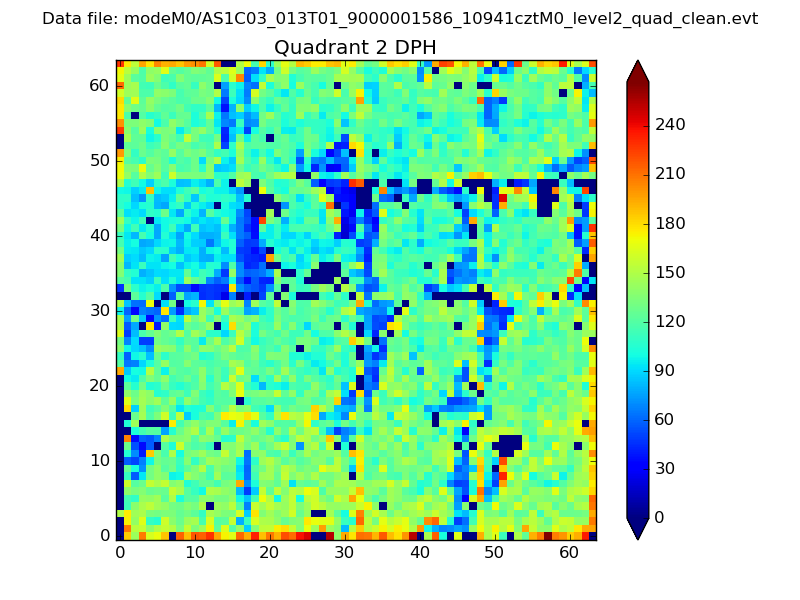 |
Quadrant C |
| Plot type | Count rate plots | Images |
|---|---|---|
| Comparison with Poisson distribution Blue bars denote a histogram of data divided into 1 sec bins. Red curve is a Poisson curve with rate = median count rate of data. |
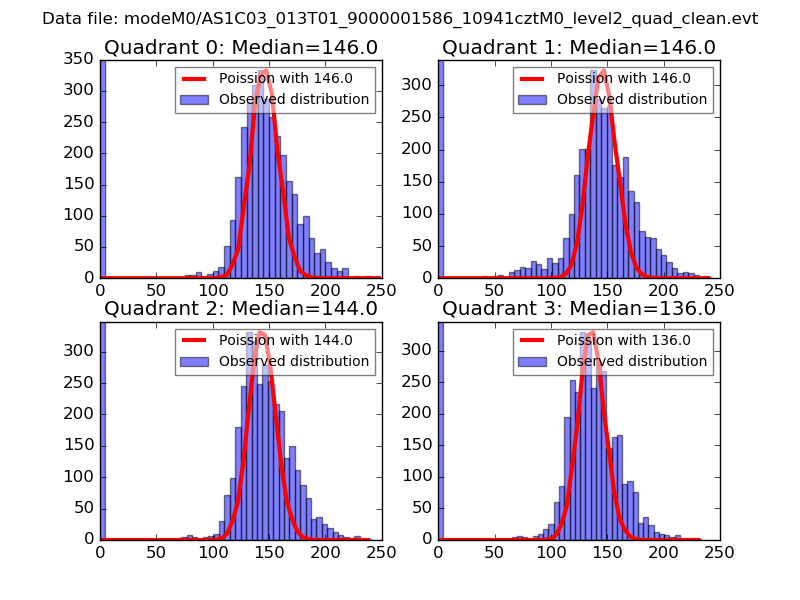 |
 |
| Quadrant-wise count rates Data is divided into 100 sec bins |
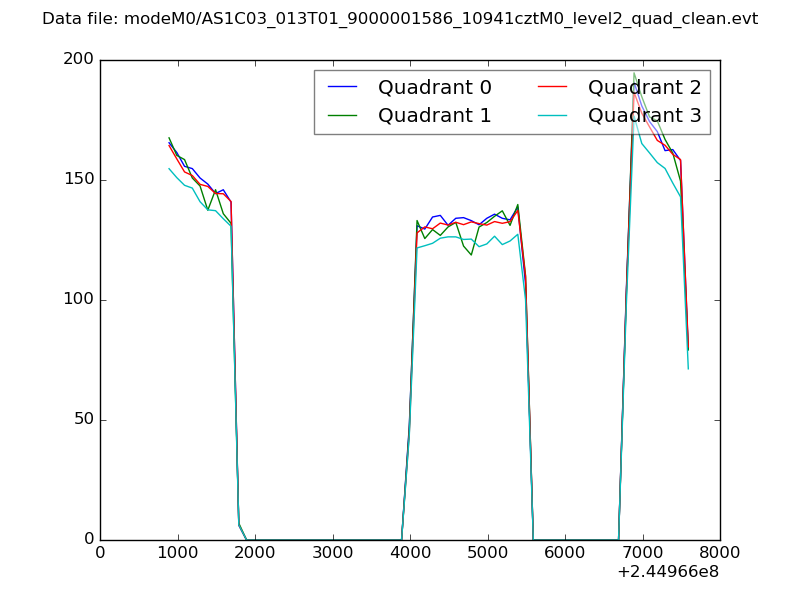 |
|
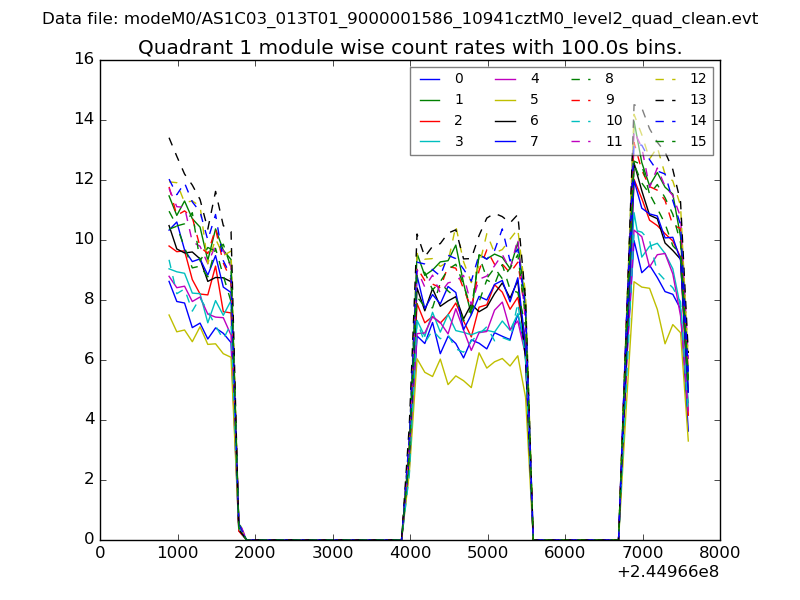
| Module-wise count rates for Quadrant A Data is divided into 100 sec bins |
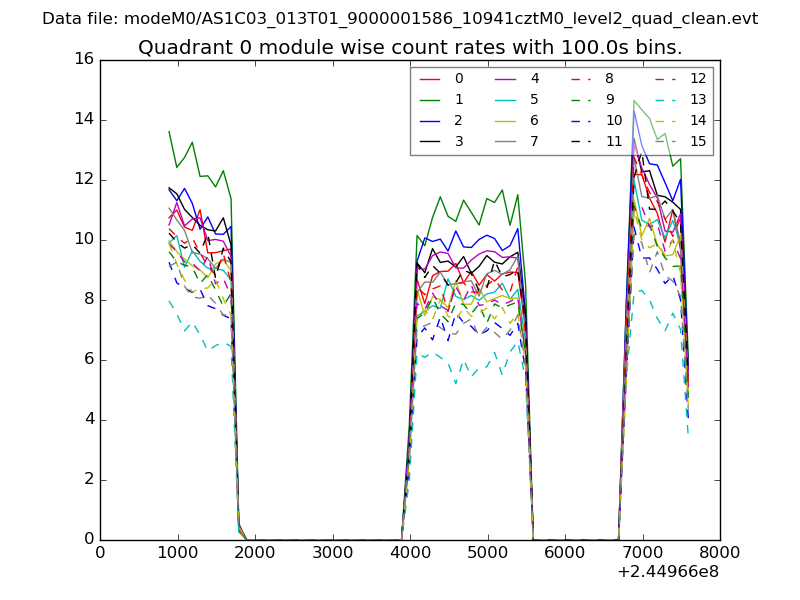 |
 |
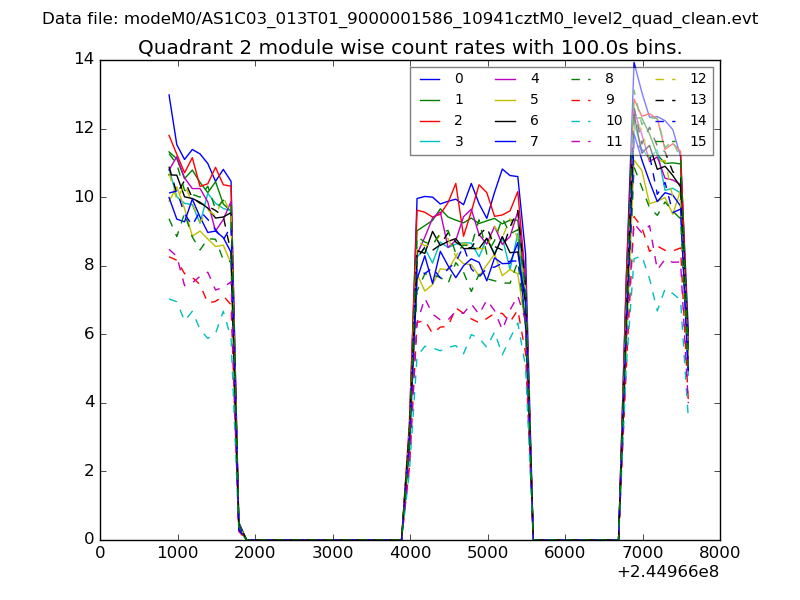
| Module-wise count rates for Quadrant B Data is divided into 100 sec bins |
 |
 |
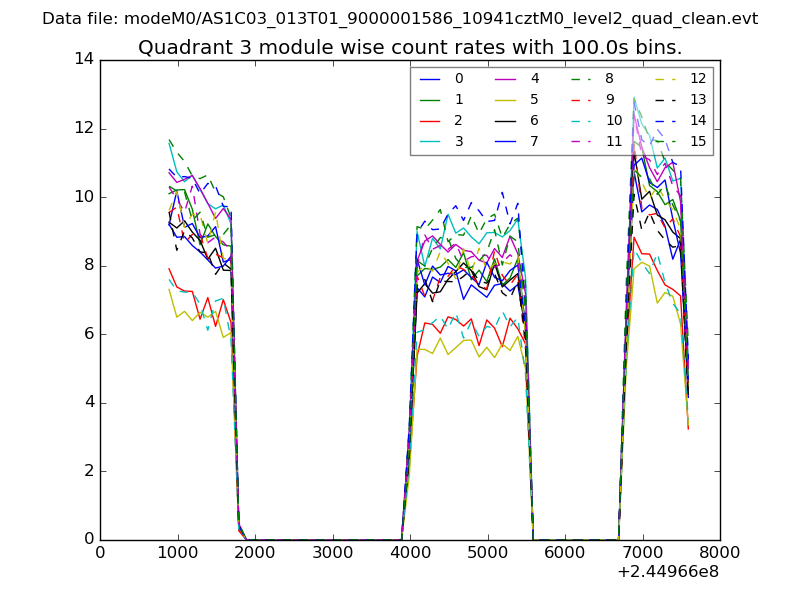
| Module-wise count rates for Quadrant C Data is divided into 100 sec bins |
 |
 |
| Module-wise count rates for Quadrant D Data is divided into 100 sec bins |
 |
 |
| Parameter | Plot |
|---|---|
| CZT HV Monitor | 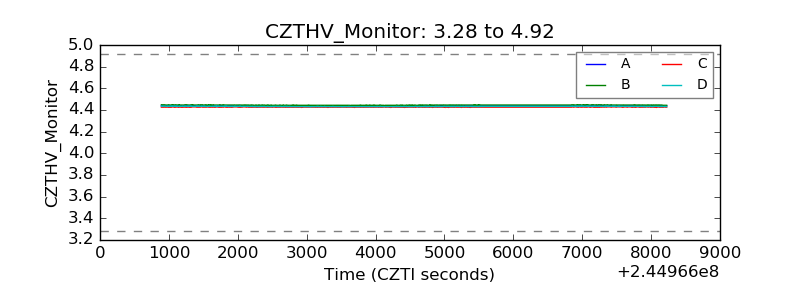 |
| D_VDD | 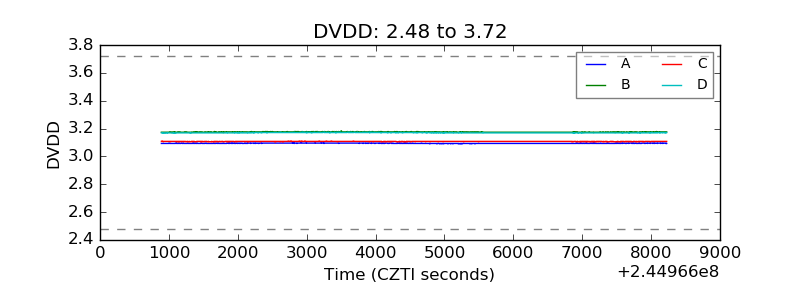 |
| Temperature 1 | 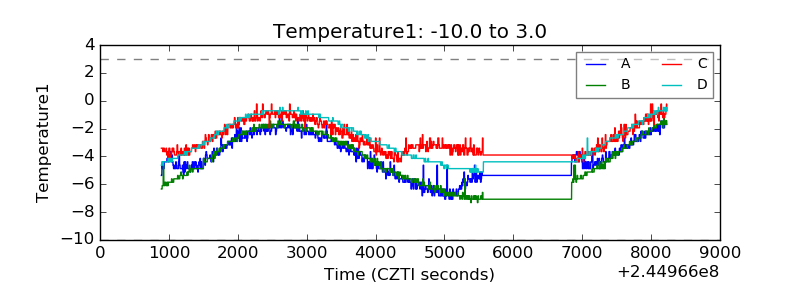 |
| Veto HV Monitor |  |
| Veto LLD | 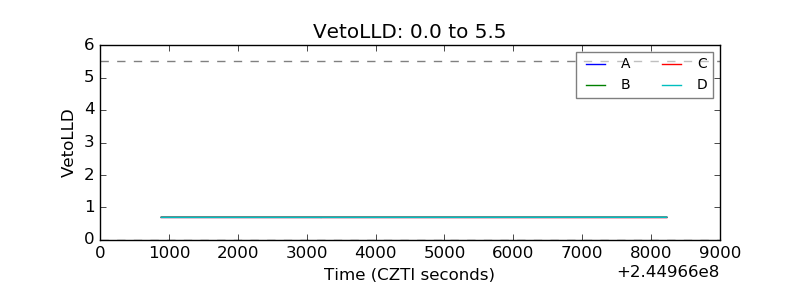 |
| Alpha Counter | 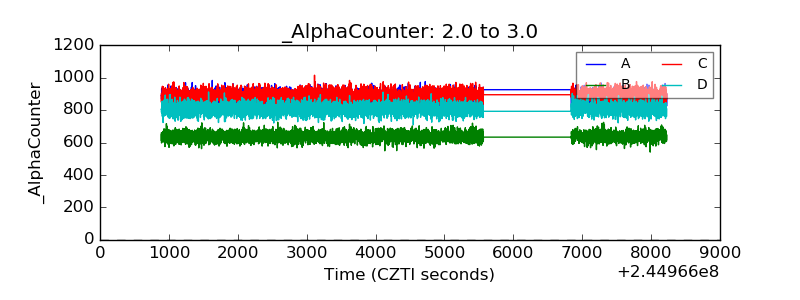 |
| _CPM_Rate | 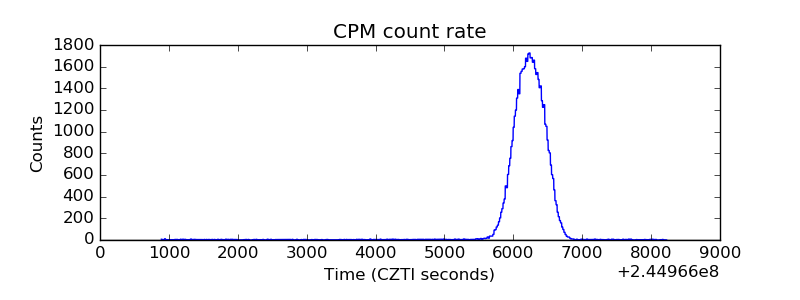 |
| CZT Counter | 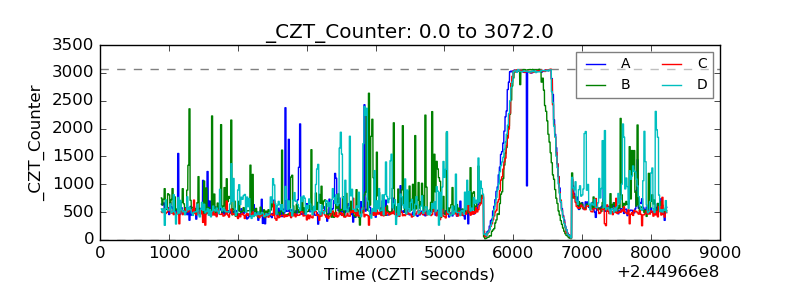 |
| +2.5 Volts monitor |  |
| +5 Volts monitor |  |
| _ROLL_ROT | 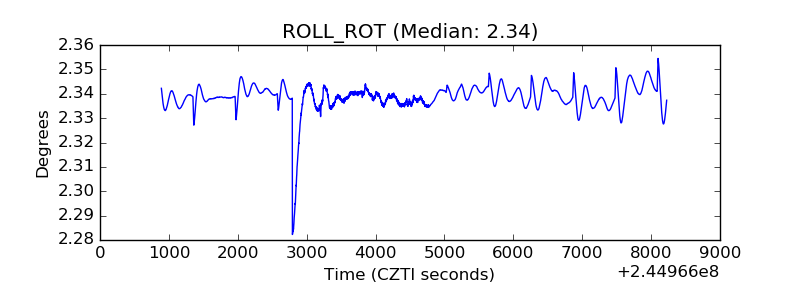 |
| _Roll_DEC | 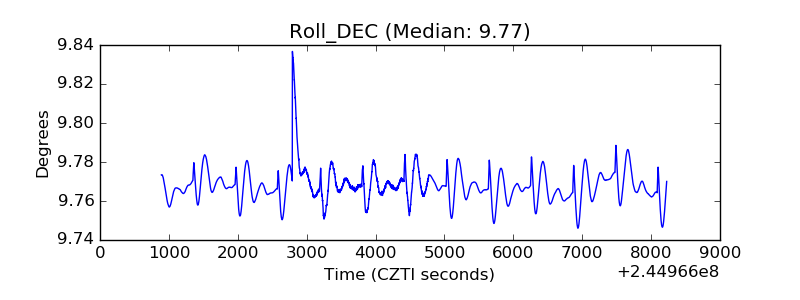 |
| _Roll_RA | 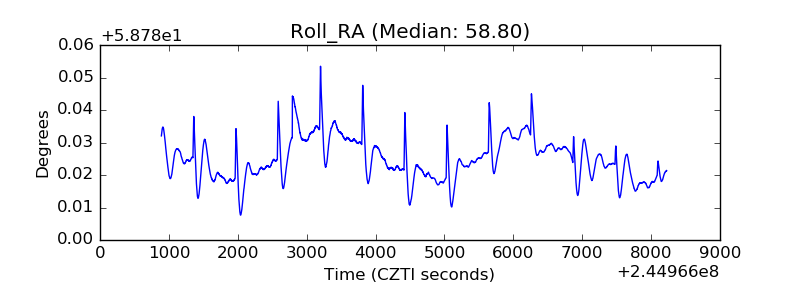 |
| Veto Counter | 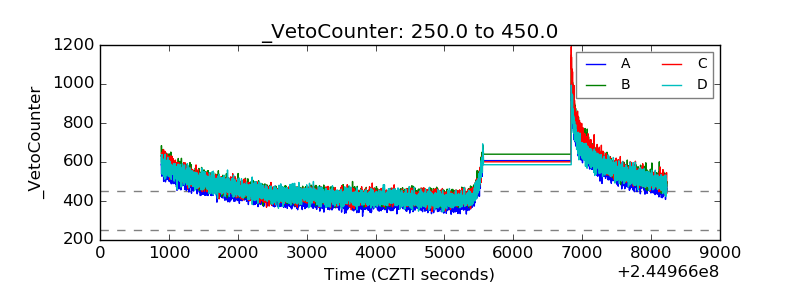 |