| Param | Original file | Final file |
|---|---|---|
| Filename | modeM0/AS1C03_013T01_9000001586_10942cztM0_level2.evt | modeM0/AS1C03_013T01_9000001586_10942cztM0_level2_quad_clean.evt |
| Size (bytes) | 552,579,840 | 62,066,880 |
| Size | 527.0 MB | 59.2 MB |
| Events in quadrant A | 3,464,834 | 375,350 |
| Events in quadrant B | 4,707,498 | 366,081 |
| Events in quadrant C | 3,055,174 | 374,409 |
| Events in quadrant D | 5,088,404 | 331,559 |
| Mode M0 | |||
|---|---|---|---|
| Quadrant | BADHDUFLAG | Total packets | Discarded packets |
| A | 0 | 13927 | 2 |
| B | 0 | 17903 | 1 |
| C | 0 | 12726 | 1 |
| D | 0 | 19002 | 1 |
| Mode M9 | |||
|---|---|---|---|
| Quadrant | BADHDUFLAG | Total packets | Discarded packets |
| A | 0 | 14 | 0 |
| B | 0 | 14 | 0 |
| C | 0 | 14 | 0 |
| D | 0 | 14 | 0 |
| Mode SS | |||
|---|---|---|---|
| Quadrant | BADHDUFLAG | Total packets | Discarded packets |
| A | 0 | 124 | 0 |
| B | 0 | 124 | 0 |
| C | 0 | 124 | 0 |
| D | 0 | 124 | 0 |
| Quadrant | Total seconds | Saturated seconds | Saturation percentage |
|---|---|---|---|
| A | 6187 | 99 | 1.600129% |
| B | 6187 | 474 | 7.661225% |
| C | 6187 | 33 | 0.533376% |
| D | 6187 | 677 | 10.942298% |
Noise dominated data is calculated using 1-second bins in cleaned event files. If a bin has >2000 counts, and if more than 50% of those come from <1% of pixels, then it is considered to be noise-dominated and hence unusable.
| Quadrant | # 1 sec bins | Bins with >0 counts | Bins with >2000 counts | High rate bins dominated by noise | Noise dominated (total time) | Noise dominated (detector-on time) | Marked lightcurve |
|---|---|---|---|---|---|---|---|
| A | 7502 | 6188 | 21 | 21 | 0.28% | 0.34% | 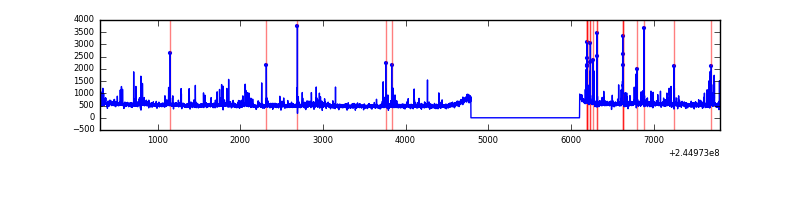 |
| B | 7502 | 6188 | 273 | 273 | 3.64% | 4.41% | 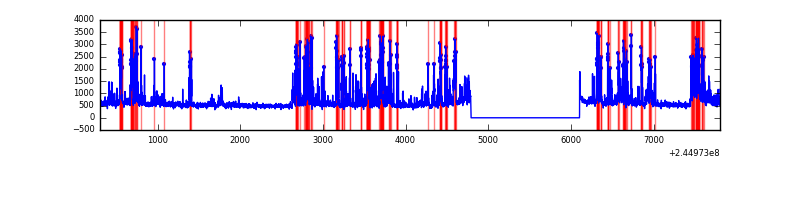 |
| C | 7502 | 6188 | 0 | 0 | 0.00% | 0.00% | 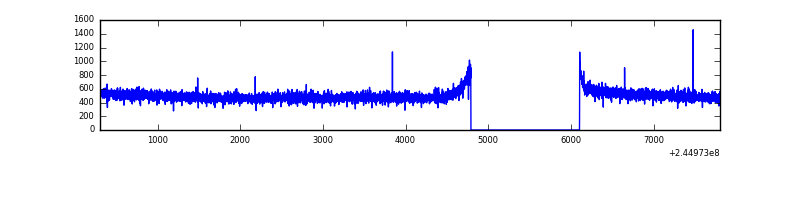 |
| D | 7502 | 6188 | 522 | 522 | 6.96% | 8.44% |  |
Top three noisy pixels from each quadrant. If the there are fewer than three noisy pixels in the level2.evt file, extra rows are filled as -1
| Pixel properties | Quadrant properties | ||||||
|---|---|---|---|---|---|---|---|
| Quadrant | DetID | PixID | Counts | Sigma | Mean | Median | Sigma |
| A | 8 | 5 | 267750 | 1618.15 | 814 | 798 | 165.0 |
| A | 11 | 29 | 27450 | 161.55 | 814 | 798 | 165.0 |
| A | 8 | 15 | 26893 | 158.18 | 814 | 798 | 165.0 |
| B | 4 | 239 | 1470792 | 9921.6 | 788 | 771 | 148.2 |
| B | 0 | 214 | 49725 | 330.4 | 788 | 771 | 148.2 |
| B | 0 | 219 | 25939 | 169.87 | 788 | 771 | 148.2 |
| C | 13 | 61 | 5773 | 27.85 | 782 | 787 | 179.1 |
| C | 8 | 222 | 2566 | 9.94 | 782 | 787 | 179.1 |
| C | 3 | 202 | 2097 | 7.32 | 782 | 787 | 179.1 |
| D | 1 | 52 | 1416868 | 7990.89 | 738 | 720 | 177.2 |
| D | 5 | 222 | 621583 | 3503.34 | 738 | 720 | 177.2 |
| D | 5 | 97 | 49266 | 273.93 | 738 | 720 | 177.2 |
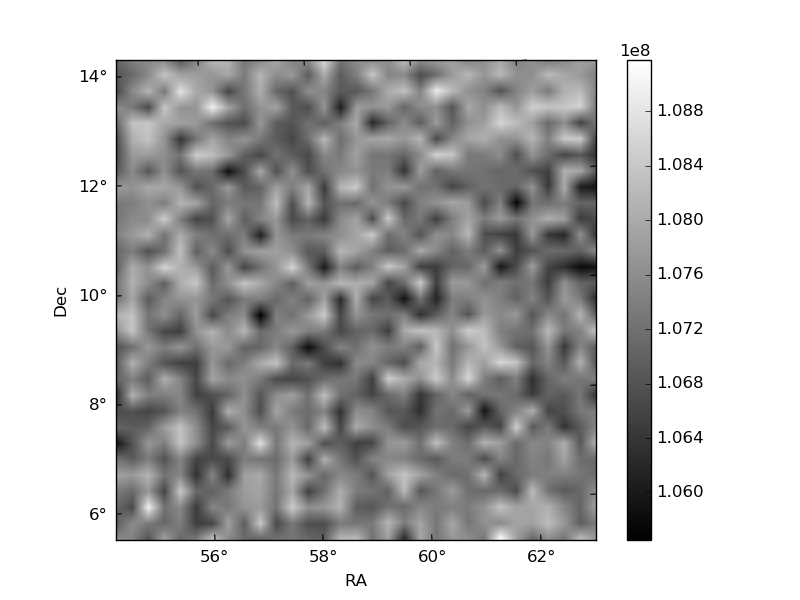
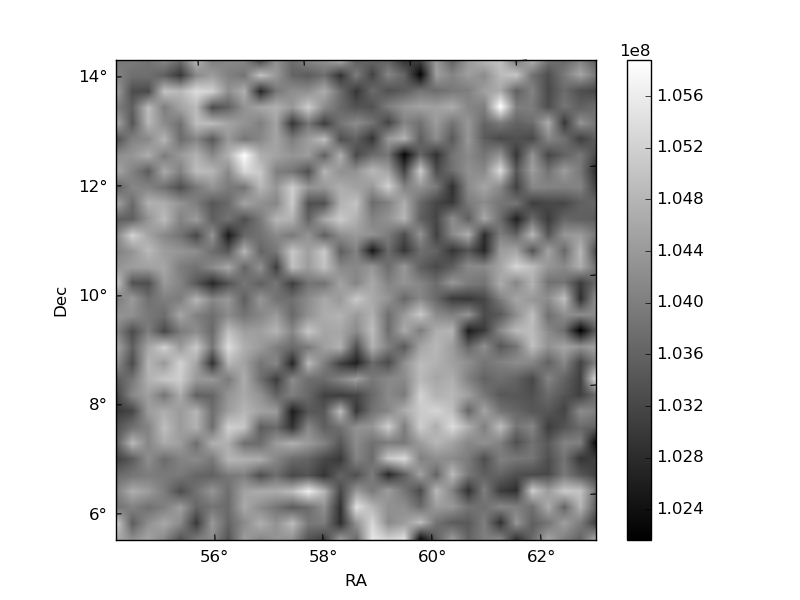
Histogram calculated using DETX and DETY for each event in the final _common_clean file
| Quadrant A |  |
 |
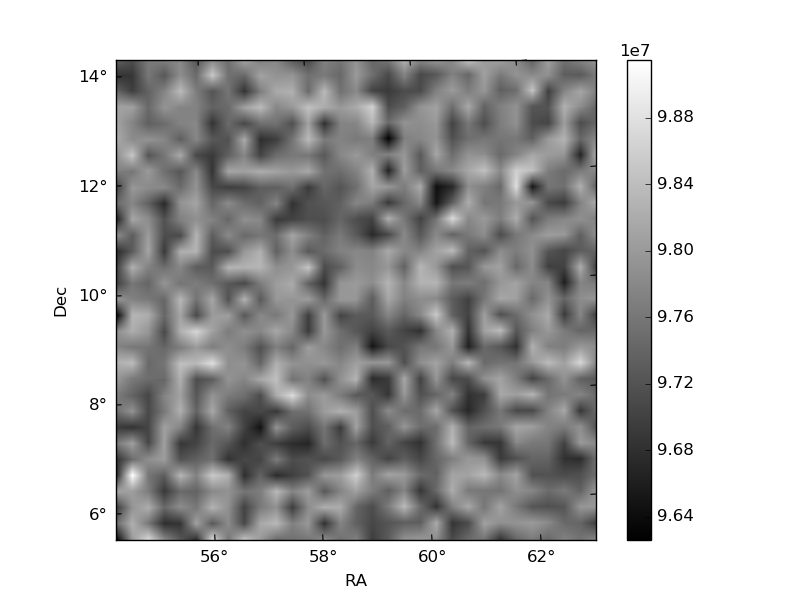
Quadrant B |
|---|---|---|---|
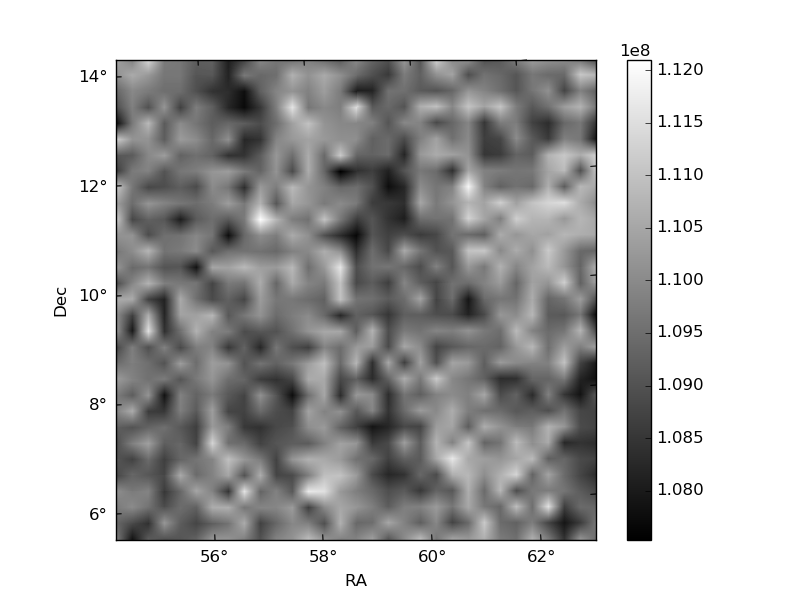
| Quadrant D |  |
 |
Quadrant C |
| Plot type | Count rate plots | Images |
|---|---|---|
| Comparison with Poisson distribution Blue bars denote a histogram of data divided into 1 sec bins. Red curve is a Poisson curve with rate = median count rate of data. |
 |
 |
| Quadrant-wise count rates Data is divided into 100 sec bins |
 |
|
| Module-wise count rates for Quadrant A Data is divided into 100 sec bins |
 |
 |
| Module-wise count rates for Quadrant B Data is divided into 100 sec bins |
 |
 |
| Module-wise count rates for Quadrant C Data is divided into 100 sec bins |
 |
 |
| Module-wise count rates for Quadrant D Data is divided into 100 sec bins |
 |
 |
| Parameter | Plot |
|---|---|
| CZT HV Monitor |  |
| D_VDD |  |
| Temperature 1 |  |
| Veto HV Monitor |  |
| Veto LLD |  |
| Alpha Counter |  |
| _CPM_Rate |  |
| CZT Counter |  |
| +2.5 Volts monitor |  |
| +5 Volts monitor |  |
| _ROLL_ROT |  |
| _Roll_DEC |  |
| _Roll_RA |  |
| Veto Counter |  |