| Param | Original file | Final file |
|---|---|---|
| Filename | modeM0/AS1C03_013T01_9000001586_10944cztM0_level2.evt | modeM0/AS1C03_013T01_9000001586_10944cztM0_level2_quad_clean.evt |
| Size (bytes) | 486,336,960 | 63,118,080 |
| Size | 463.8 MB | 60.2 MB |
| Events in quadrant A | 3,525,147 | 375,156 |
| Events in quadrant B | 4,558,942 | 371,051 |
| Events in quadrant C | 2,872,974 | 378,652 |
| Events in quadrant D | 3,361,431 | 364,273 |
| Mode M0 | |||
|---|---|---|---|
| Quadrant | BADHDUFLAG | Total packets | Discarded packets |
| A | 0 | 14325 | 2 |
| B | 0 | 17267 | 1 |
| C | 0 | 12464 | 1 |
| D | 0 | 13951 | 1 |
| Mode M9 | |||
|---|---|---|---|
| Quadrant | BADHDUFLAG | Total packets | Discarded packets |
| A | 0 | 10 | 0 |
| B | 0 | 10 | 0 |
| C | 0 | 10 | 0 |
| D | 0 | 10 | 0 |
| Mode SS | |||
|---|---|---|---|
| Quadrant | BADHDUFLAG | Total packets | Discarded packets |
| A | 0 | 124 | 0 |
| B | 0 | 124 | 0 |
| C | 0 | 124 | 0 |
| D | 0 | 124 | 0 |
| Quadrant | Total seconds | Saturated seconds | Saturation percentage |
|---|---|---|---|
| A | 6035 | 214 | 3.545982% |
| B | 6035 | 649 | 10.753935% |
| C | 6035 | 76 | 1.259321% |
| D | 6035 | 190 | 3.148302% |
Noise dominated data is calculated using 1-second bins in cleaned event files. If a bin has >2000 counts, and if more than 50% of those come from <1% of pixels, then it is considered to be noise-dominated and hence unusable.
| Quadrant | # 1 sec bins | Bins with >0 counts | Bins with >2000 counts | High rate bins dominated by noise | Noise dominated (total time) | Noise dominated (detector-on time) | Marked lightcurve |
|---|---|---|---|---|---|---|---|
| A | 7070 | 6035 | 65 | 65 | 0.92% | 1.08% | 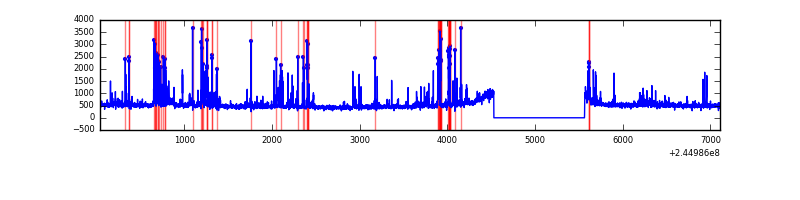 |
| B | 7070 | 6035 | 424 | 424 | 6.00% | 7.03% |  |
| C | 7070 | 6036 | 0 | 0 | 0.00% | 0.00% |  |
| D | 7070 | 6036 | 67 | 67 | 0.95% | 1.11% | 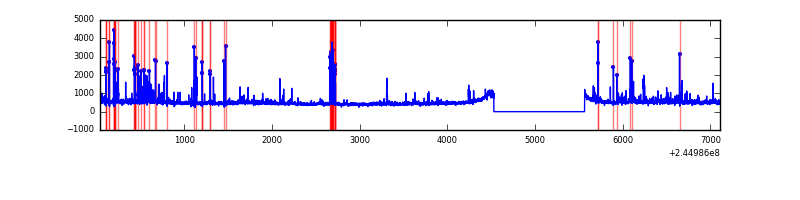 |
Top three noisy pixels from each quadrant. If the there are fewer than three noisy pixels in the level2.evt file, extra rows are filled as -1
| Pixel properties | Quadrant properties | ||||||
|---|---|---|---|---|---|---|---|
| Quadrant | DetID | PixID | Counts | Sigma | Mean | Median | Sigma |
| A | 8 | 5 | 541330 | 3509.03 | 751 | 735 | 154.1 |
| A | 13 | 210 | 32324 | 205.05 | 751 | 735 | 154.1 |
| A | 14 | 238 | 26580 | 167.76 | 751 | 735 | 154.1 |
| B | 4 | 239 | 1626537 | 11590.36 | 731 | 714 | 140.3 |
| B | 0 | 214 | 28409 | 197.44 | 731 | 714 | 140.3 |
| B | 0 | 187 | 19527 | 134.12 | 731 | 714 | 140.3 |
| C | 13 | 61 | 5631 | 28.46 | 735 | 738 | 171.9 |
| C | 8 | 222 | 2673 | 11.25 | 735 | 738 | 171.9 |
| C | 5 | 207 | 2664 | 11.2 | 735 | 738 | 171.9 |
| D | 1 | 52 | 267431 | 1520.08 | 728 | 708 | 175.5 |
| D | 5 | 97 | 104677 | 592.53 | 728 | 708 | 175.5 |
| D | 5 | 222 | 101379 | 573.73 | 728 | 708 | 175.5 |
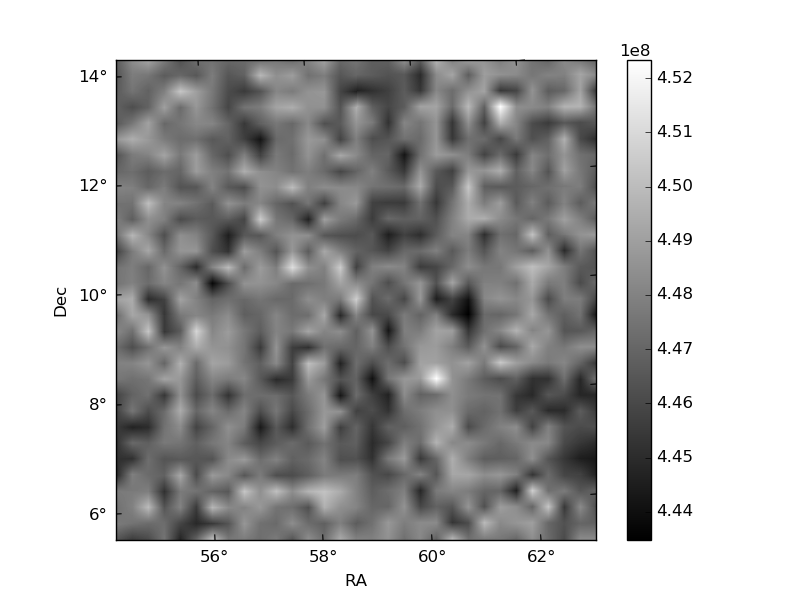
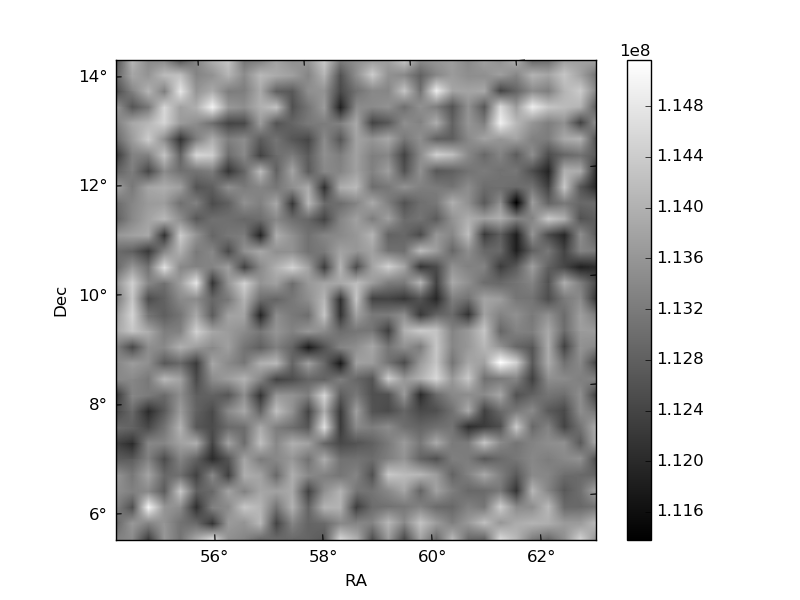
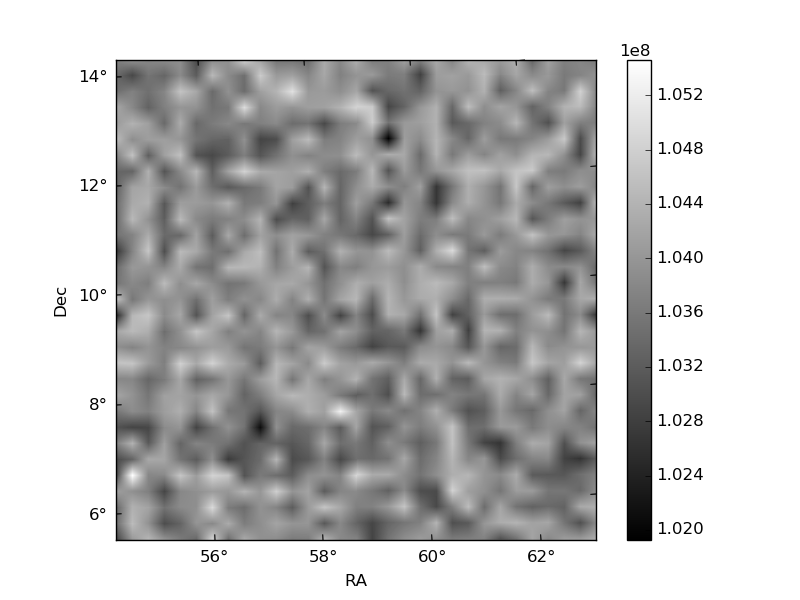
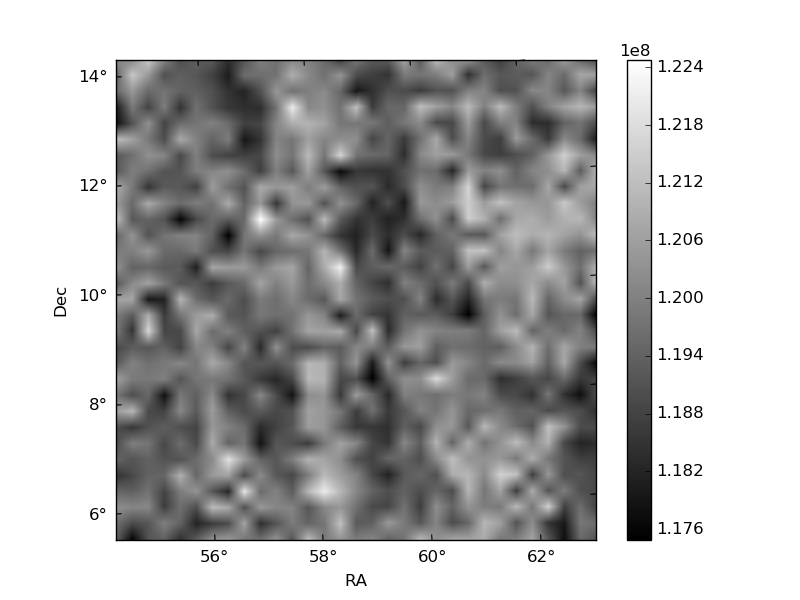
Histogram calculated using DETX and DETY for each event in the final _common_clean file
| Quadrant A | 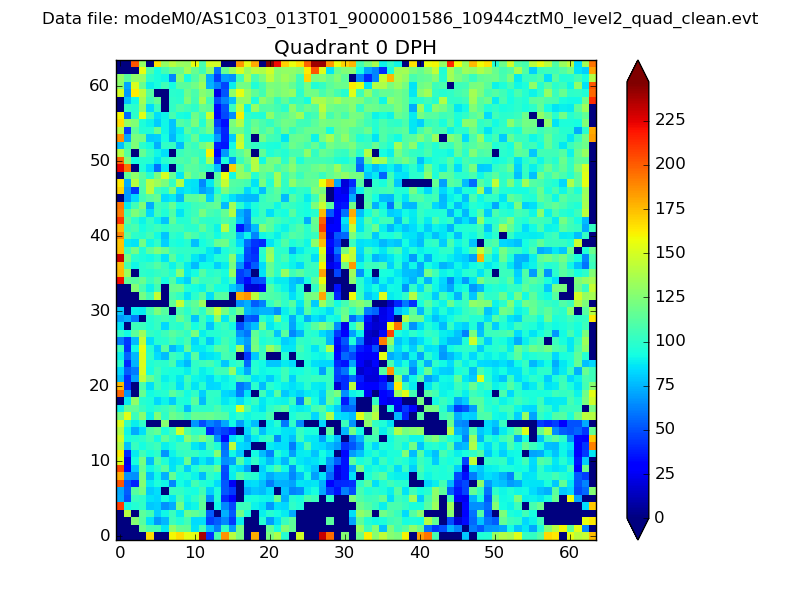 |
 |
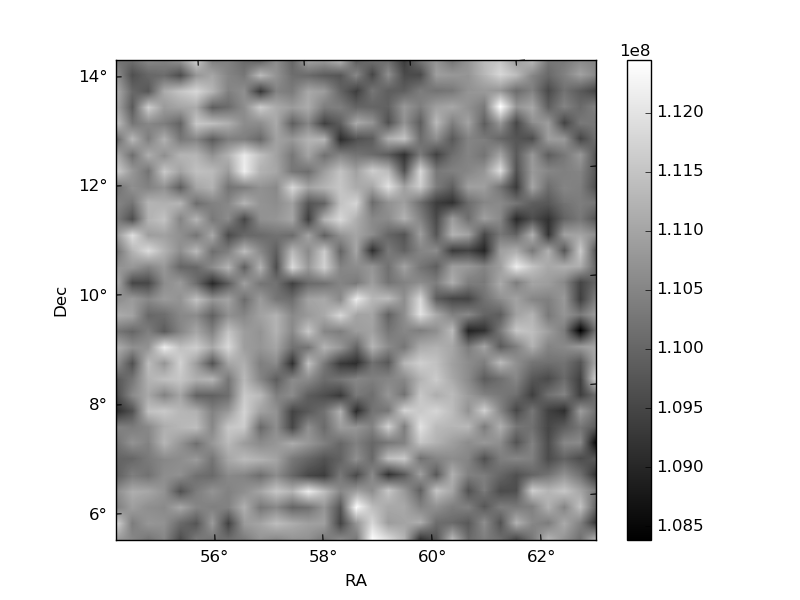
Quadrant B |
|---|---|---|---|
| Quadrant D | 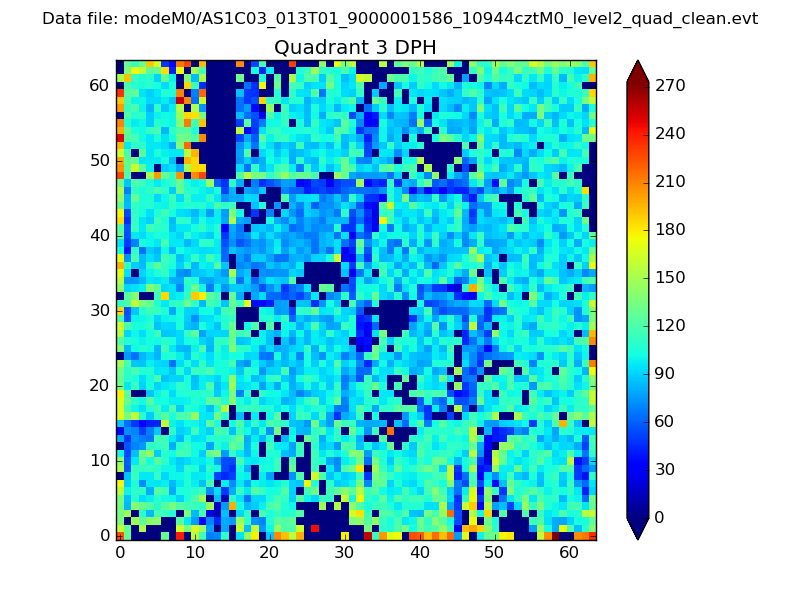 |
 |
Quadrant C |
| Plot type | Count rate plots | Images |
|---|---|---|
| Comparison with Poisson distribution Blue bars denote a histogram of data divided into 1 sec bins. Red curve is a Poisson curve with rate = median count rate of data. |
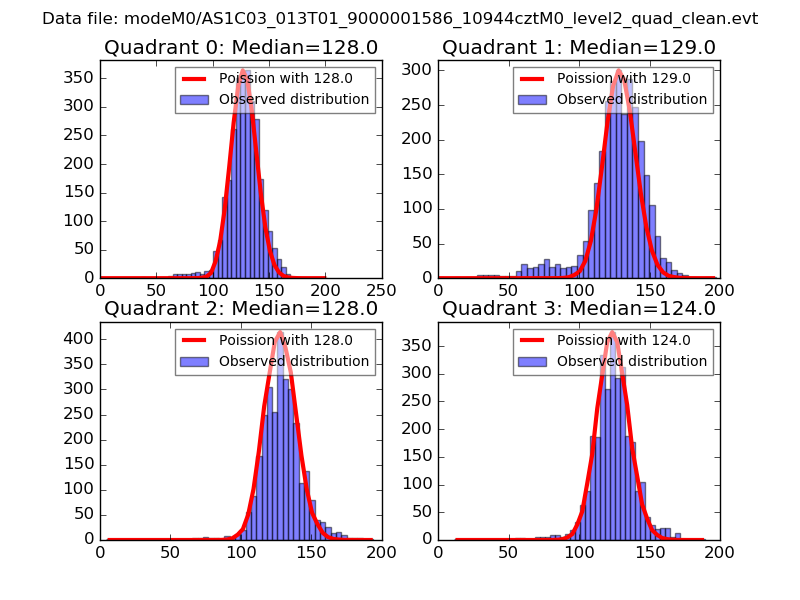 |
 |
| Quadrant-wise count rates Data is divided into 100 sec bins |
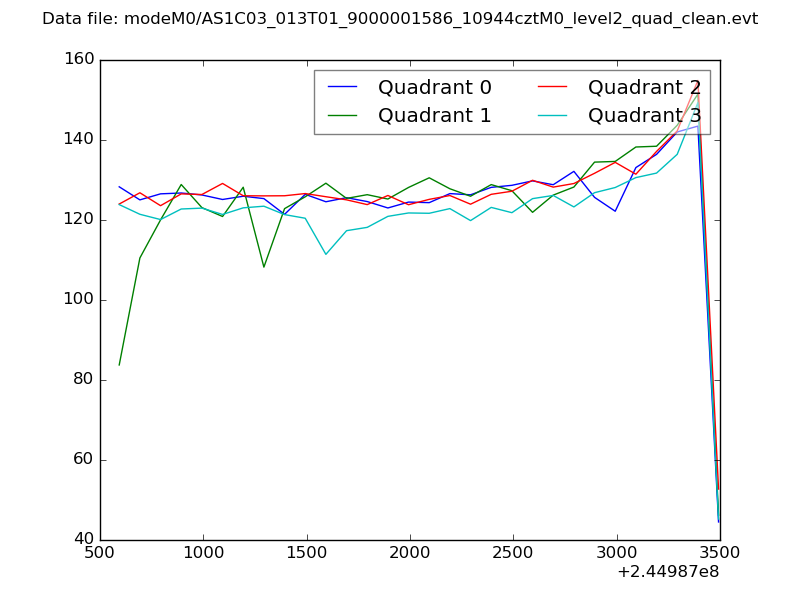 |
|
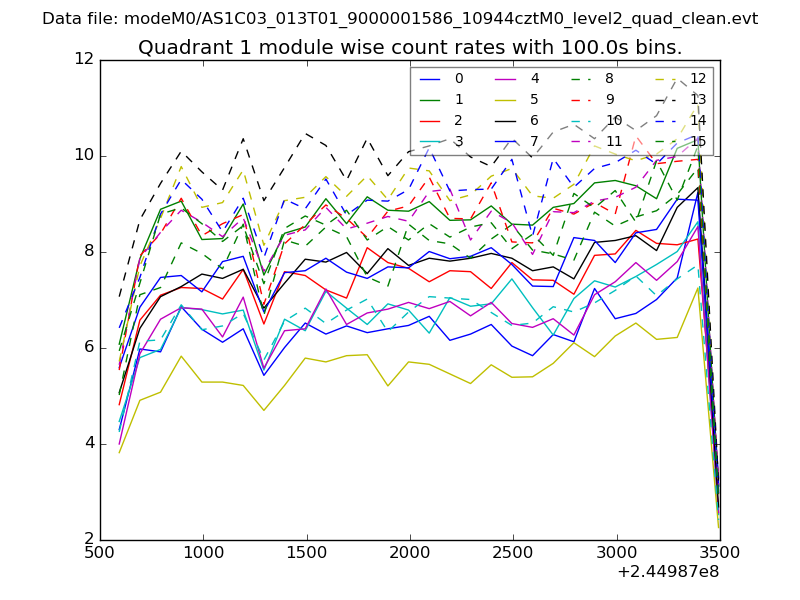
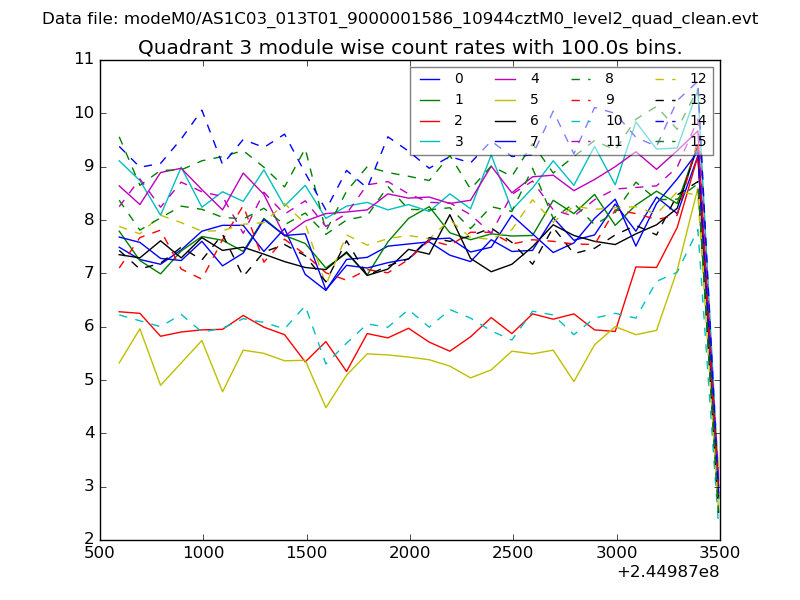
| Module-wise count rates for Quadrant A Data is divided into 100 sec bins |
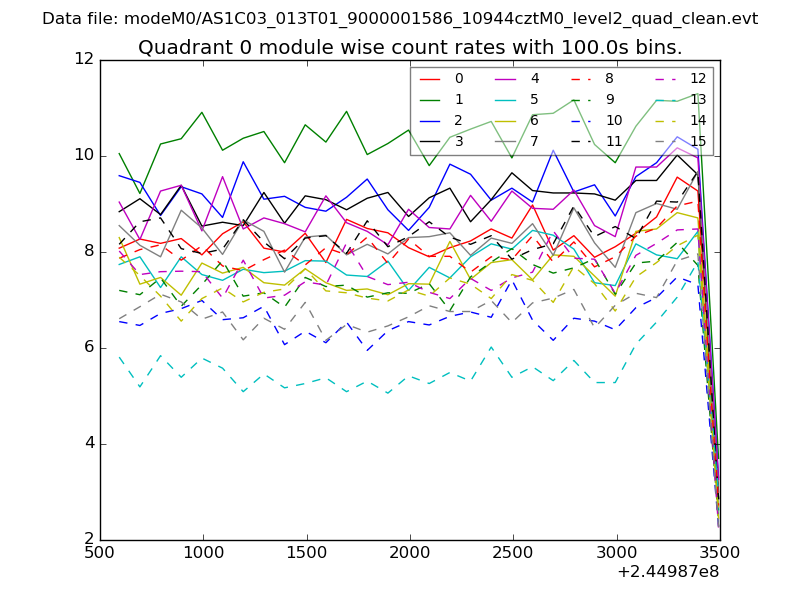 |
 |
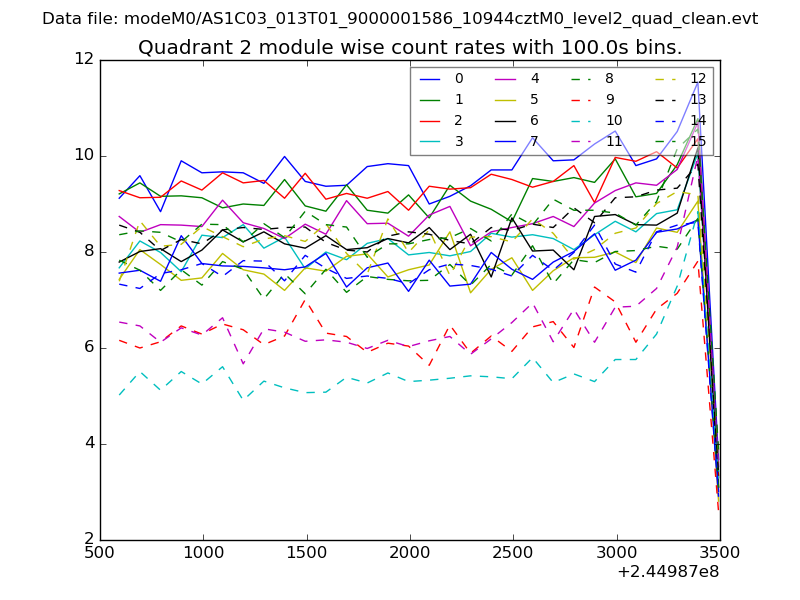
| Module-wise count rates for Quadrant B Data is divided into 100 sec bins |
 |
 |
| Module-wise count rates for Quadrant C Data is divided into 100 sec bins |
 |
 |
| Module-wise count rates for Quadrant D Data is divided into 100 sec bins |
 |
 |
| Parameter | Plot |
|---|---|
| CZT HV Monitor | 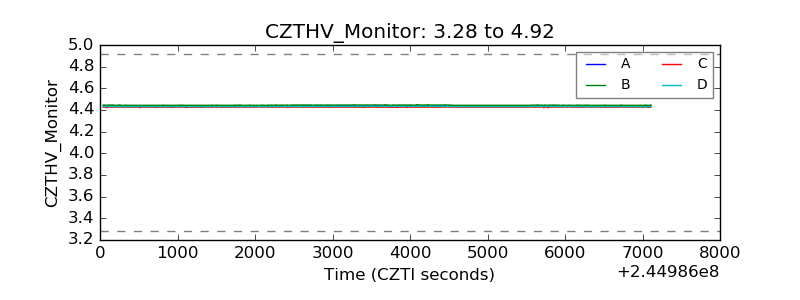 |
| D_VDD | 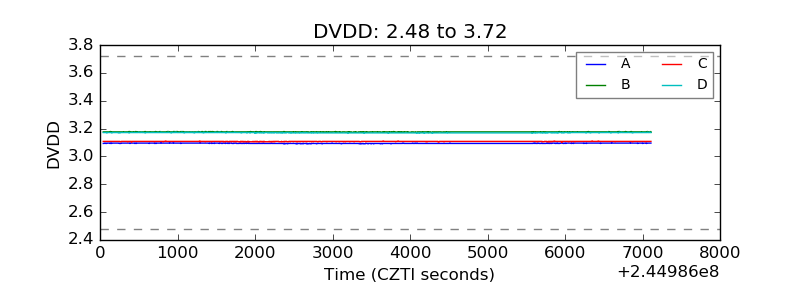 |
| Temperature 1 | 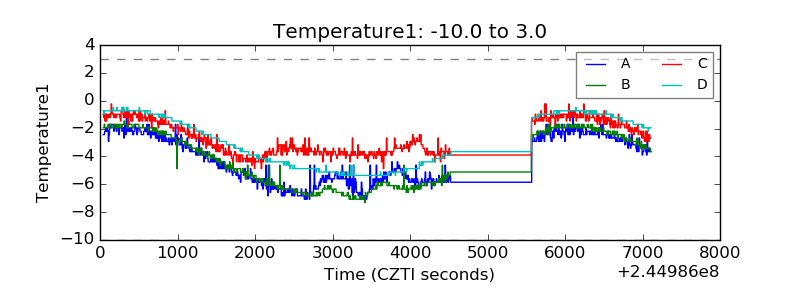 |
| Veto HV Monitor | 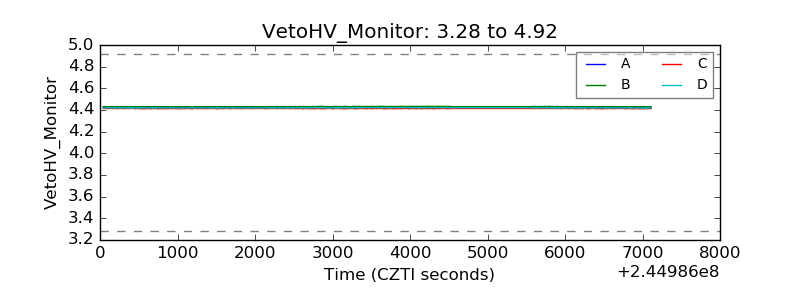 |
| Veto LLD | 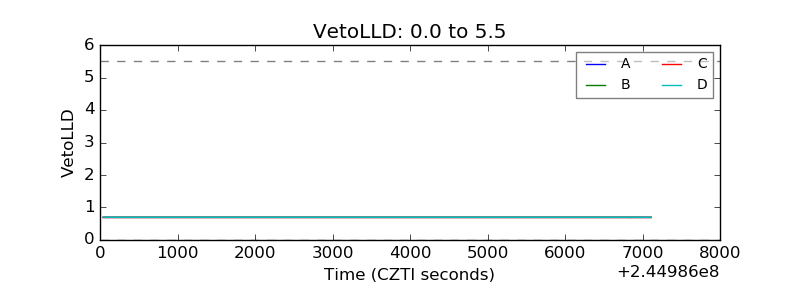 |
| Alpha Counter | 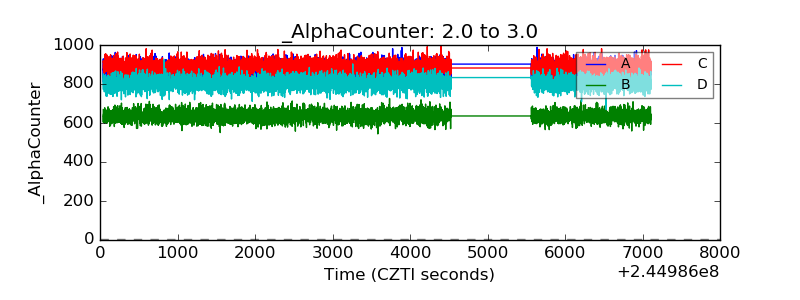 |
| _CPM_Rate | 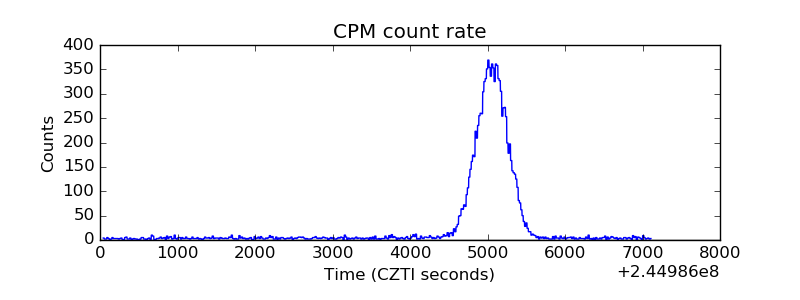 |
| CZT Counter |  |
| +2.5 Volts monitor |  |
| +5 Volts monitor |  |
| _ROLL_ROT | 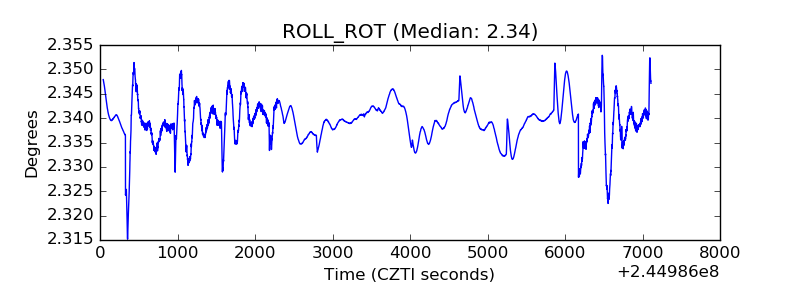 |
| _Roll_DEC | 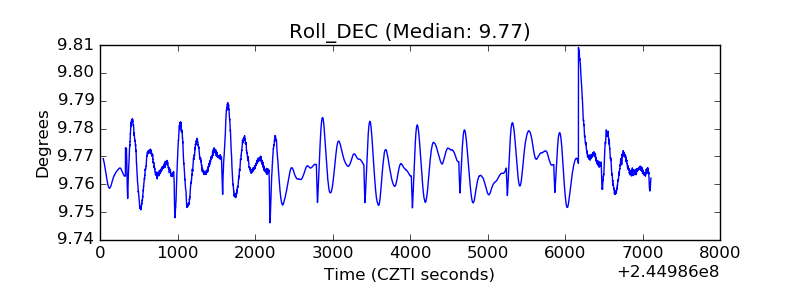 |
| _Roll_RA | 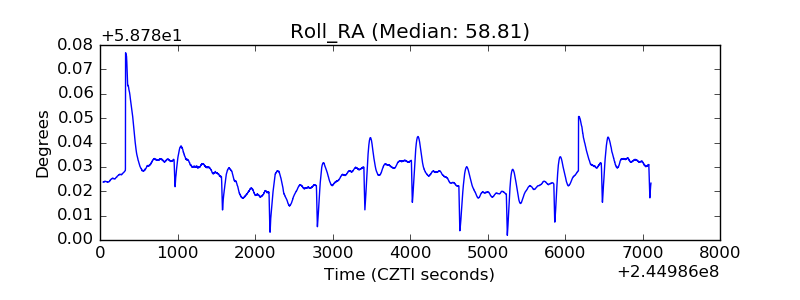 |
| Veto Counter | 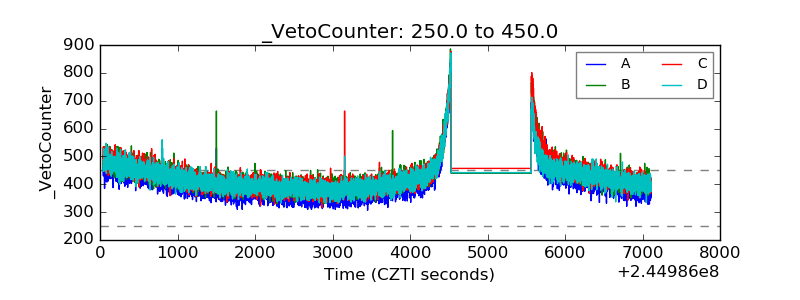 |