| Param | Original file | Final file |
|---|---|---|
| Filename | modeM0/AS1C03_013T01_9000001586_10945cztM0_level2.evt | modeM0/AS1C03_013T01_9000001586_10945cztM0_level2_quad_clean.evt |
| Size (bytes) | 171,728,640 | 12,908,160 |
| Size | 163.8 MB | 12.3 MB |
| Events in quadrant A | 1,161,179 | 57,922 |
| Events in quadrant B | 1,476,474 | 55,583 |
| Events in quadrant C | 1,058,442 | 57,523 |
| Events in quadrant D | 1,347,944 | 54,842 |
| Mode M0 | |||
|---|---|---|---|
| Quadrant | BADHDUFLAG | Total packets | Discarded packets |
| A | 0 | 4809 | 0 |
| B | 0 | 5784 | 0 |
| C | 0 | 4579 | 0 |
| D | 0 | 5419 | 0 |
| Mode SS | |||
|---|---|---|---|
| Quadrant | BADHDUFLAG | Total packets | Discarded packets |
| A | 0 | 46 | 0 |
| B | 0 | 46 | 0 |
| C | 0 | 46 | 0 |
| D | 0 | 46 | 0 |
| Quadrant | Total seconds | Saturated seconds | Saturation percentage |
|---|---|---|---|
| A | 2272 | 7 | 0.308099% |
| B | 2272 | 80 | 3.521127% |
| C | 2272 | 4 | 0.176056% |
| D | 2272 | 17 | 0.748239% |
Noise dominated data is calculated using 1-second bins in cleaned event files. If a bin has >2000 counts, and if more than 50% of those come from <1% of pixels, then it is considered to be noise-dominated and hence unusable.
| Quadrant | # 1 sec bins | Bins with >0 counts | Bins with >2000 counts | High rate bins dominated by noise | Noise dominated (total time) | Noise dominated (detector-on time) | Marked lightcurve |
|---|---|---|---|---|---|---|---|
| A | 2272 | 2272 | 1 | 1 | 0.04% | 0.04% | 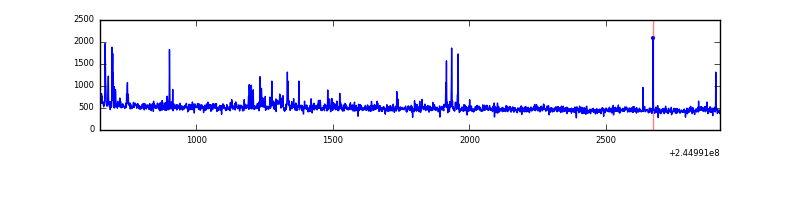 |
| B | 2272 | 2272 | 50 | 50 | 2.20% | 2.20% | 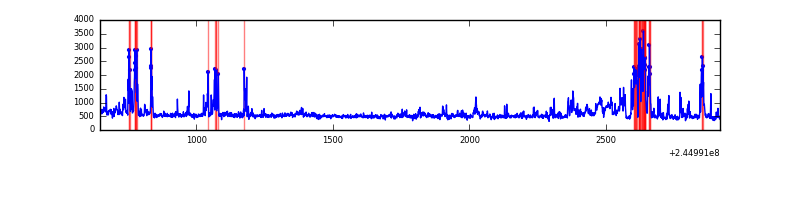 |
| C | 2272 | 2272 | 0 | 0 | 0.00% | 0.00% | 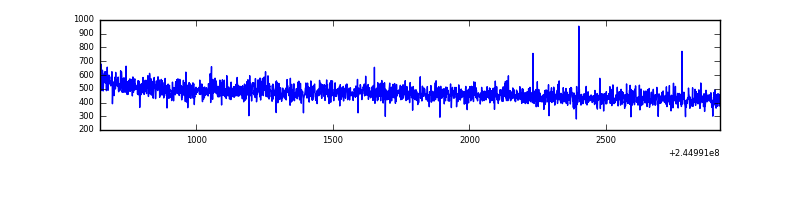 |
| D | 2272 | 2272 | 12 | 12 | 0.53% | 0.53% | 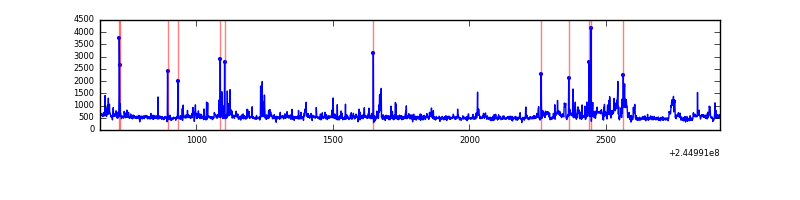 |
Top three noisy pixels from each quadrant. If the there are fewer than three noisy pixels in the level2.evt file, extra rows are filled as -1
| Pixel properties | Quadrant properties | ||||||
|---|---|---|---|---|---|---|---|
| Quadrant | DetID | PixID | Counts | Sigma | Mean | Median | Sigma |
| A | 8 | 5 | 61623 | 1031.42 | 280 | 275 | 59.5 |
| A | 11 | 29 | 9500 | 155.1 | 280 | 275 | 59.5 |
| A | 8 | 4 | 4457 | 70.31 | 280 | 275 | 59.5 |
| B | 4 | 239 | 353013 | 6504.58 | 275 | 268 | 54.2 |
| B | 11 | 51 | 15111 | 273.7 | 275 | 268 | 54.2 |
| B | 0 | 214 | 14805 | 268.06 | 275 | 268 | 54.2 |
| C | 13 | 61 | 2080 | 28.17 | 271 | 272 | 64.2 |
| C | 8 | 222 | 892 | 9.66 | 271 | 272 | 64.2 |
| C | 12 | 4 | 821 | 8.55 | 271 | 272 | 64.2 |
| D | 1 | 52 | 88613 | 1312.46 | 272 | 264 | 67.3 |
| D | 13 | 138 | 63567 | 940.39 | 272 | 264 | 67.3 |
| D | 5 | 222 | 56581 | 836.61 | 272 | 264 | 67.3 |
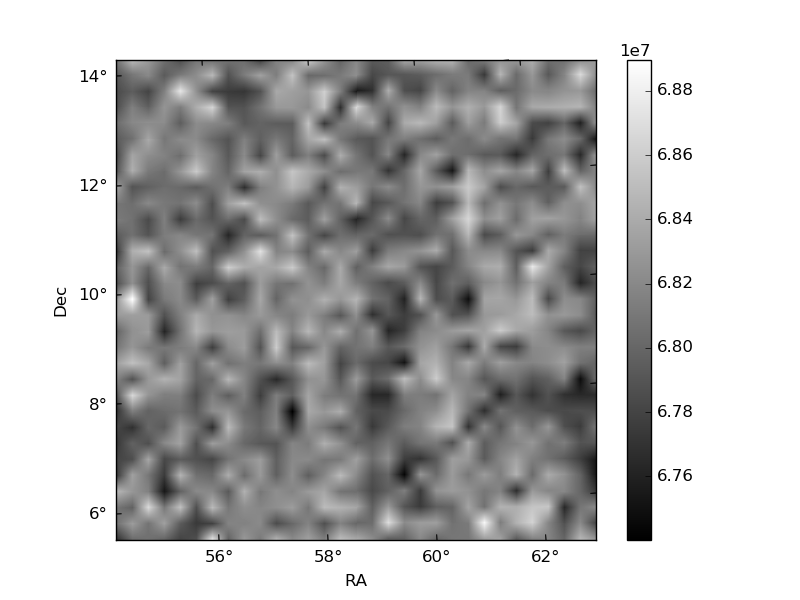
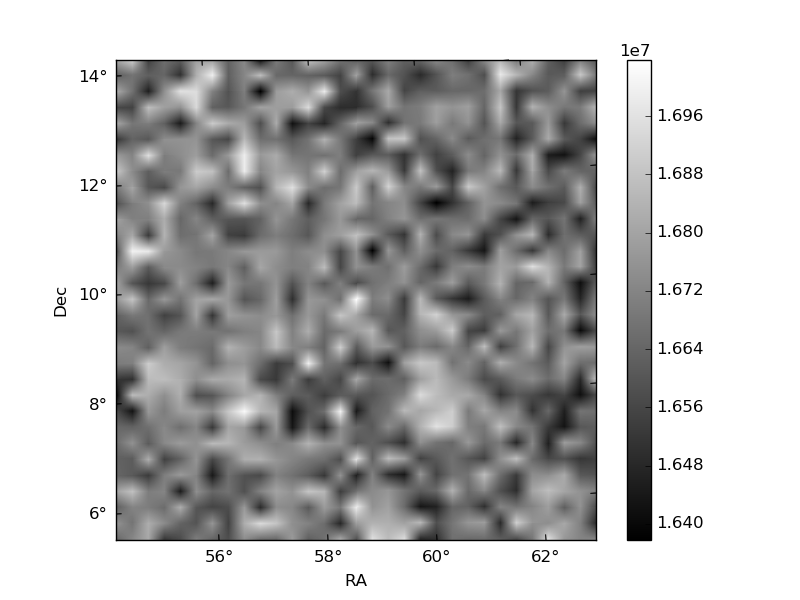
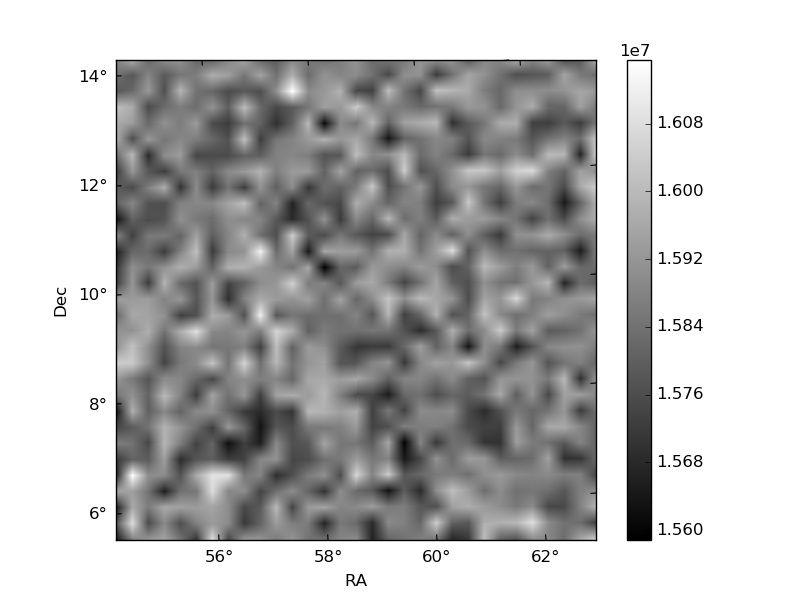
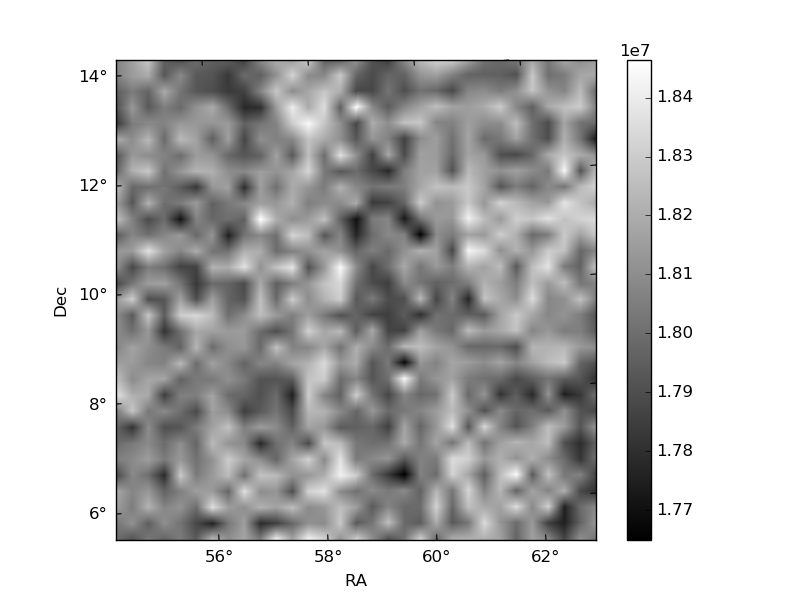
Histogram calculated using DETX and DETY for each event in the final _common_clean file
| Quadrant A | 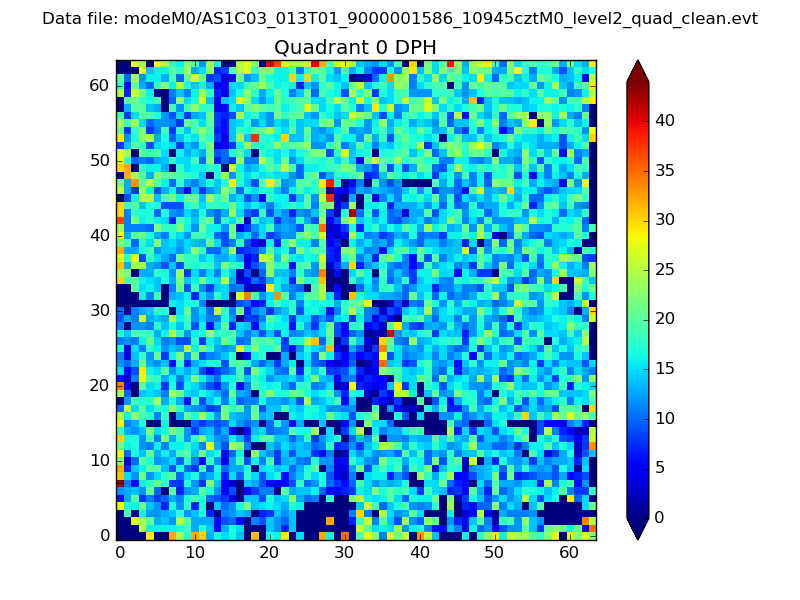 |
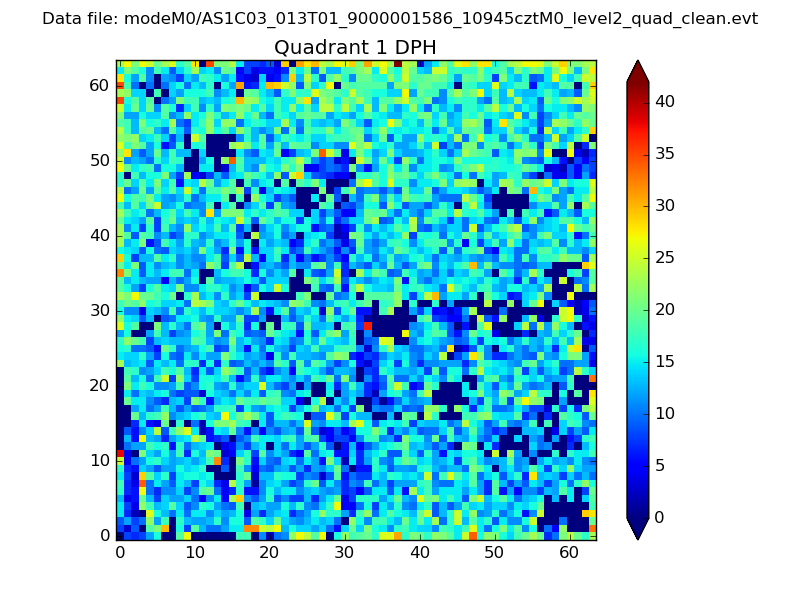 |
Quadrant B |
|---|---|---|---|
| Quadrant D | 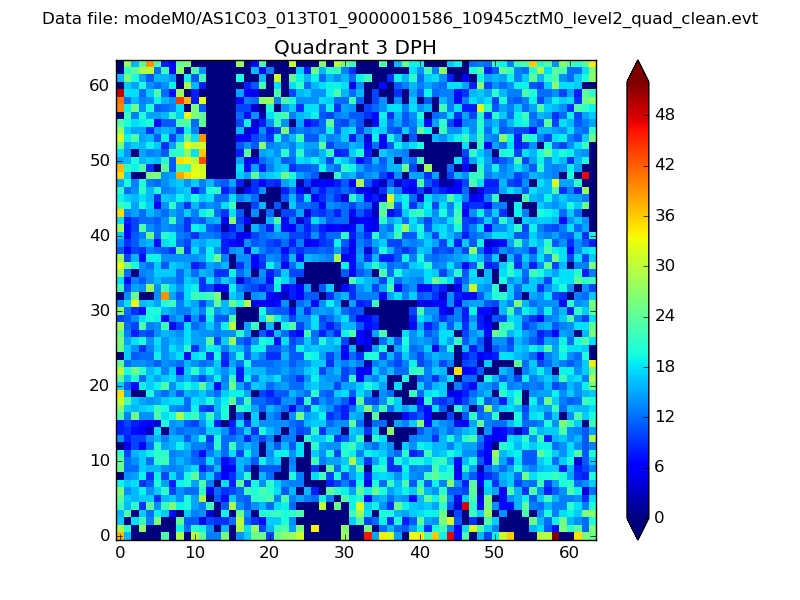 |
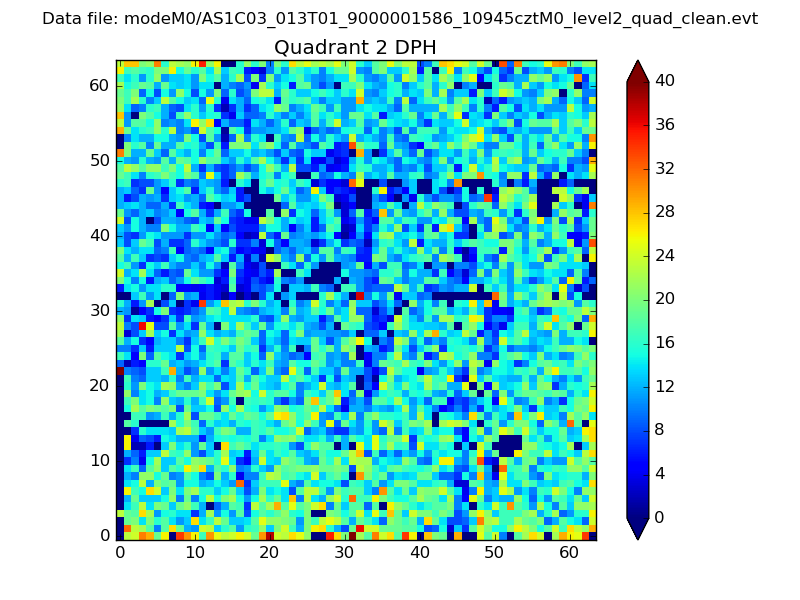 |
Quadrant C |
| Plot type | Count rate plots | Images |
|---|---|---|
| Comparison with Poisson distribution Blue bars denote a histogram of data divided into 1 sec bins. Red curve is a Poisson curve with rate = median count rate of data. |
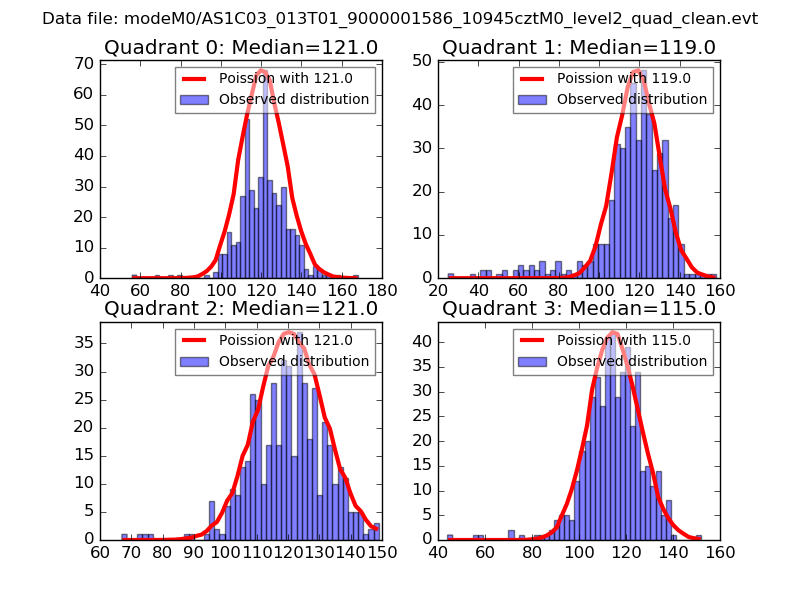 |
 |
| Quadrant-wise count rates Data is divided into 100 sec bins |
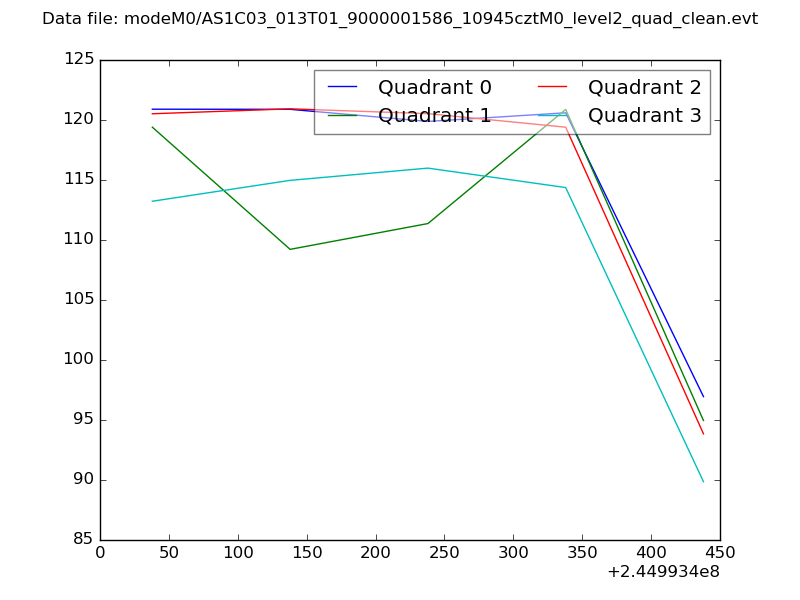 |
|
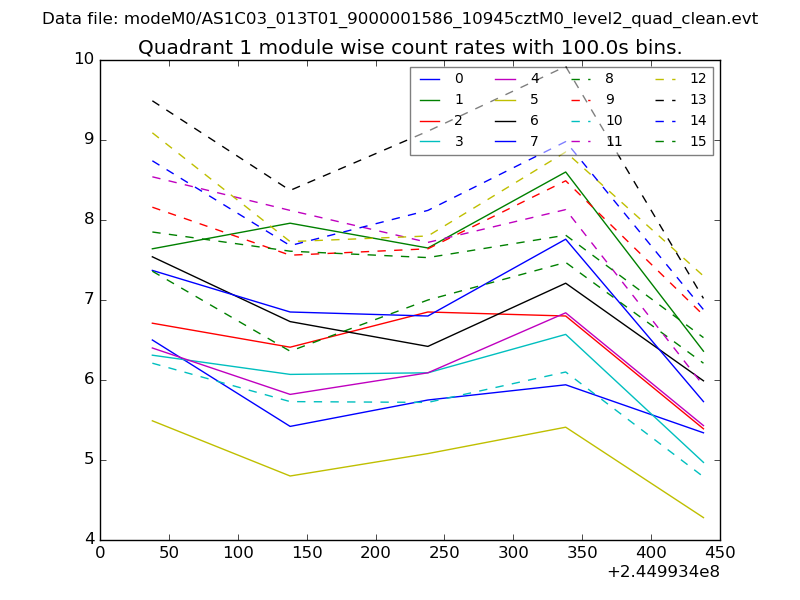
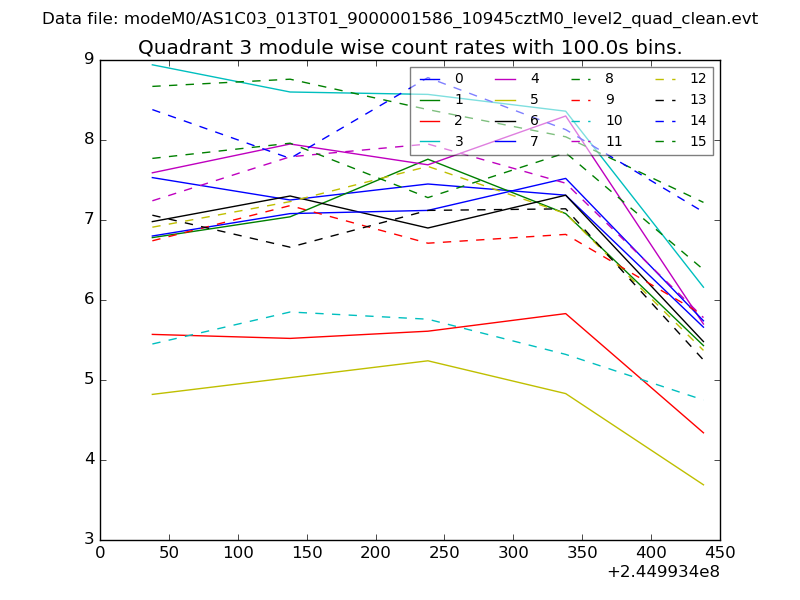
| Module-wise count rates for Quadrant A Data is divided into 100 sec bins |
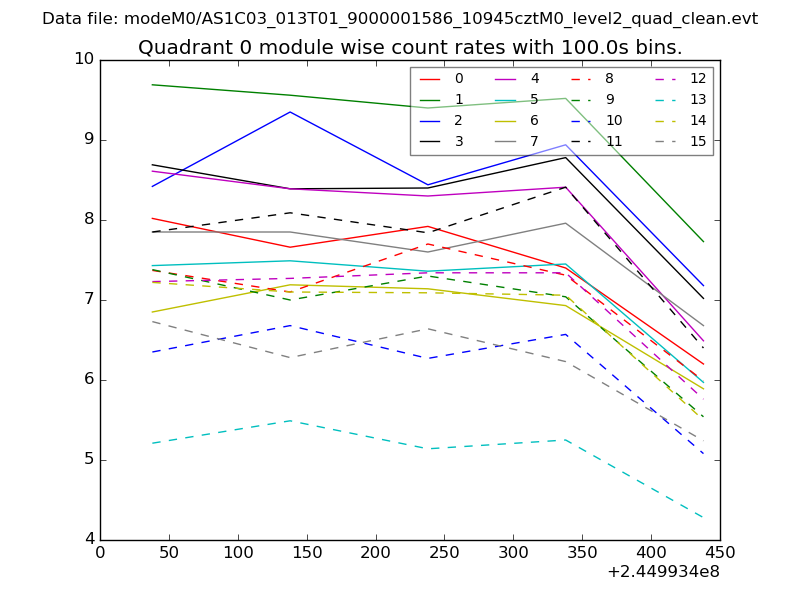 |
 |
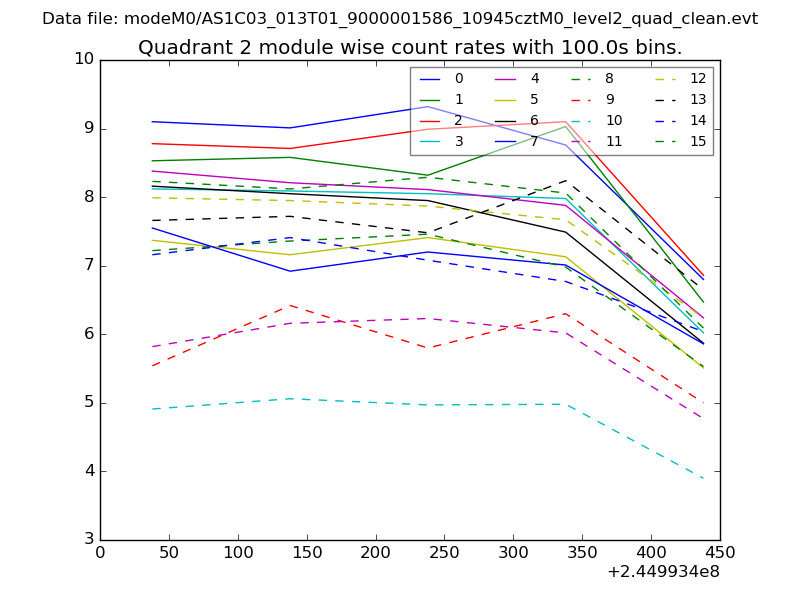
| Module-wise count rates for Quadrant B Data is divided into 100 sec bins |
 |
 |
| Module-wise count rates for Quadrant C Data is divided into 100 sec bins |
 |
 |
| Module-wise count rates for Quadrant D Data is divided into 100 sec bins |
 |
 |
| Parameter | Plot |
|---|---|
| CZT HV Monitor | 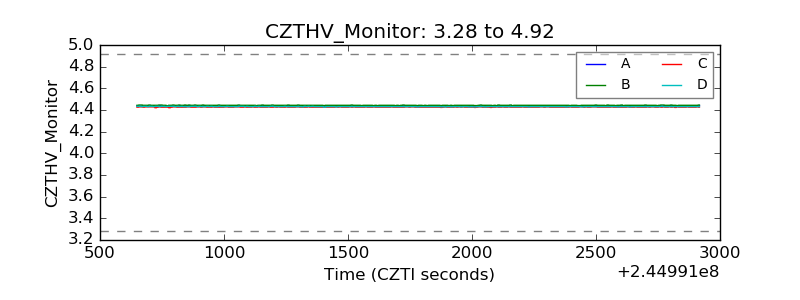 |
| D_VDD | 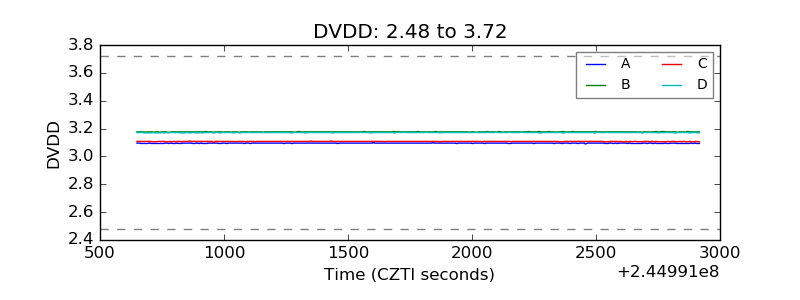 |
| Temperature 1 | 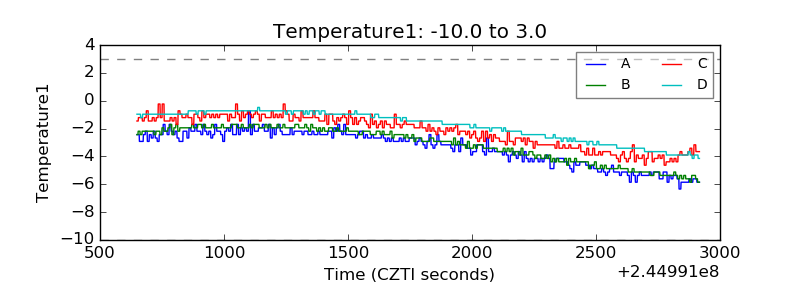 |
| Veto HV Monitor | 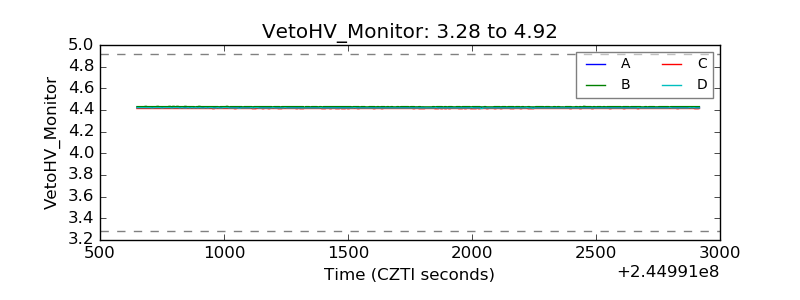 |
| Veto LLD | 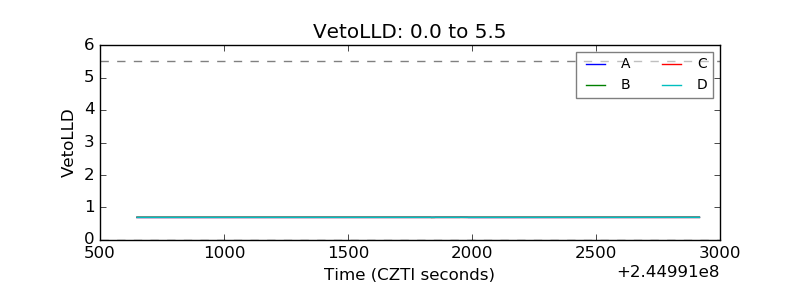 |
| Alpha Counter | 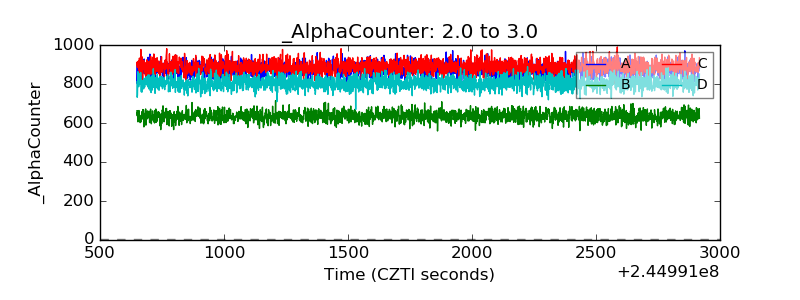 |
| _CPM_Rate | 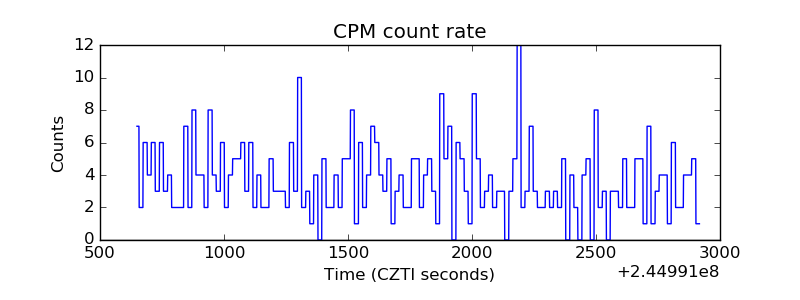 |
| CZT Counter | 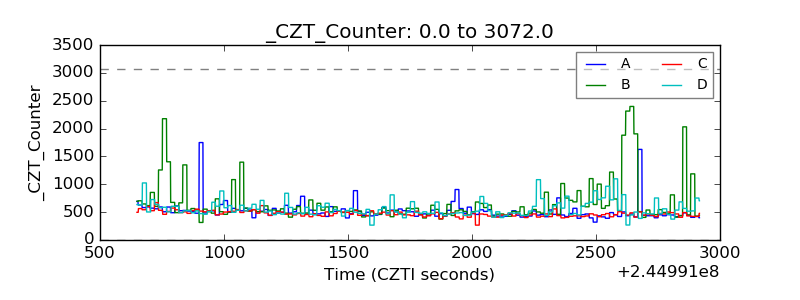 |
| +2.5 Volts monitor | 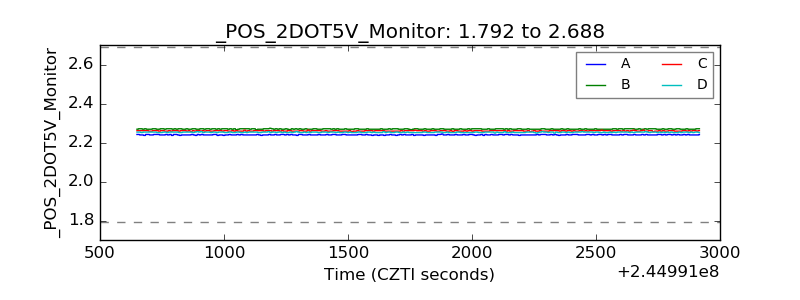 |
| +5 Volts monitor | 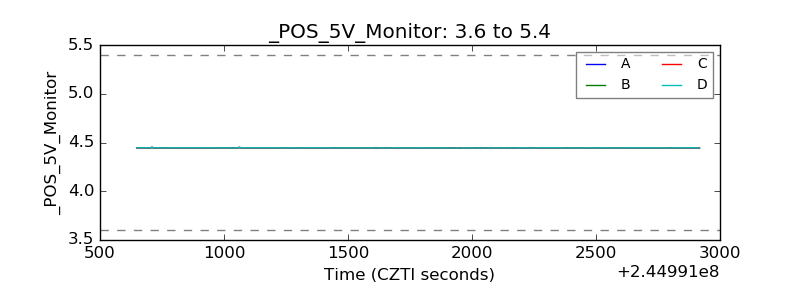 |
| _ROLL_ROT | 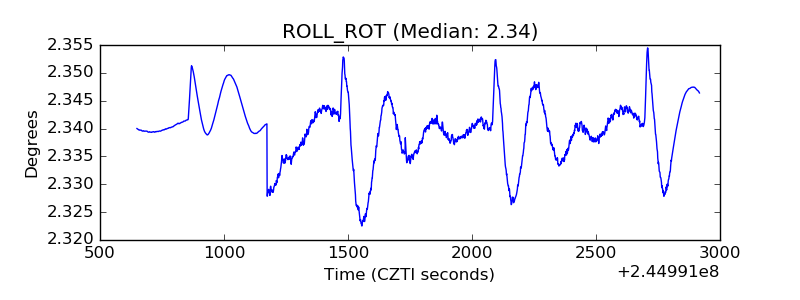 |
| _Roll_DEC | 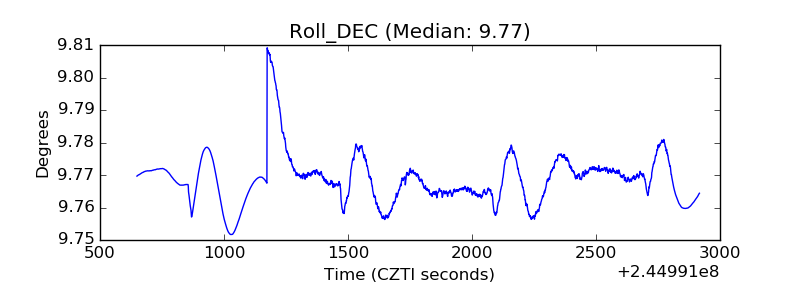 |
| _Roll_RA | 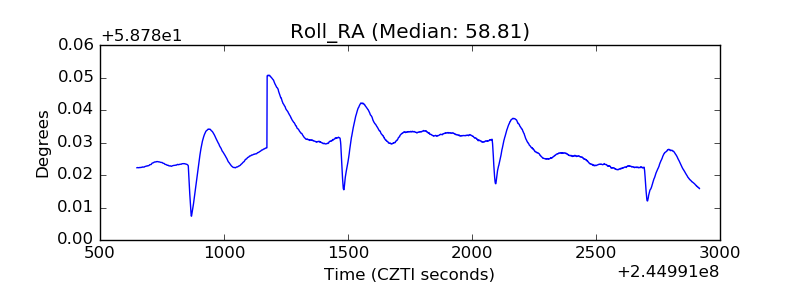 |
| Veto Counter | 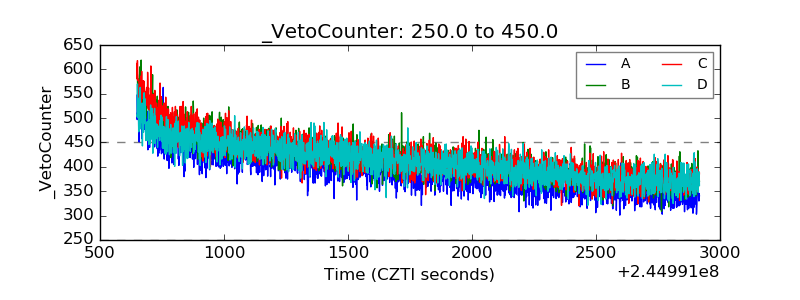 |