| Param | Original file | Final file |
|---|---|---|
| Filename | modeM0/AS1G08_037T01_9000001588cztM0_level2.fits | modeM0/AS1G08_037T01_9000001588cztM0_level2_quad_clean.evt |
| Size (bytes) | 408,303,360 | 395,161,920 |
| Size | 389.4 MB | 376.9 MB |
| Events in quadrant A | 2,411,906 | 2,282,437 |
| Events in quadrant B | 2,358,488 | 2,340,448 |
| Events in quadrant C | 2,458,375 | 2,306,884 |
| Events in quadrant D | 2,037,358 | 1,941,222 |
| Mode M0 | |||
|---|---|---|---|
| Quadrant | BADHDUFLAG | Total packets | Discarded packets |
| A | 0 | 136343 | 0 |
| B | 0 | 117470 | 0 |
| C | 0 | 92318 | 0 |
| D | 0 | 123958 | 0 |
| Mode SS | |||
|---|---|---|---|
| Quadrant | BADHDUFLAG | Total packets | Discarded packets |
| A | 0 | 926 | 0 |
| B | 0 | 920 | 0 |
| C | 0 | 920 | 0 |
| D | 0 | 922 | 0 |
| Mode M9 | |||
|---|---|---|---|
| Quadrant | BADHDUFLAG | Total packets | Discarded packets |
| A | 0 | 47 | 0 |
| B | 0 | 47 | 0 |
| C | 0 | 47 | 0 |
| D | 0 | 47 | 0 |
| Quadrant | Total seconds | Saturated seconds | Saturation percentage |
|---|---|---|---|
| A | 45089 | 2714 | 6.019206% |
| B | 45142 | 2292 | 5.077312% |
| C | 45198 | 182 | 0.402673% |
| D | 44900 | 3386 | 7.541203% |
Noise dominated data is calculated using 1-second bins in cleaned event files. If a bin has >2000 counts, and if more than 50% of those come from <1% of pixels, then it is considered to be noise-dominated and hence unusable.
| Quadrant | # 1 sec bins | Bins with >0 counts | Bins with >2000 counts | High rate bins dominated by noise | Noise dominated (total time) | Noise dominated (detector-on time) | Marked lightcurve |
|---|---|---|---|---|---|---|---|
| A | 50294 | 45488 | 0 | 0 | 0.00% | 0.00% |  |
| B | 50294 | 45521 | 0 | 0 | 0.00% | 0.00% |  |
| C | 50294 | 45534 | 0 | 0 | 0.00% | 0.00% | 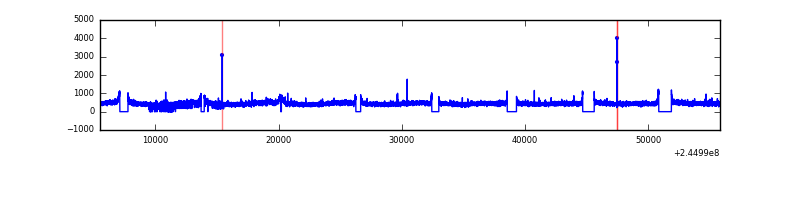 |
| D | 50294 | 45149 | 0 | 0 | 0.00% | 0.00% |  |
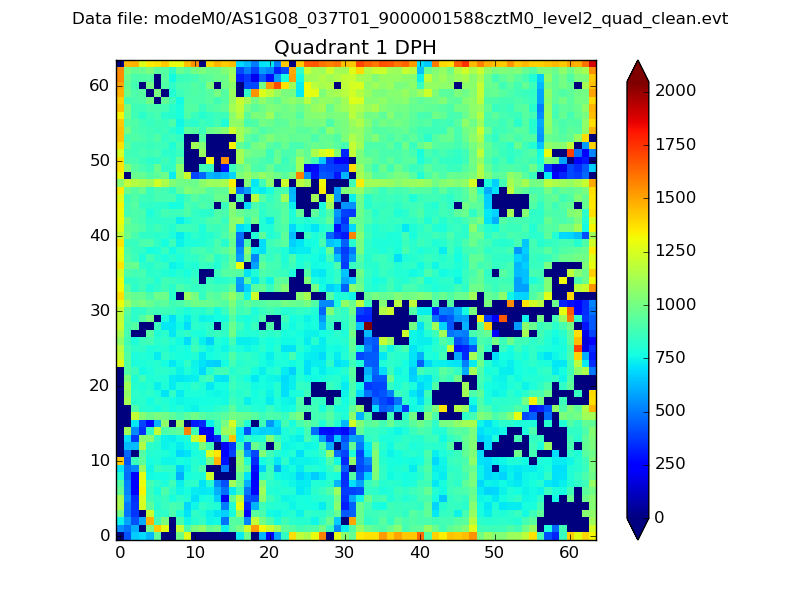
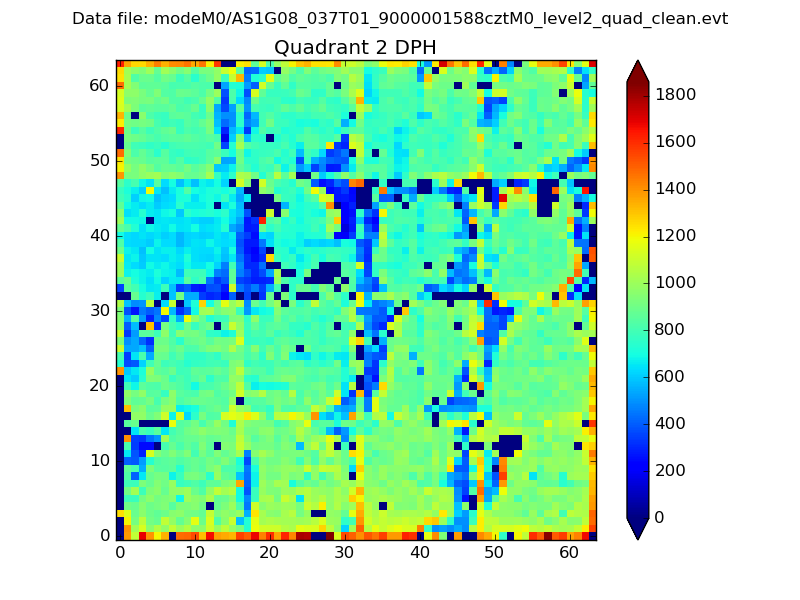
Top three noisy pixels from each quadrant. If the there are fewer than three noisy pixels in the level2.evt file, extra rows are filled as -1
| Pixel properties | Quadrant properties | ||||||
|---|---|---|---|---|---|---|---|
| Quadrant | DetID | PixID | Counts | Sigma | Mean | Median | Sigma |
| A | 0 | 29 | 2376 | 11.16 | 628 | 585 | 160.5 |
| A | 7 | 110 | 2032 | 9.01 | 628 | 585 | 160.5 |
| A | 0 | 30 | 1902 | 8.2 | 628 | 585 | 160.5 |
| B | 2 | 9 | 2135 | 12.28 | 622 | 591 | 125.8 |
| B | 3 | 17 | 1625 | 8.22 | 622 | 591 | 125.8 |
| B | 12 | 226 | 1579 | 7.86 | 622 | 591 | 125.8 |
| C | 12 | 241 | 1715 | 6.49 | 650 | 600 | 171.7 |
| C | 9 | 242 | 1653 | 6.13 | 650 | 600 | 171.7 |
| C | 2 | 191 | 1618 | 5.93 | 650 | 600 | 171.7 |
| D | 6 | 231 | 1505 | 6.22 | 581 | 526 | 157.4 |
| D | 3 | 14 | 1490 | 6.13 | 581 | 526 | 157.4 |
| D | 3 | 31 | 1473 | 6.02 | 581 | 526 | 157.4 |
Histogram calculated using DETX and DETY for each event in the final _common_clean file
| Quadrant A |  |
 |
Quadrant B |
|---|---|---|---|
| Quadrant D | 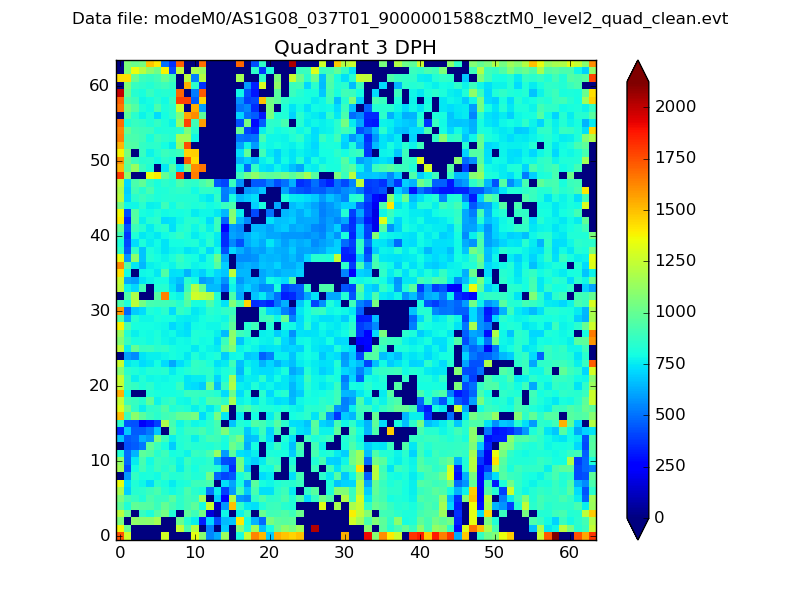 |
 |
Quadrant C |
| Plot type | Count rate plots | Images |
|---|---|---|
| Comparison with Poisson distribution Blue bars denote a histogram of data divided into 1 sec bins. Red curve is a Poisson curve with rate = median count rate of data. |
 |
 |
| Quadrant-wise count rates Data is divided into 100 sec bins |
 |
|
| Module-wise count rates for Quadrant A Data is divided into 100 sec bins |
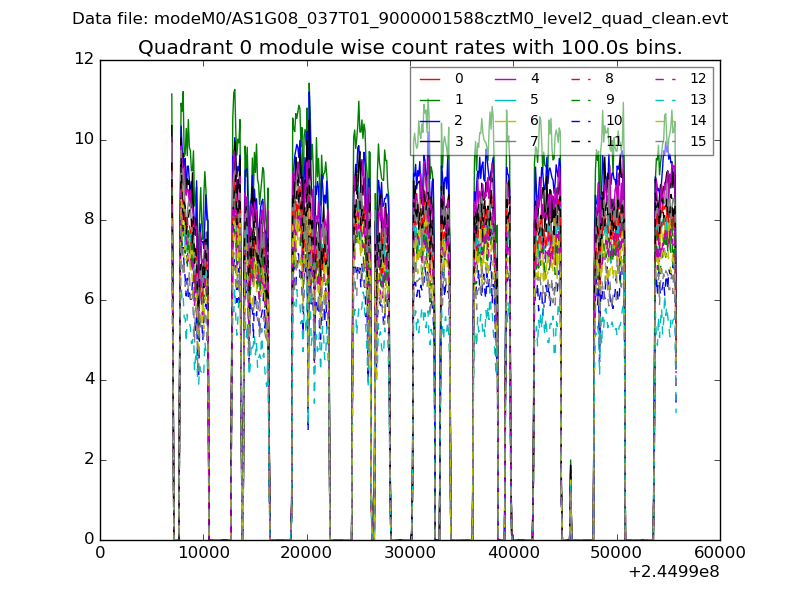 |
 |
| Module-wise count rates for Quadrant B Data is divided into 100 sec bins |
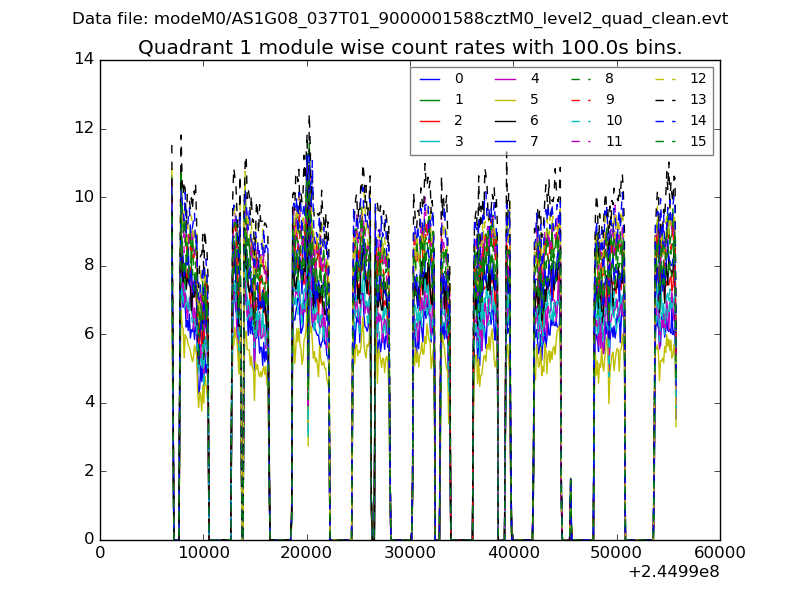 |
 |
| Module-wise count rates for Quadrant C Data is divided into 100 sec bins |
 |
 |
| Module-wise count rates for Quadrant D Data is divided into 100 sec bins |
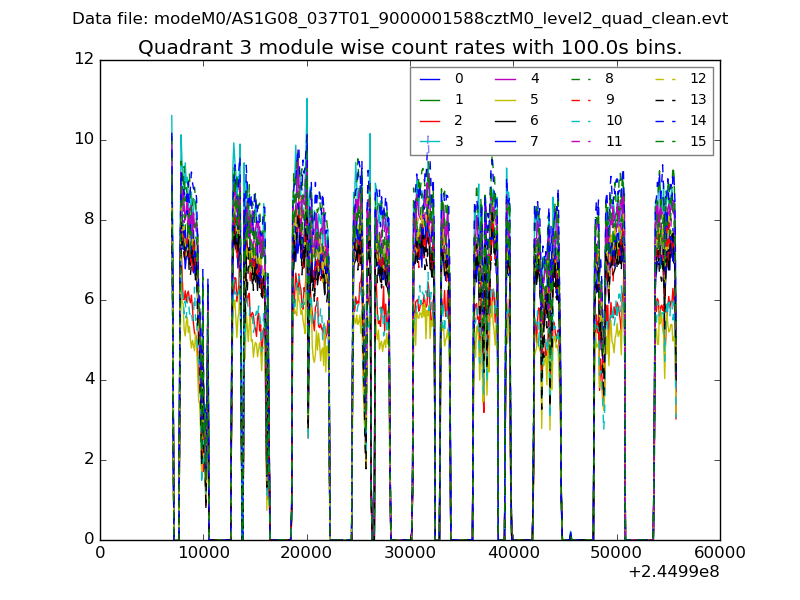 |
 |
| Parameter | Plot |
|---|---|
| CZT HV Monitor |  |
| D_VDD |  |
| Temperature 1 | 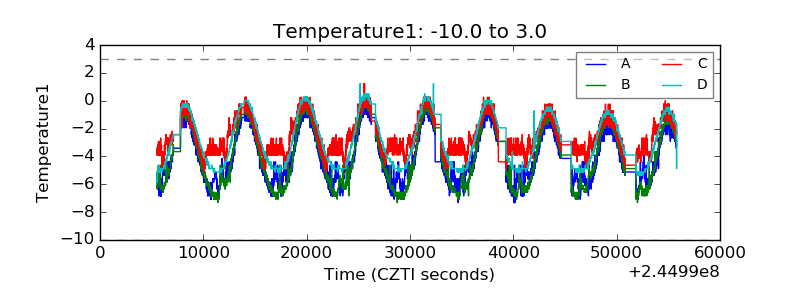 |
| Veto HV Monitor |  |
| Veto LLD |  |
| Alpha Counter |  |
| _CPM_Rate | 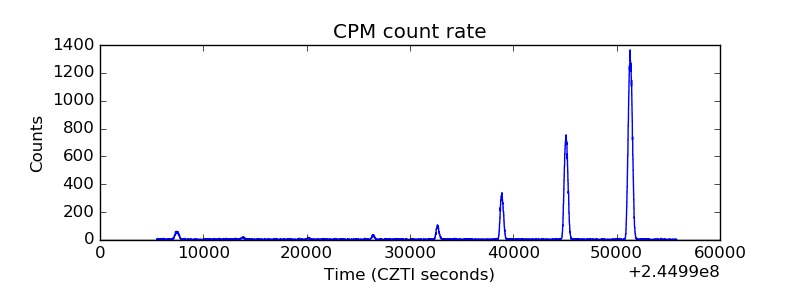 |
| CZT Counter | 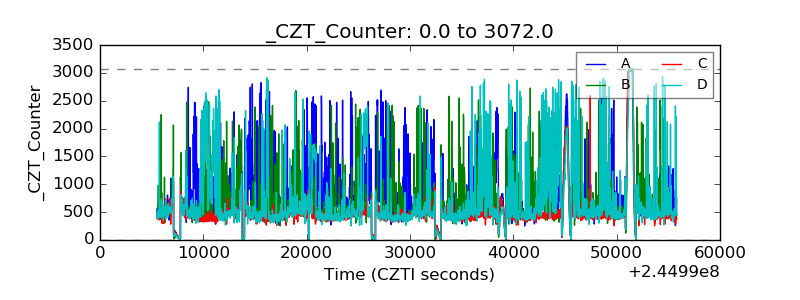 |
| +2.5 Volts monitor |  |
| +5 Volts monitor |  |
| _ROLL_ROT |  |
| _Roll_DEC |  |
| _Roll_RA |  |
| Veto Counter |  |