| Param | Original file | Final file |
|---|---|---|
| Filename | modeM0/AS1G08_037T01_9000001588_10946cztM0_level2.evt | modeM0/AS1G08_037T01_9000001588_10946cztM0_level2_quad_clean.evt |
| Size (bytes) | 536,806,080 | 78,615,360 |
| Size | 511.9 MB | 75.0 MB |
| Events in quadrant A | 4,852,522 | 480,550 |
| Events in quadrant B | 4,022,429 | 510,607 |
| Events in quadrant C | 2,782,340 | 515,025 |
| Events in quadrant D | 4,188,836 | 451,235 |
| Mode M0 | |||
|---|---|---|---|
| Quadrant | BADHDUFLAG | Total packets | Discarded packets |
| A | 0 | 20896 | 2387 |
| B | 0 | 17667 | 1583 |
| C | 0 | 13712 | 1034 |
| D | 0 | 20045 | 3678 |
| Mode SS | |||
|---|---|---|---|
| Quadrant | BADHDUFLAG | Total packets | Discarded packets |
| A | 0 | 136 | 4 |
| B | 0 | 136 | 8 |
| C | 0 | 136 | 10 |
| D | 0 | 136 | 8 |
| Mode M9 | |||
|---|---|---|---|
| Quadrant | BADHDUFLAG | Total packets | Discarded packets |
| A | 0 | 2 | 0 |
| B | 0 | 2 | 0 |
| C | 0 | 2 | 0 |
| D | 0 | 2 | 0 |
| Quadrant | Total seconds | Saturated seconds | Saturation percentage |
|---|---|---|---|
| A | 5984 | 471 | 7.870989% |
| B | 6096 | 284 | 4.658793% |
| C | 6153 | 18 | 0.292540% |
| D | 5874 | 482 | 8.205652% |
Noise dominated data is calculated using 1-second bins in cleaned event files. If a bin has >2000 counts, and if more than 50% of those come from <1% of pixels, then it is considered to be noise-dominated and hence unusable.
| Quadrant | # 1 sec bins | Bins with >0 counts | Bins with >2000 counts | High rate bins dominated by noise | Noise dominated (total time) | Noise dominated (detector-on time) | Marked lightcurve |
|---|---|---|---|---|---|---|---|
| A | 6926 | 6515 | 246 | 246 | 3.55% | 3.78% | 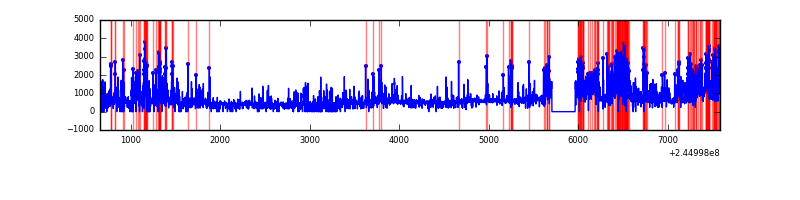 |
| B | 6926 | 6566 | 133 | 133 | 1.92% | 2.03% | 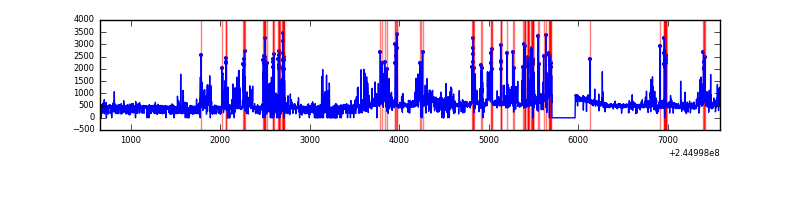 |
| C | 6925 | 6577 | 1 | 1 | 0.01% | 0.02% | 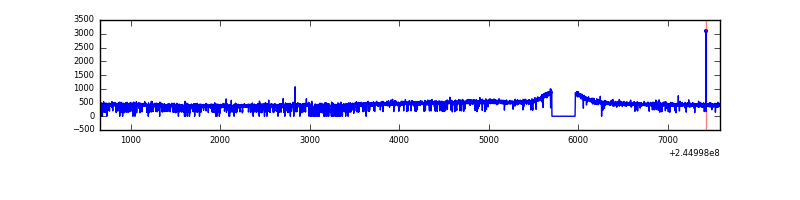 |
| D | 6926 | 6353 | 344 | 344 | 4.97% | 5.41% | 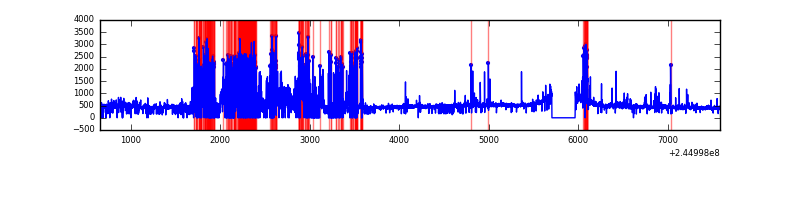 |
Top three noisy pixels from each quadrant. If the there are fewer than three noisy pixels in the level2.evt file, extra rows are filled as -1
| Pixel properties | Quadrant properties | ||||||
|---|---|---|---|---|---|---|---|
| Quadrant | DetID | PixID | Counts | Sigma | Mean | Median | Sigma |
| A | 8 | 5 | 1586346 | 11095.35 | 698 | 687 | 142.9 |
| A | 14 | 238 | 313944 | 2191.96 | 698 | 687 | 142.9 |
| A | 8 | 15 | 137067 | 954.29 | 698 | 687 | 142.9 |
| B | 4 | 239 | 1054806 | 7530.1 | 721 | 701 | 140.0 |
| B | 0 | 214 | 34040 | 238.16 | 721 | 701 | 140.0 |
| B | 0 | 187 | 26048 | 181.07 | 721 | 701 | 140.0 |
| C | 13 | 61 | 5440 | 28.41 | 710 | 715 | 166.3 |
| C | 8 | 222 | 4794 | 24.53 | 710 | 715 | 166.3 |
| C | 14 | 128 | 3614 | 17.43 | 710 | 715 | 166.3 |
| D | 13 | 152 | 1466456 | 9090.21 | 657 | 639 | 161.3 |
| D | 5 | 222 | 53127 | 325.5 | 657 | 639 | 161.3 |
| D | 1 | 52 | 38962 | 237.66 | 657 | 639 | 161.3 |
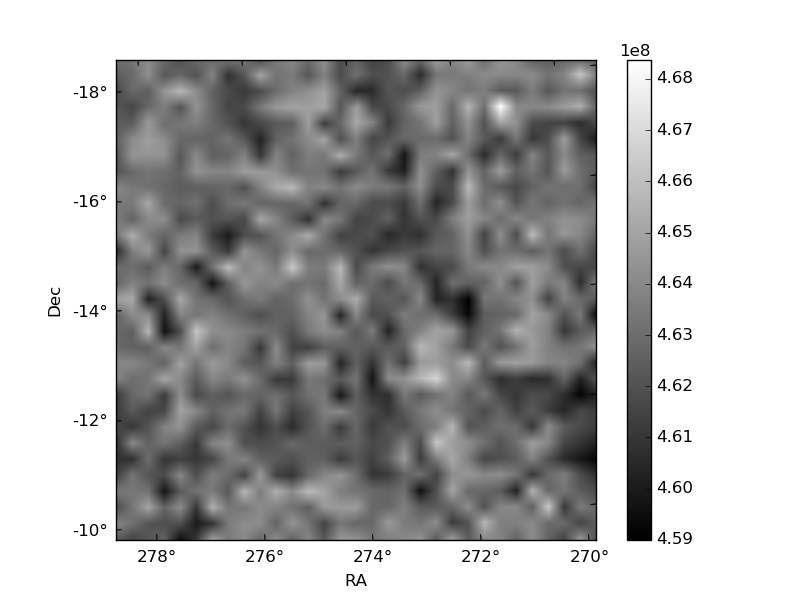
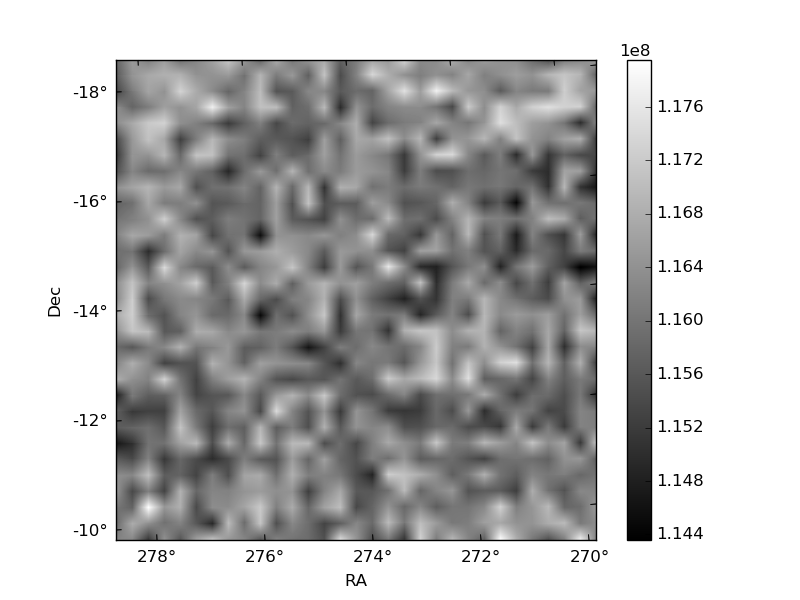
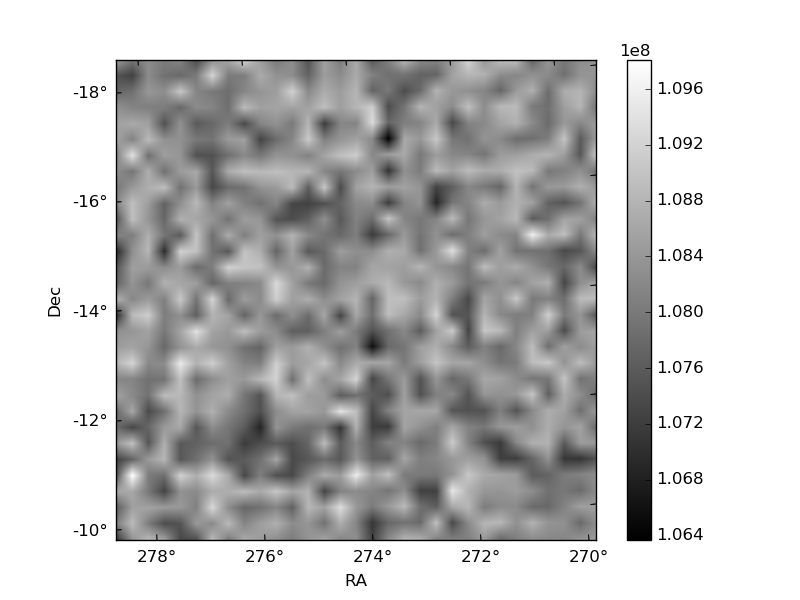
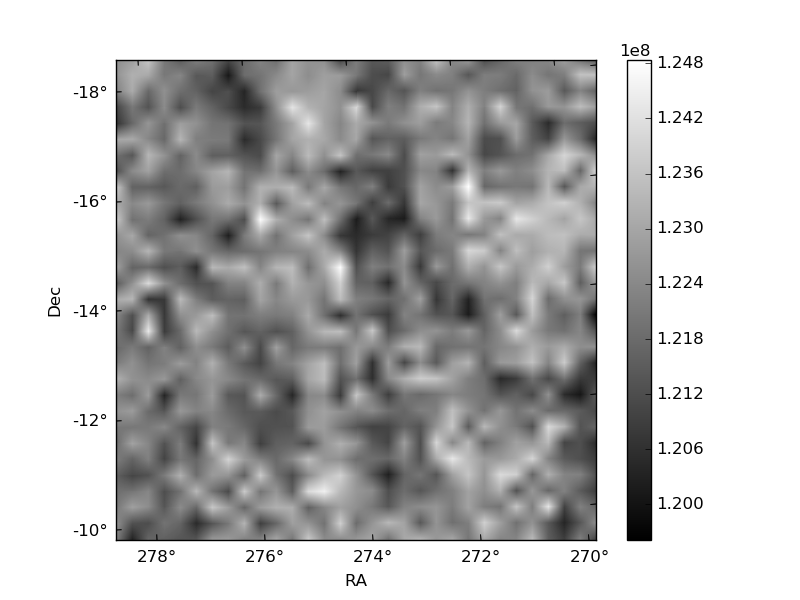
Histogram calculated using DETX and DETY for each event in the final _common_clean file
| Quadrant A | 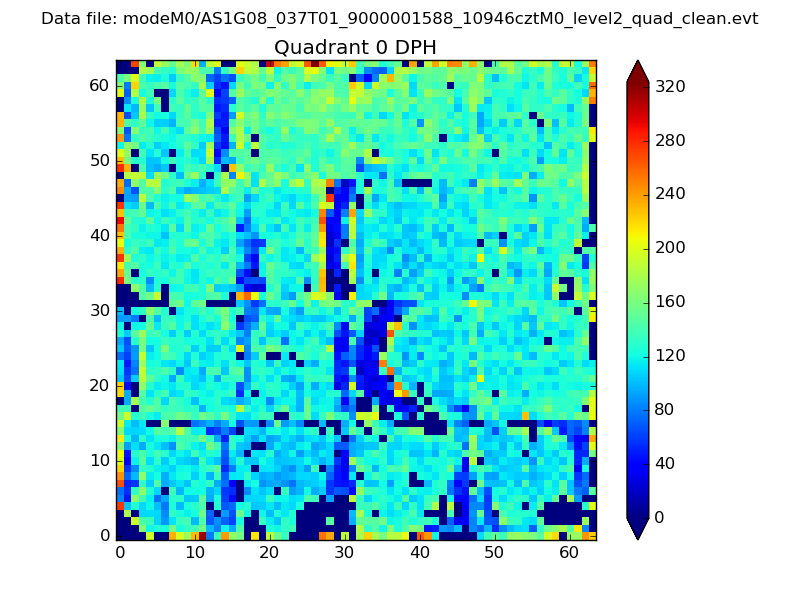 |
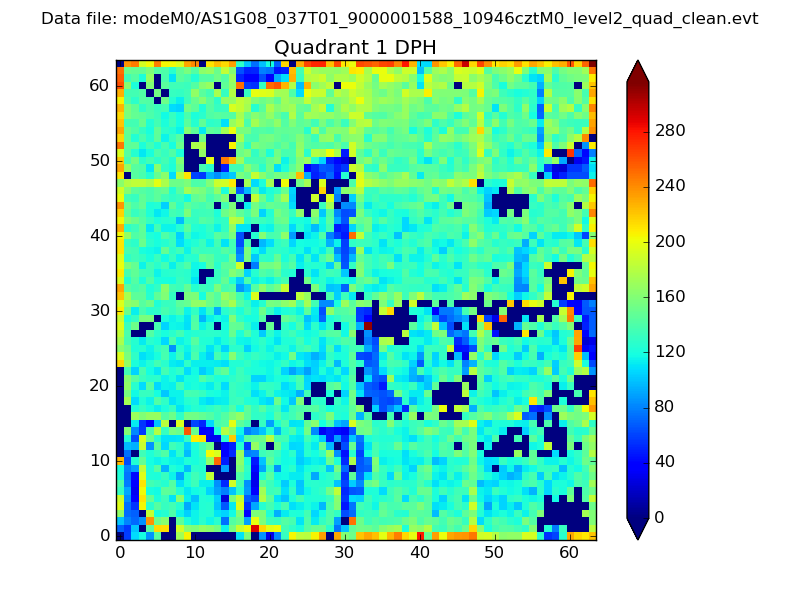 |
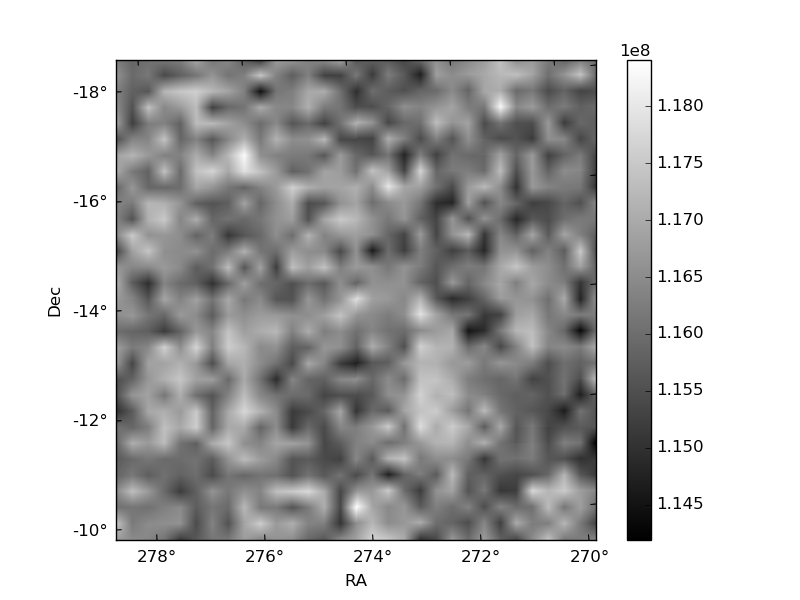
Quadrant B |
|---|---|---|---|
| Quadrant D | 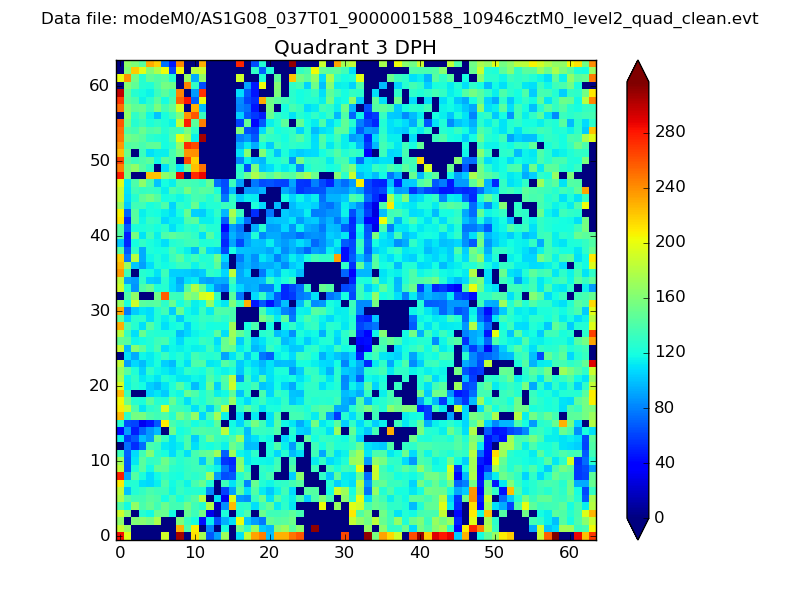 |
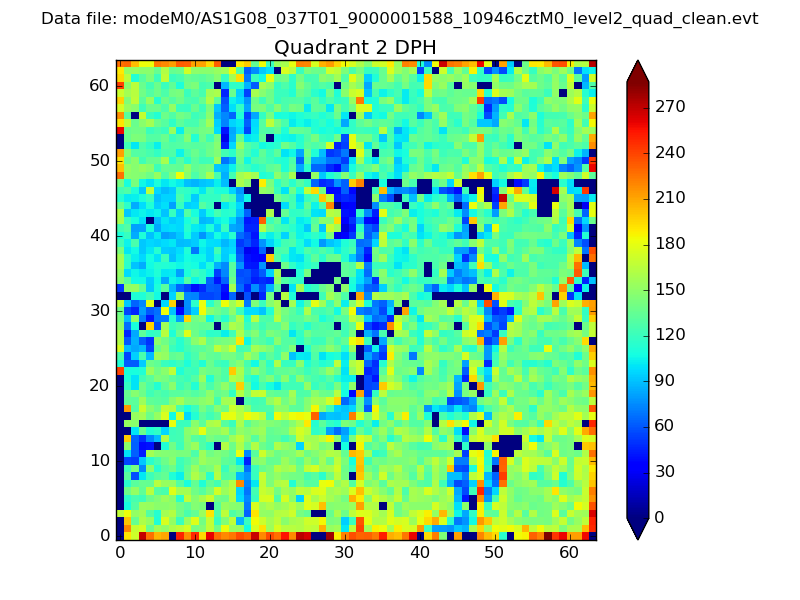 |
Quadrant C |
| Plot type | Count rate plots | Images |
|---|---|---|
| Comparison with Poisson distribution Blue bars denote a histogram of data divided into 1 sec bins. Red curve is a Poisson curve with rate = median count rate of data. |
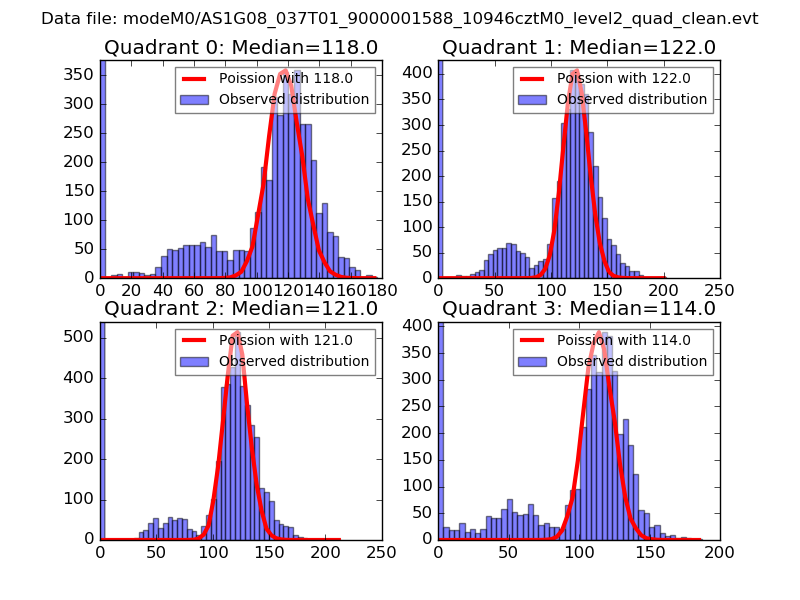 |
 |
| Quadrant-wise count rates Data is divided into 100 sec bins |
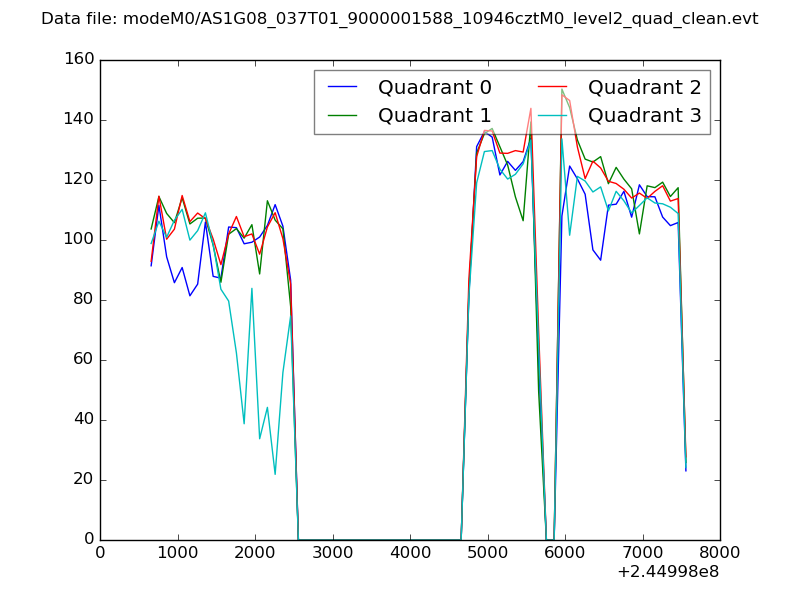 |
|
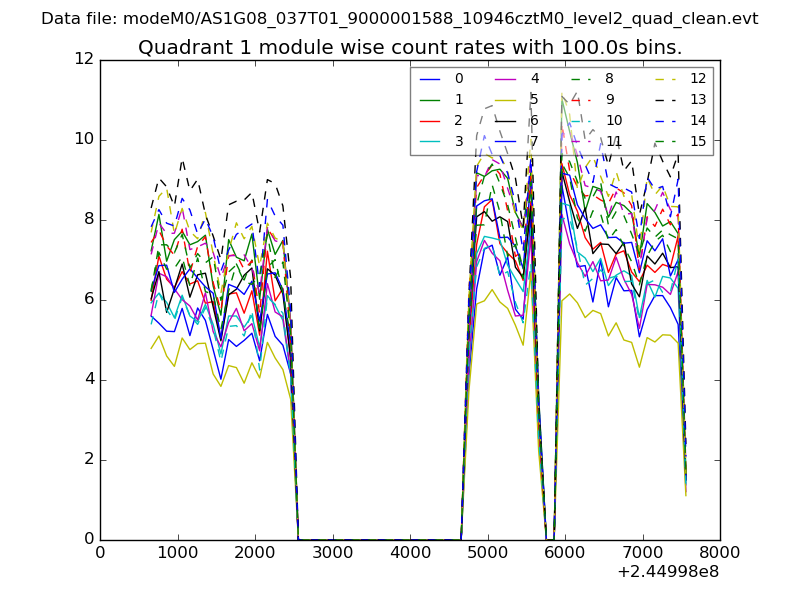
| Module-wise count rates for Quadrant A Data is divided into 100 sec bins |
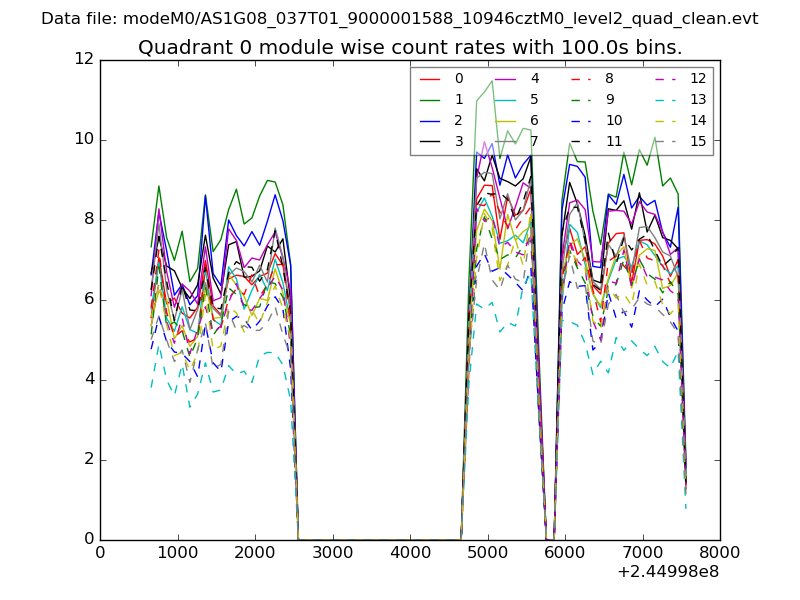 |
 |
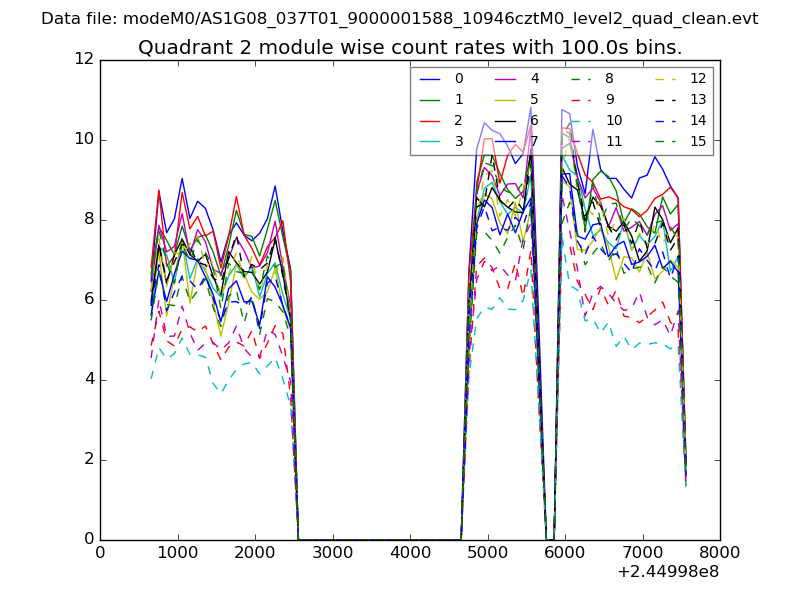
| Module-wise count rates for Quadrant B Data is divided into 100 sec bins |
 |
 |
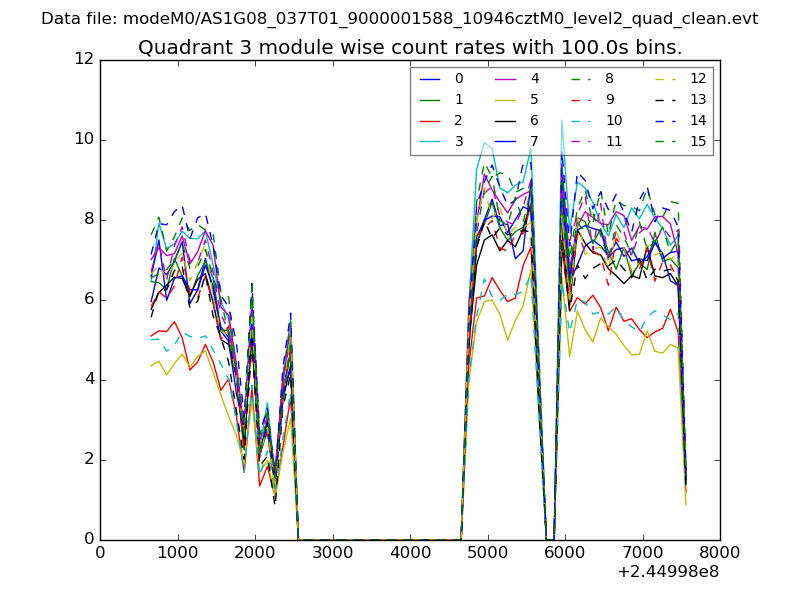
| Module-wise count rates for Quadrant C Data is divided into 100 sec bins |
 |
 |
| Module-wise count rates for Quadrant D Data is divided into 100 sec bins |
 |
 |
| Parameter | Plot |
|---|---|
| CZT HV Monitor | 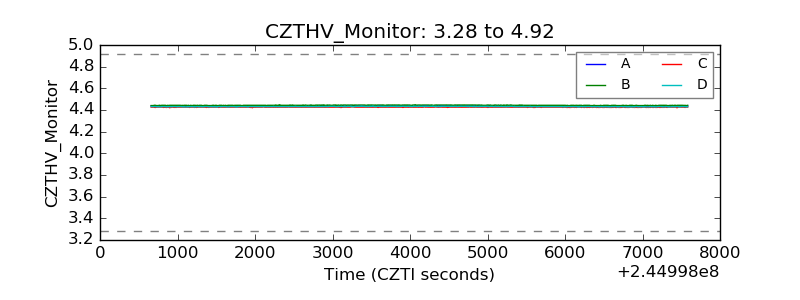 |
| D_VDD |  |
| Temperature 1 | 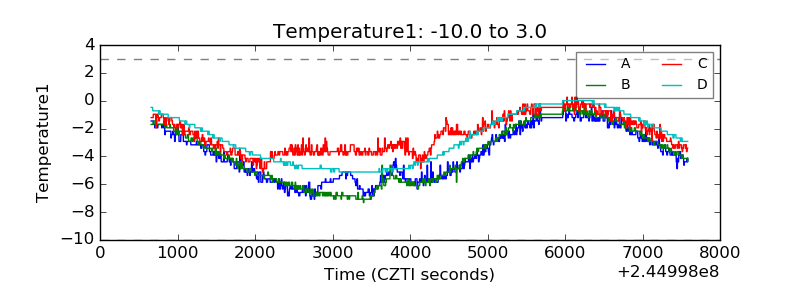 |
| Veto HV Monitor |  |
| Veto LLD | 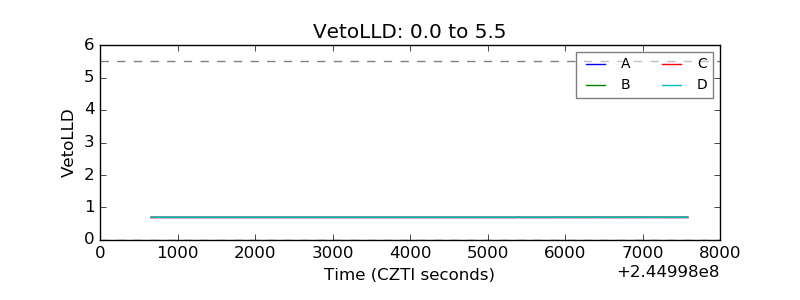 |
| Alpha Counter | 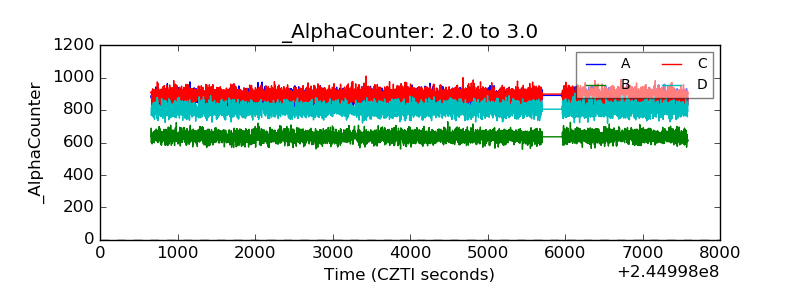 |
| _CPM_Rate | 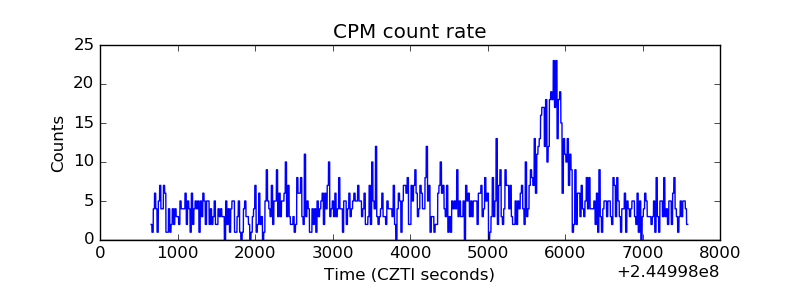 |
| CZT Counter | 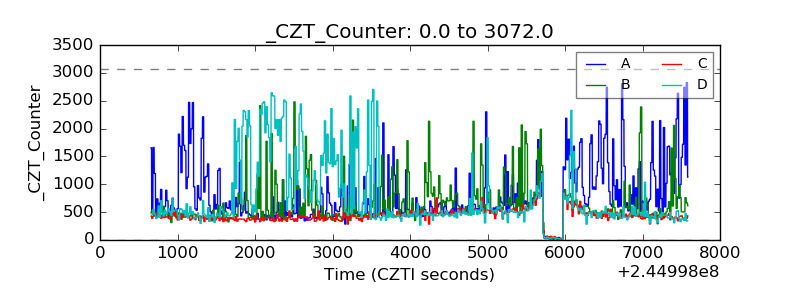 |
| +2.5 Volts monitor |  |
| +5 Volts monitor |  |
| _ROLL_ROT | 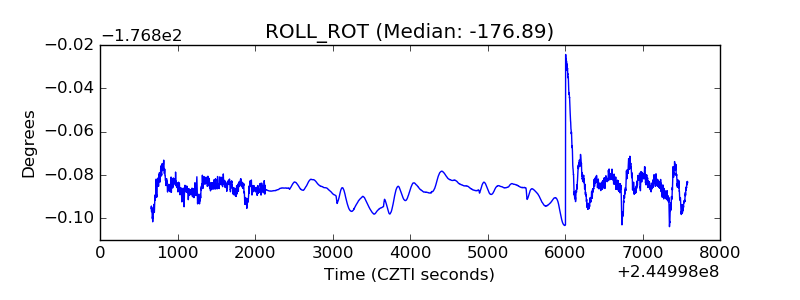 |
| _Roll_DEC | 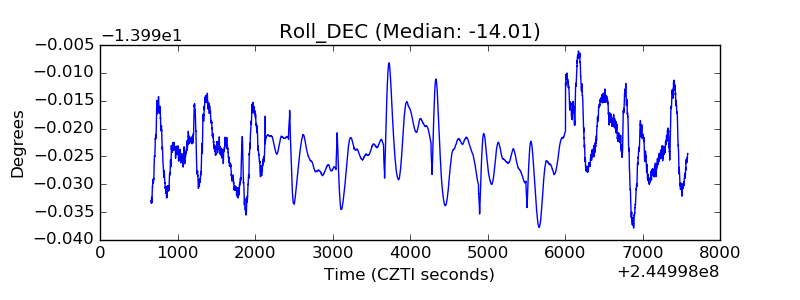 |
| _Roll_RA |  |
| Veto Counter | 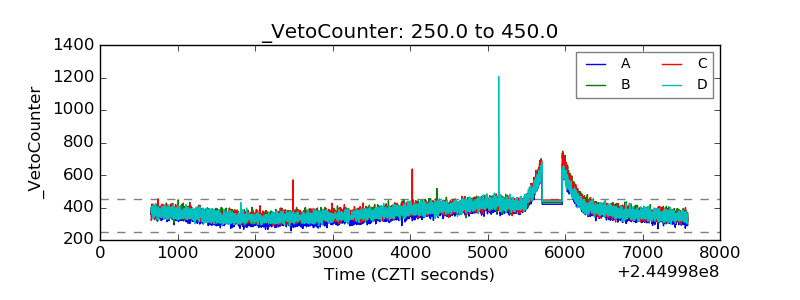 |