| Param | Original file | Final file |
|---|---|---|
| Filename | modeM0/AS1G08_037T01_9000001588_10948cztM0_level2.evt | modeM0/AS1G08_037T01_9000001588_10948cztM0_level2_quad_clean.evt |
| Size (bytes) | 611,504,640 | 86,348,160 |
| Size | 583.2 MB | 82.3 MB |
| Events in quadrant A | 6,734,210 | 524,280 |
| Events in quadrant B | 4,195,095 | 553,787 |
| Events in quadrant C | 3,006,470 | 552,000 |
| Events in quadrant D | 4,115,876 | 502,908 |
| Mode M0 | |||
|---|---|---|---|
| Quadrant | BADHDUFLAG | Total packets | Discarded packets |
| A | 0 | 24838 | 2 |
| B | 0 | 17015 | 1 |
| C | 0 | 13960 | 1 |
| D | 0 | 17205 | 1 |
| Mode SS | |||
|---|---|---|---|
| Quadrant | BADHDUFLAG | Total packets | Discarded packets |
| A | 0 | 140 | 0 |
| B | 0 | 140 | 0 |
| C | 0 | 140 | 0 |
| D | 0 | 140 | 0 |
| Mode M9 | |||
|---|---|---|---|
| Quadrant | BADHDUFLAG | Total packets | Discarded packets |
| A | 0 | 4 | 0 |
| B | 0 | 4 | 0 |
| C | 0 | 4 | 0 |
| D | 0 | 4 | 0 |
| Quadrant | Total seconds | Saturated seconds | Saturation percentage |
|---|---|---|---|
| A | 6910 | 650 | 9.406657% |
| B | 6910 | 240 | 3.473227% |
| C | 6910 | 2 | 0.028944% |
| D | 6910 | 398 | 5.759768% |
Noise dominated data is calculated using 1-second bins in cleaned event files. If a bin has >2000 counts, and if more than 50% of those come from <1% of pixels, then it is considered to be noise-dominated and hence unusable.
| Quadrant | # 1 sec bins | Bins with >0 counts | Bins with >2000 counts | High rate bins dominated by noise | Noise dominated (total time) | Noise dominated (detector-on time) | Marked lightcurve |
|---|---|---|---|---|---|---|---|
| A | 7305 | 6910 | 414 | 414 | 5.67% | 5.99% | 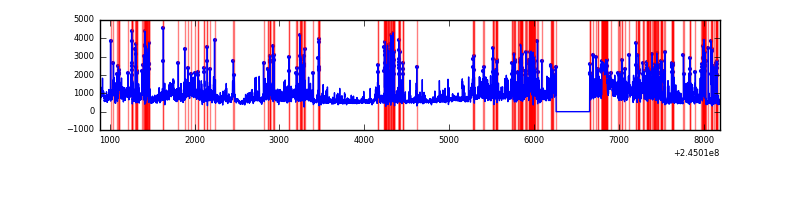 |
| B | 7305 | 6911 | 135 | 135 | 1.85% | 1.95% | 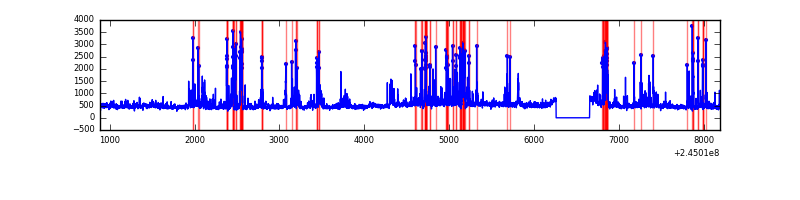 |
| C | 7305 | 6911 | 0 | 0 | 0.00% | 0.00% | 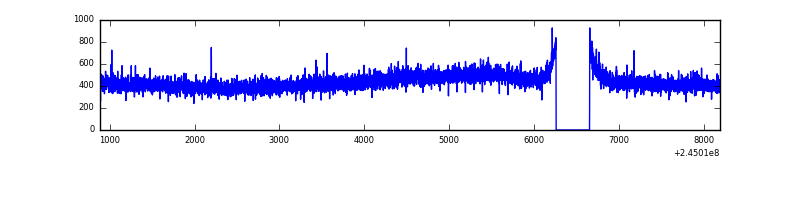 |
| D | 7305 | 6911 | 241 | 241 | 3.30% | 3.49% | 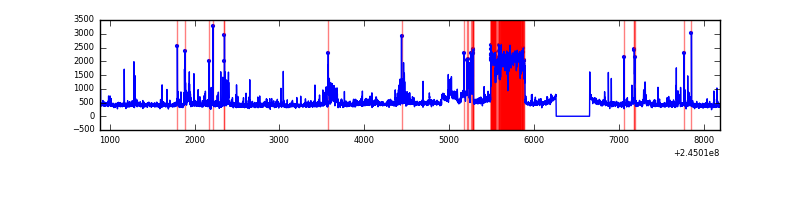 |
Top three noisy pixels from each quadrant. If the there are fewer than three noisy pixels in the level2.evt file, extra rows are filled as -1
| Pixel properties | Quadrant properties | ||||||
|---|---|---|---|---|---|---|---|
| Quadrant | DetID | PixID | Counts | Sigma | Mean | Median | Sigma |
| A | 8 | 5 | 2113826 | 13579.75 | 763 | 746 | 155.6 |
| A | 8 | 15 | 1305708 | 8386.36 | 763 | 746 | 155.6 |
| A | 14 | 238 | 229216 | 1468.27 | 763 | 746 | 155.6 |
| B | 4 | 239 | 928534 | 6038.11 | 791 | 771 | 153.7 |
| B | 0 | 219 | 61184 | 393.18 | 791 | 771 | 153.7 |
| B | 0 | 214 | 37103 | 236.46 | 791 | 771 | 153.7 |
| C | 13 | 61 | 5822 | 28.14 | 767 | 770 | 179.6 |
| C | 5 | 37 | 4581 | 21.22 | 767 | 770 | 179.6 |
| C | 8 | 222 | 4200 | 19.1 | 767 | 770 | 179.6 |
| D | 13 | 152 | 835820 | 4648.3 | 739 | 718 | 179.7 |
| D | 5 | 222 | 215374 | 1194.81 | 739 | 718 | 179.7 |
| D | 1 | 52 | 88439 | 488.27 | 739 | 718 | 179.7 |
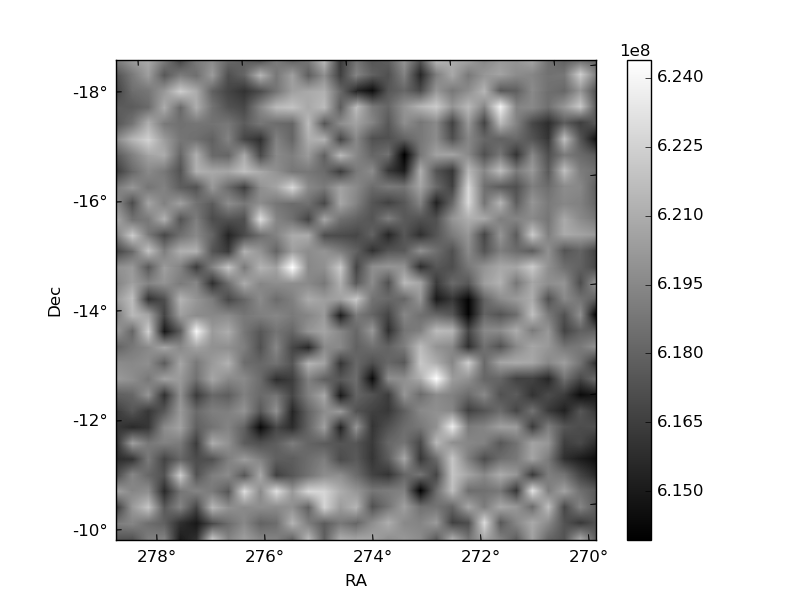
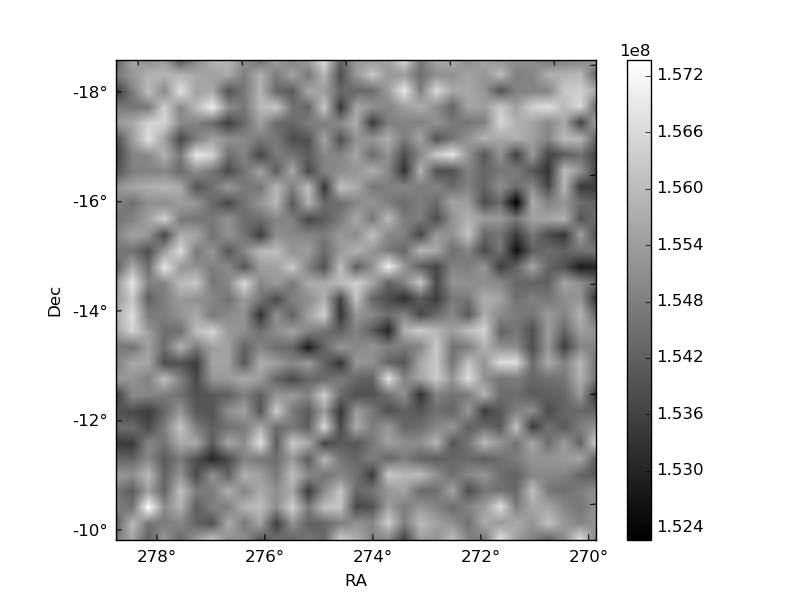
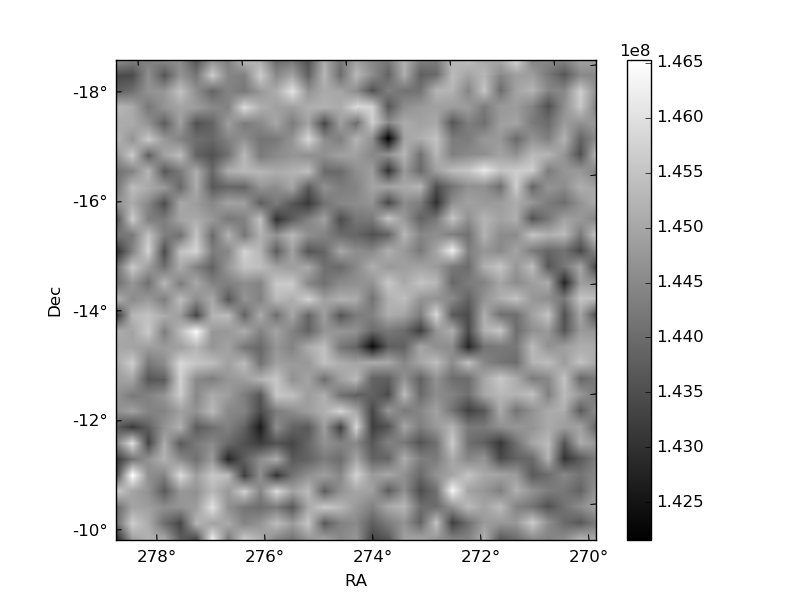
Histogram calculated using DETX and DETY for each event in the final _common_clean file
| Quadrant A | 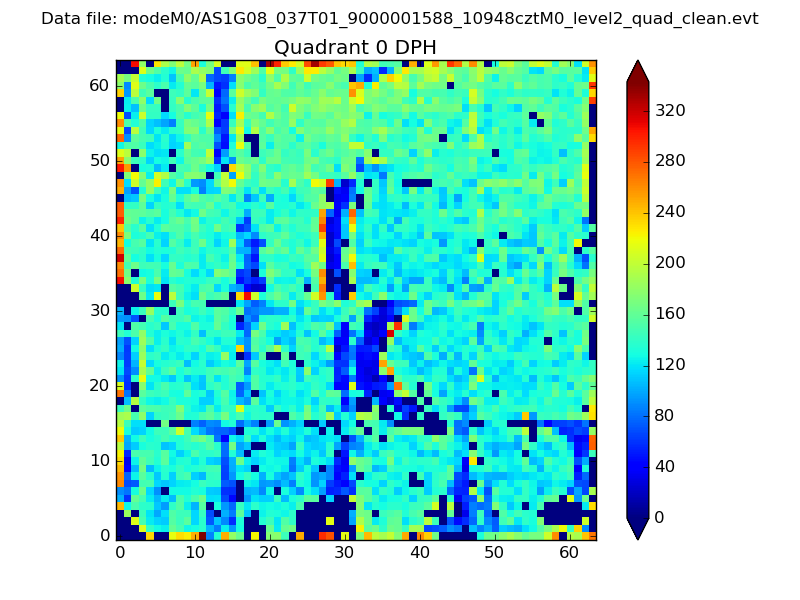 |
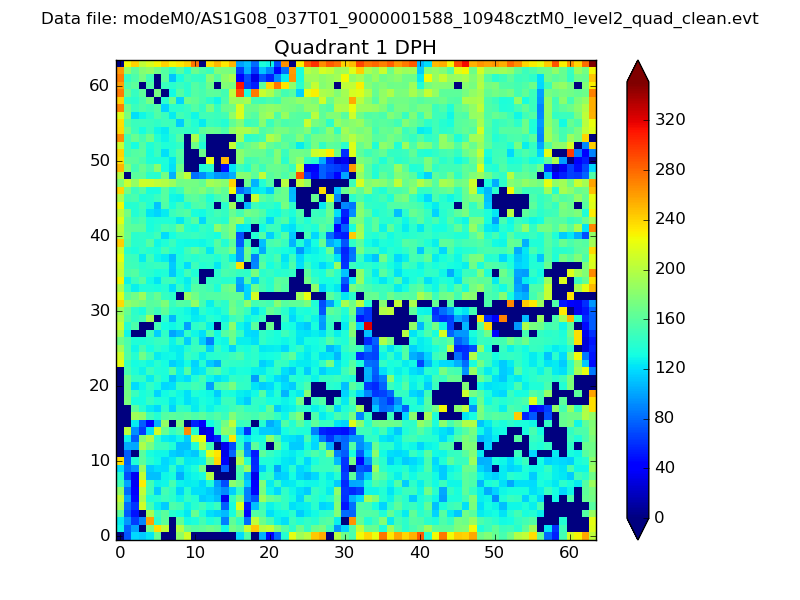 |
Quadrant B |
|---|---|---|---|
| Quadrant D | 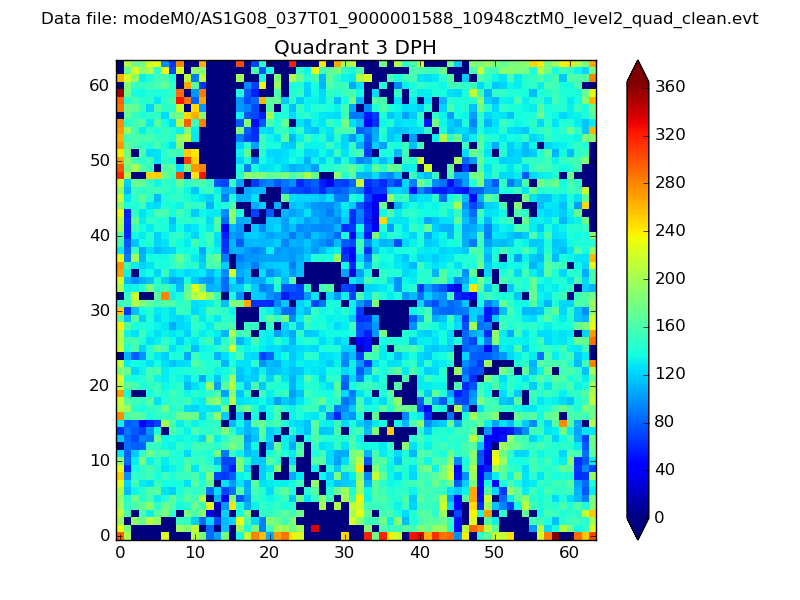 |
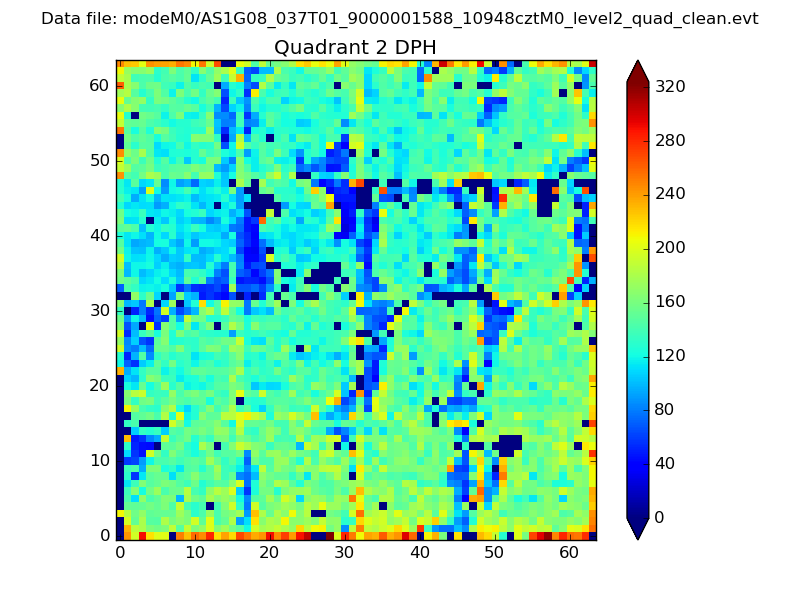 |
Quadrant C |
| Plot type | Count rate plots | Images |
|---|---|---|
| Comparison with Poisson distribution Blue bars denote a histogram of data divided into 1 sec bins. Red curve is a Poisson curve with rate = median count rate of data. |
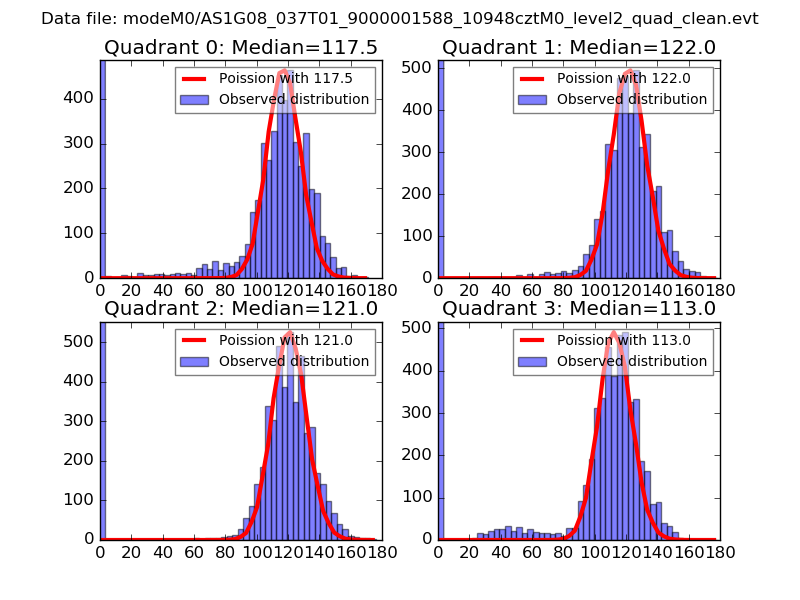 |
 |
| Quadrant-wise count rates Data is divided into 100 sec bins |
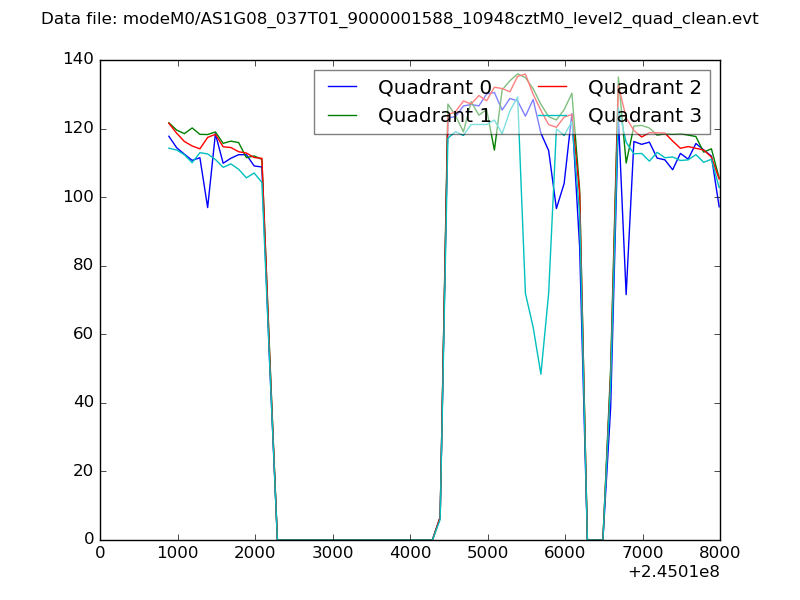 |
|
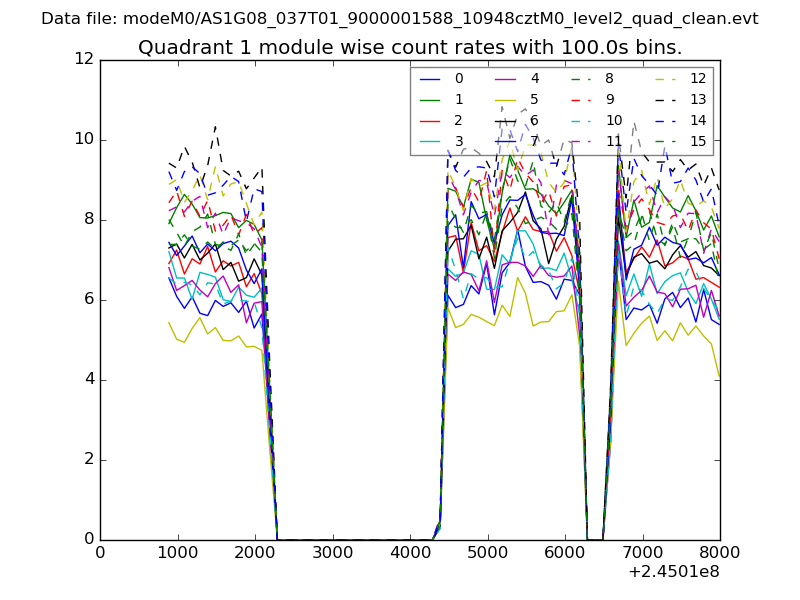
| Module-wise count rates for Quadrant A Data is divided into 100 sec bins |
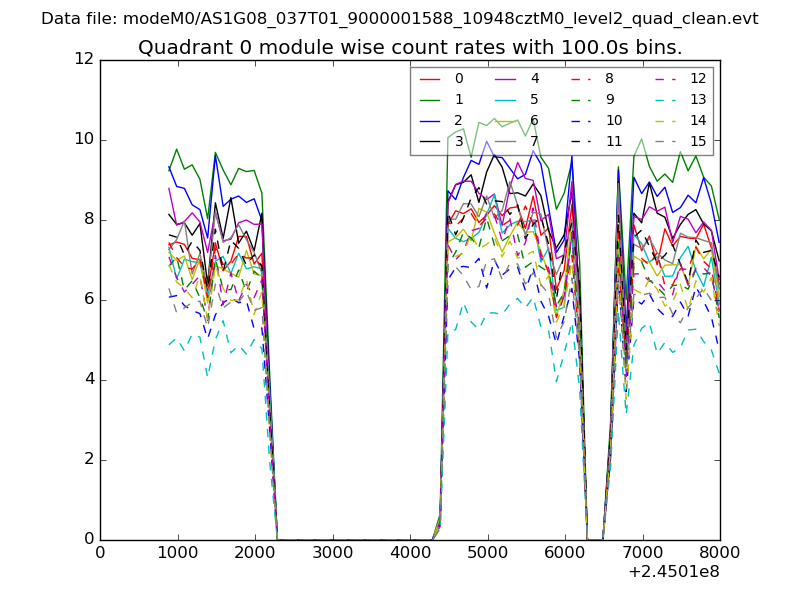 |
 |
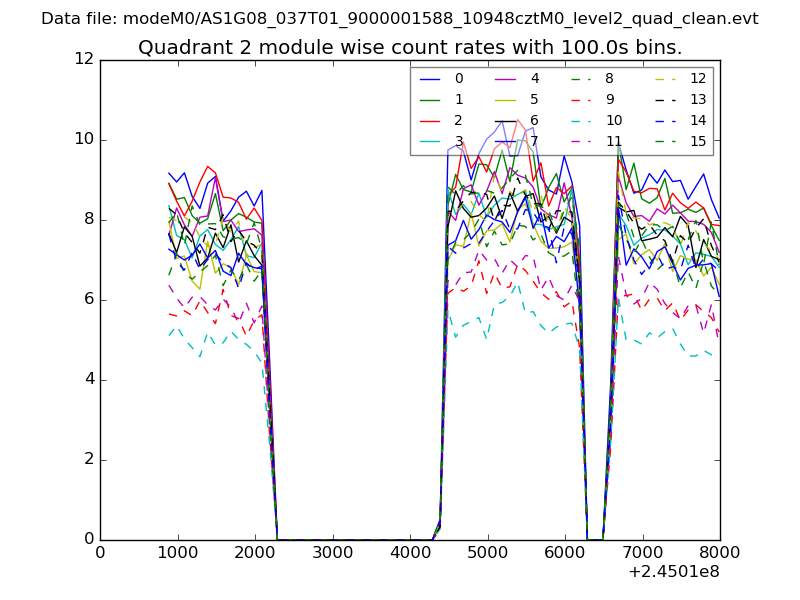
| Module-wise count rates for Quadrant B Data is divided into 100 sec bins |
 |
 |
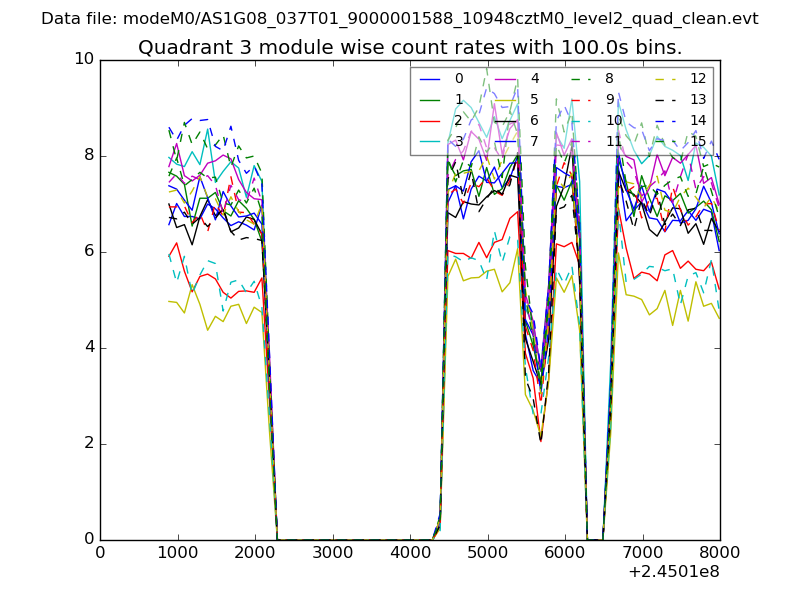
| Module-wise count rates for Quadrant C Data is divided into 100 sec bins |
 |
 |
| Module-wise count rates for Quadrant D Data is divided into 100 sec bins |
 |
 |
| Parameter | Plot |
|---|---|
| CZT HV Monitor | 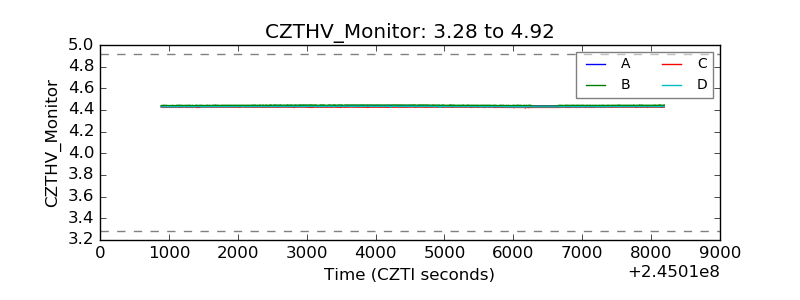 |
| D_VDD | 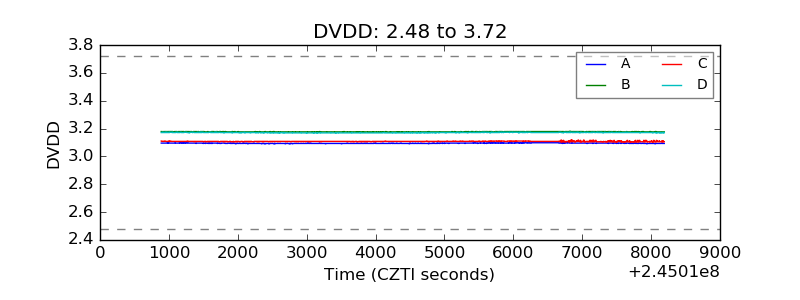 |
| Temperature 1 | 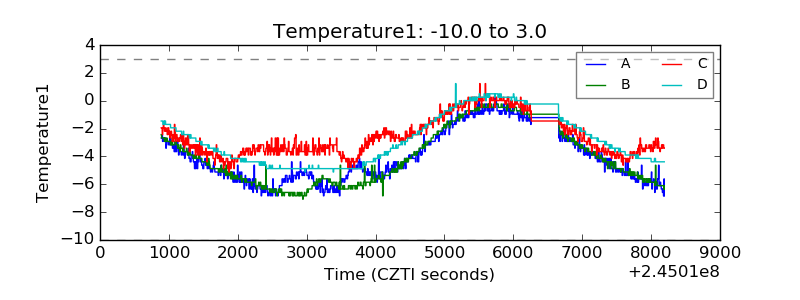 |
| Veto HV Monitor | 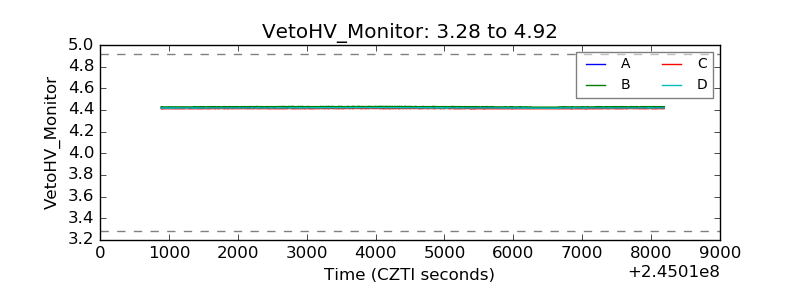 |
| Veto LLD | 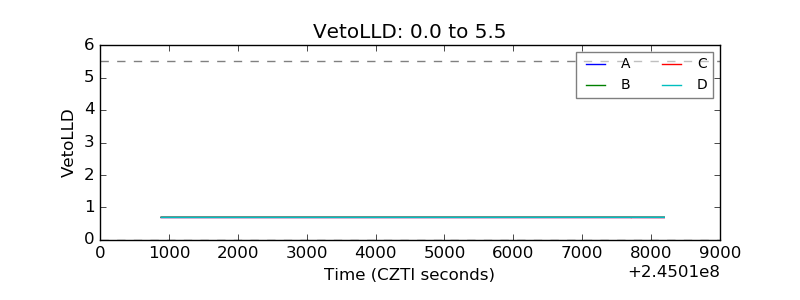 |
| Alpha Counter | 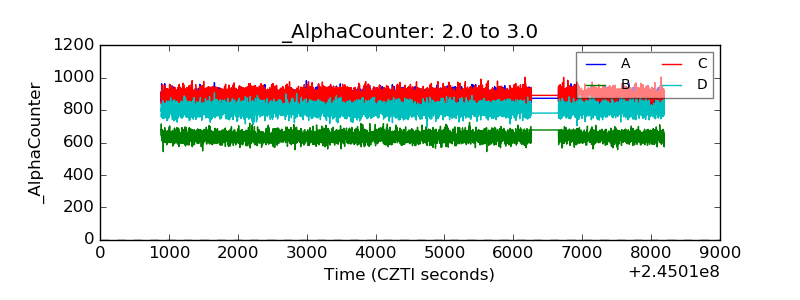 |
| _CPM_Rate | 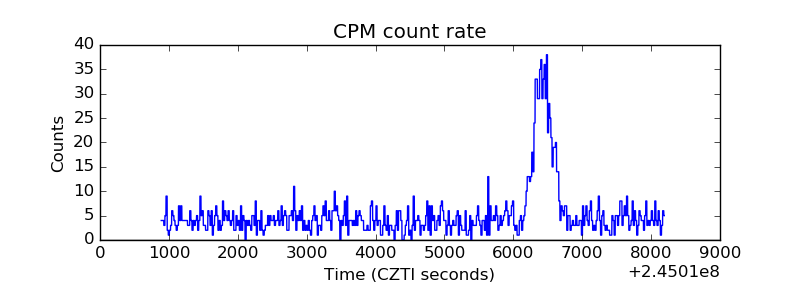 |
| CZT Counter | 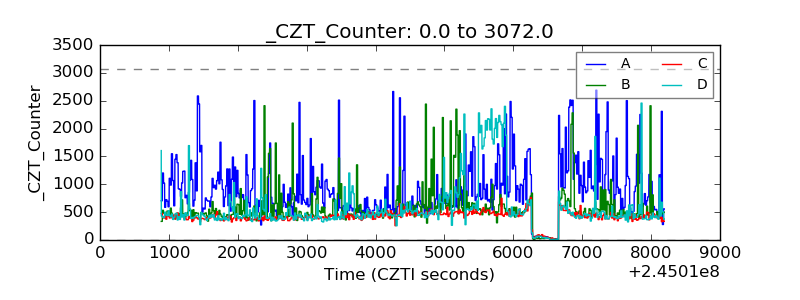 |
| +2.5 Volts monitor | 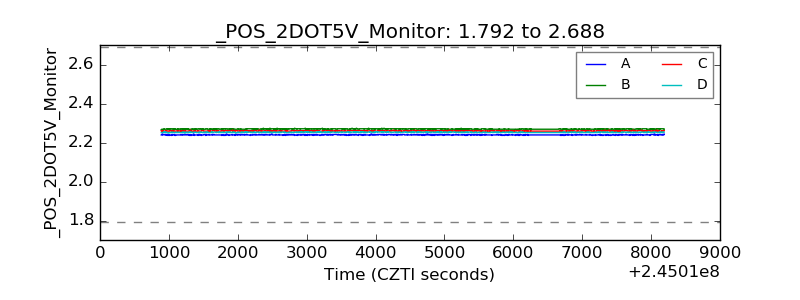 |
| +5 Volts monitor |  |
| _ROLL_ROT | 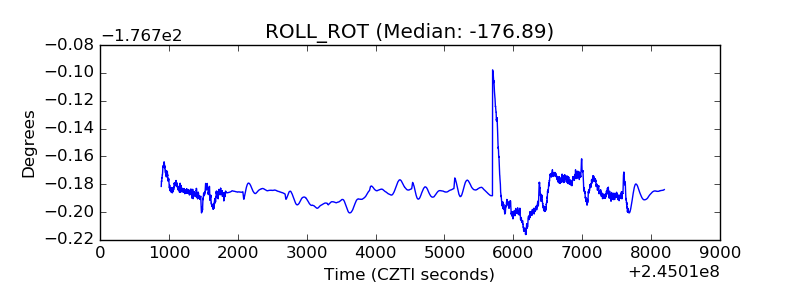 |
| _Roll_DEC | 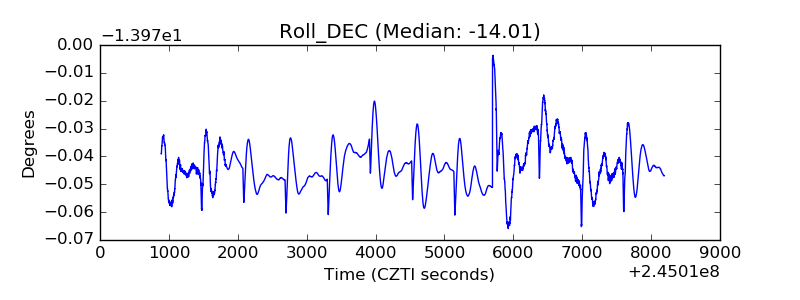 |
| _Roll_RA | 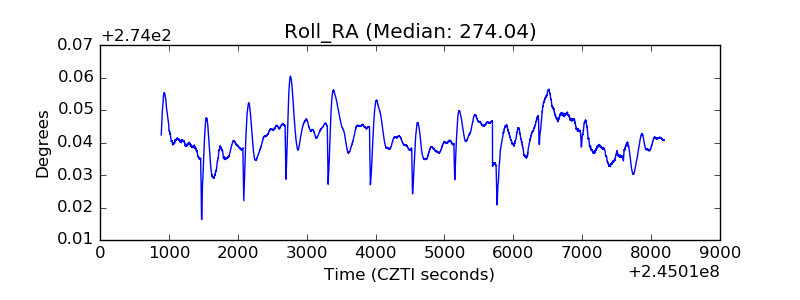 |
| Veto Counter | 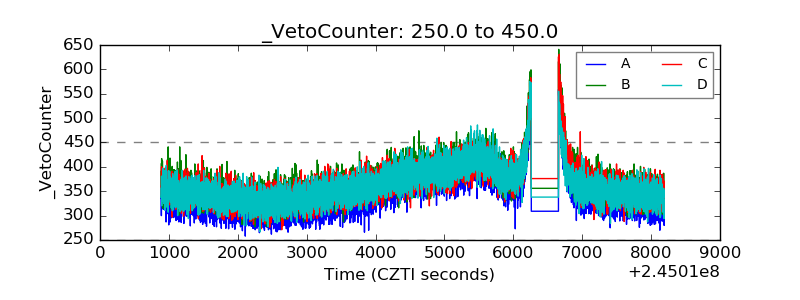 |