| Param | Original file | Final file |
|---|---|---|
| Filename | modeM0/AS1G08_037T01_9000001588_10950cztM0_level2.evt | modeM0/AS1G08_037T01_9000001588_10950cztM0_level2_quad_clean.evt |
| Size (bytes) | 1,141,136,640 | 152,130,240 |
| Size | 1.1 GB | 145.1 MB |
| Events in quadrant A | 10,970,218 | 914,532 |
| Events in quadrant B | 8,816,101 | 943,354 |
| Events in quadrant C | 5,865,217 | 948,059 |
| Events in quadrant D | 8,011,728 | 883,190 |
| Mode M0 | |||
|---|---|---|---|
| Quadrant | BADHDUFLAG | Total packets | Discarded packets |
| A | 0 | 41766 | 4 |
| B | 0 | 35009 | 3 |
| C | 0 | 26929 | 3 |
| D | 0 | 33180 | 3 |
| Mode SS | |||
|---|---|---|---|
| Quadrant | BADHDUFLAG | Total packets | Discarded packets |
| A | 0 | 270 | 0 |
| B | 0 | 270 | 0 |
| C | 0 | 270 | 0 |
| D | 0 | 270 | 0 |
| Mode M9 | |||
|---|---|---|---|
| Quadrant | BADHDUFLAG | Total packets | Discarded packets |
| A | 0 | 18 | 0 |
| B | 0 | 18 | 0 |
| C | 0 | 18 | 0 |
| D | 0 | 18 | 0 |
| Quadrant | Total seconds | Saturated seconds | Saturation percentage |
|---|---|---|---|
| A | 13284 | 920 | 6.925625% |
| B | 13284 | 705 | 5.307136% |
| C | 13284 | 37 | 0.278531% |
| D | 13284 | 571 | 4.298404% |
Noise dominated data is calculated using 1-second bins in cleaned event files. If a bin has >2000 counts, and if more than 50% of those come from <1% of pixels, then it is considered to be noise-dominated and hence unusable.
| Quadrant | # 1 sec bins | Bins with >0 counts | Bins with >2000 counts | High rate bins dominated by noise | Noise dominated (total time) | Noise dominated (detector-on time) | Marked lightcurve |
|---|---|---|---|---|---|---|---|
| A | 15004 | 13286 | 544 | 544 | 3.63% | 4.09% | 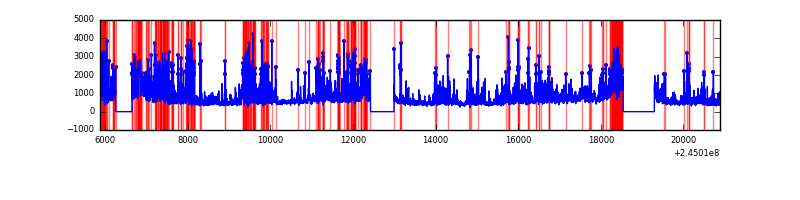 |
| B | 15004 | 13287 | 402 | 402 | 2.68% | 3.03% | 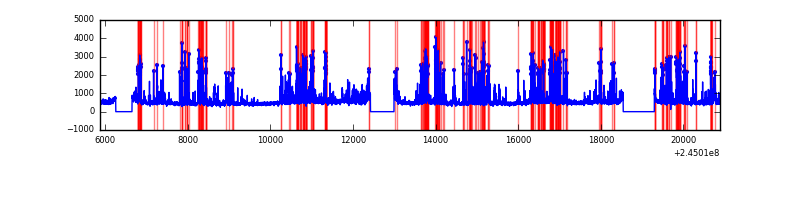 |
| C | 15004 | 13287 | 0 | 0 | 0.00% | 0.00% | 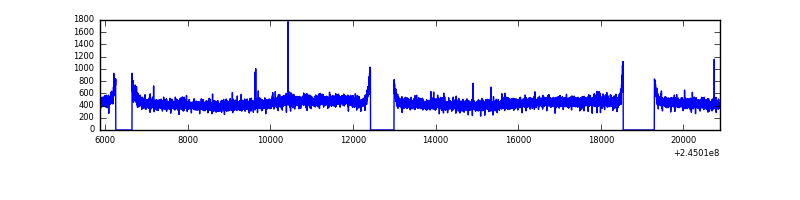 |
| D | 15004 | 13287 | 455 | 455 | 3.03% | 3.42% | 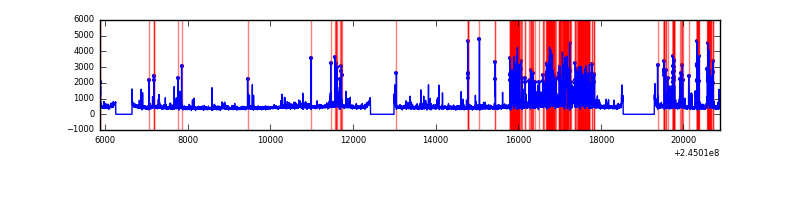 |
Top three noisy pixels from each quadrant. If the there are fewer than three noisy pixels in the level2.evt file, extra rows are filled as -1
| Pixel properties | Quadrant properties | ||||||
|---|---|---|---|---|---|---|---|
| Quadrant | DetID | PixID | Counts | Sigma | Mean | Median | Sigma |
| A | 8 | 5 | 3528598 | 11449.66 | 1508 | 1476 | 308.1 |
| A | 8 | 15 | 1352541 | 4385.79 | 1508 | 1476 | 308.1 |
| A | 14 | 238 | 168987 | 543.77 | 1508 | 1476 | 308.1 |
| B | 4 | 239 | 2523512 | 8622.87 | 1530 | 1493 | 292.5 |
| B | 0 | 214 | 80783 | 271.1 | 1530 | 1493 | 292.5 |
| B | 3 | 189 | 78046 | 261.74 | 1530 | 1493 | 292.5 |
| C | 13 | 61 | 11061 | 27.57 | 1496 | 1507 | 346.5 |
| C | 8 | 128 | 10005 | 24.52 | 1496 | 1507 | 346.5 |
| C | 8 | 222 | 7310 | 16.75 | 1496 | 1507 | 346.5 |
| D | 1 | 52 | 1710871 | 4849.1 | 1461 | 1418 | 352.5 |
| D | 14 | 34 | 164898 | 463.73 | 1461 | 1418 | 352.5 |
| D | 13 | 61 | 103701 | 290.14 | 1461 | 1418 | 352.5 |
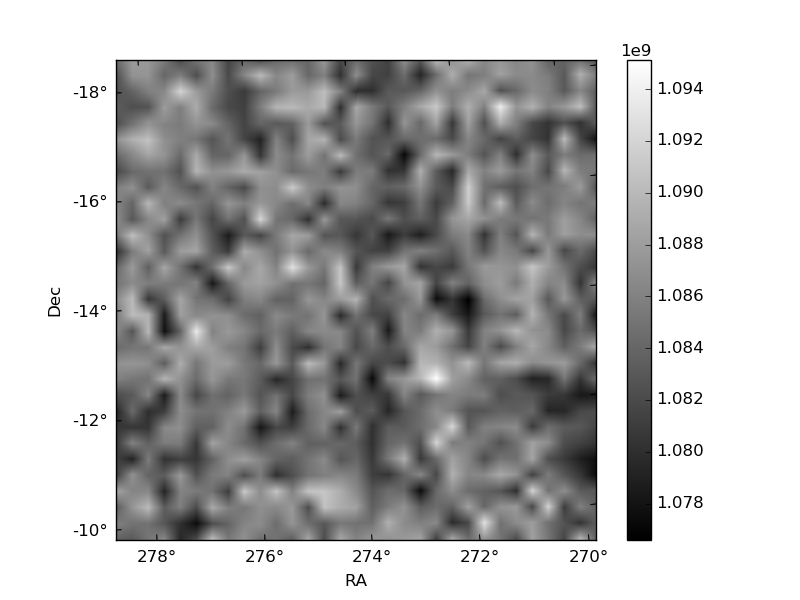
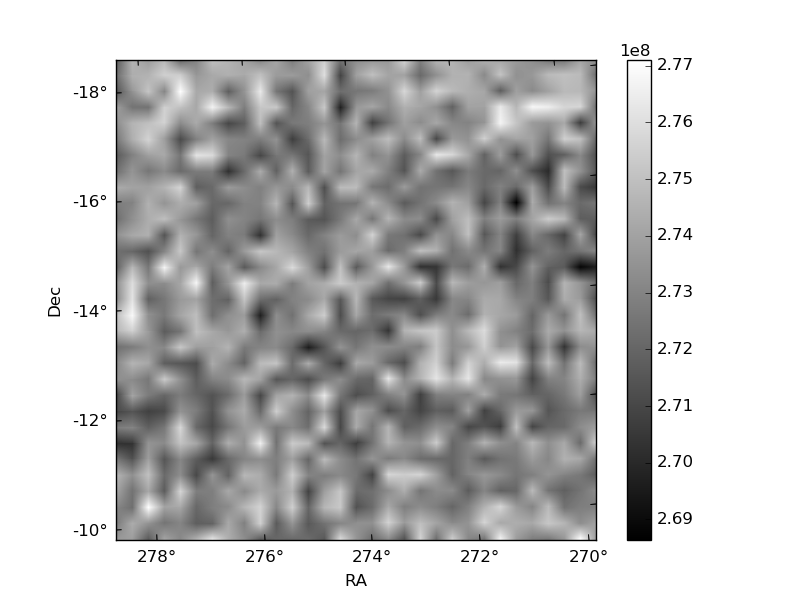
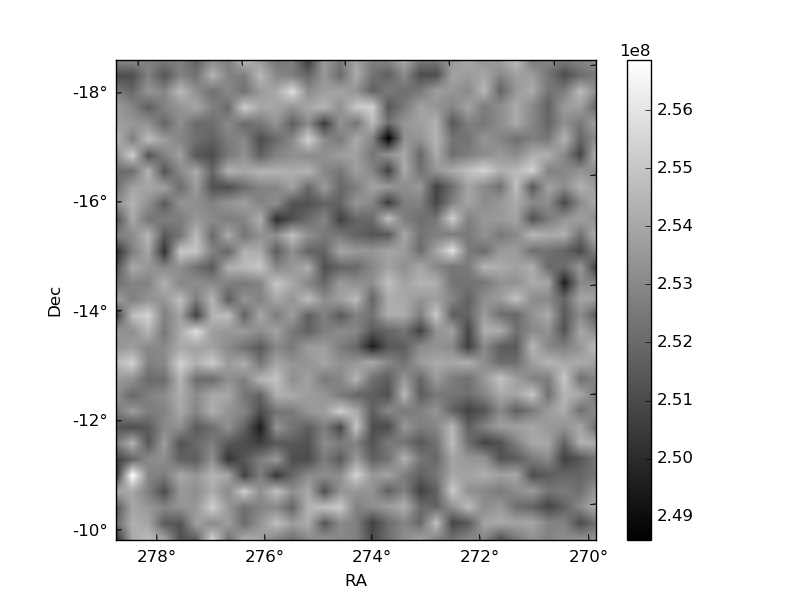
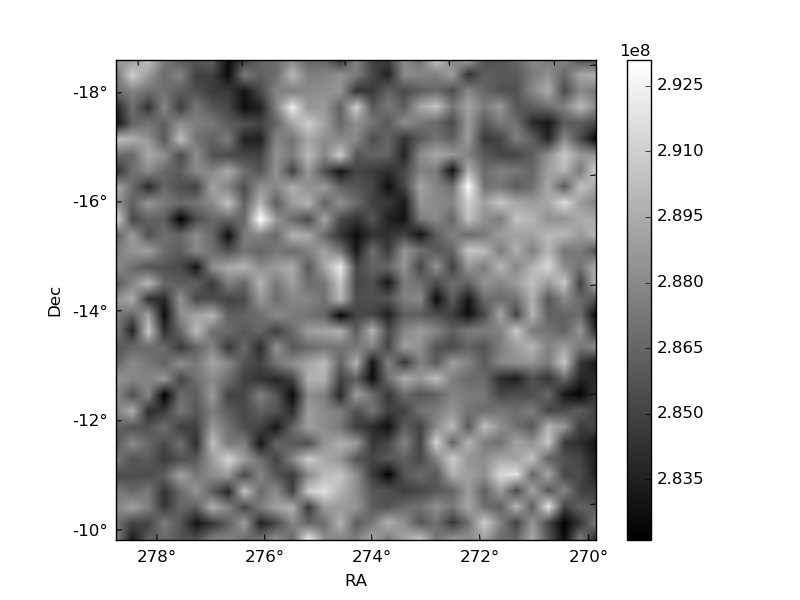
Histogram calculated using DETX and DETY for each event in the final _common_clean file
| Quadrant A | 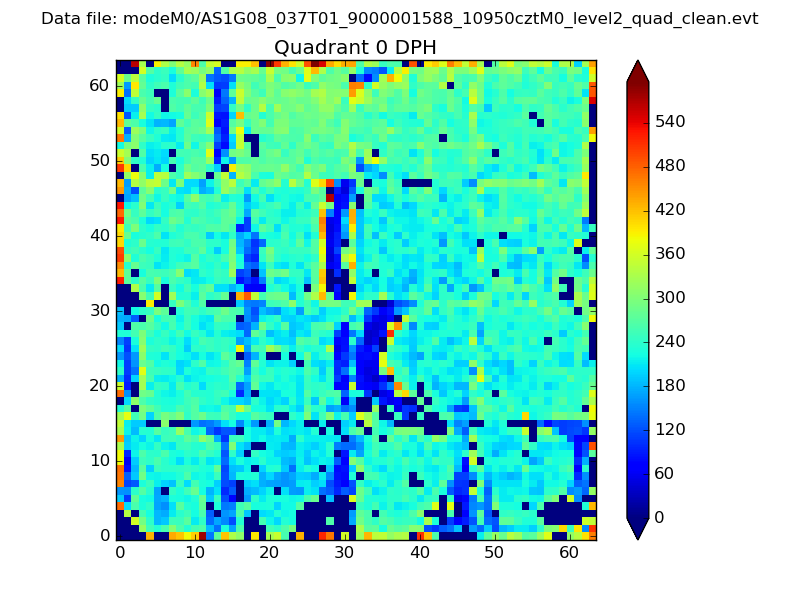 |
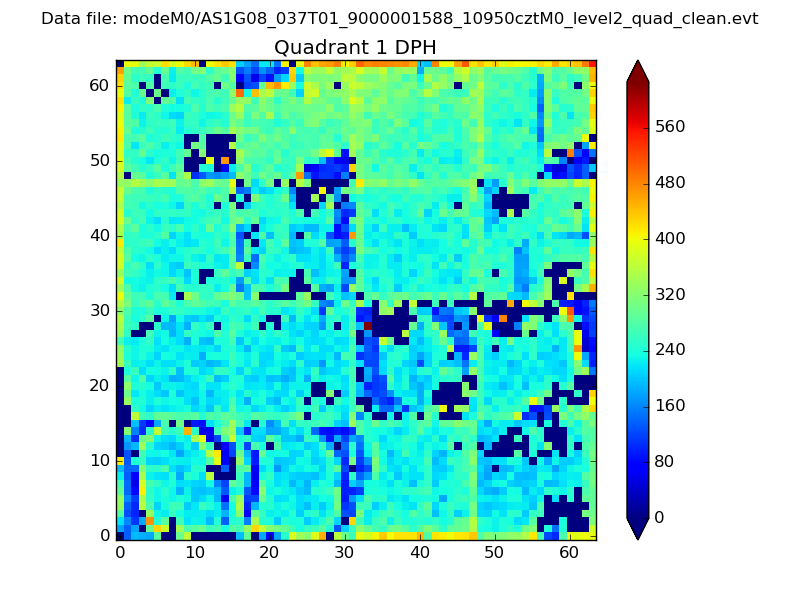 |
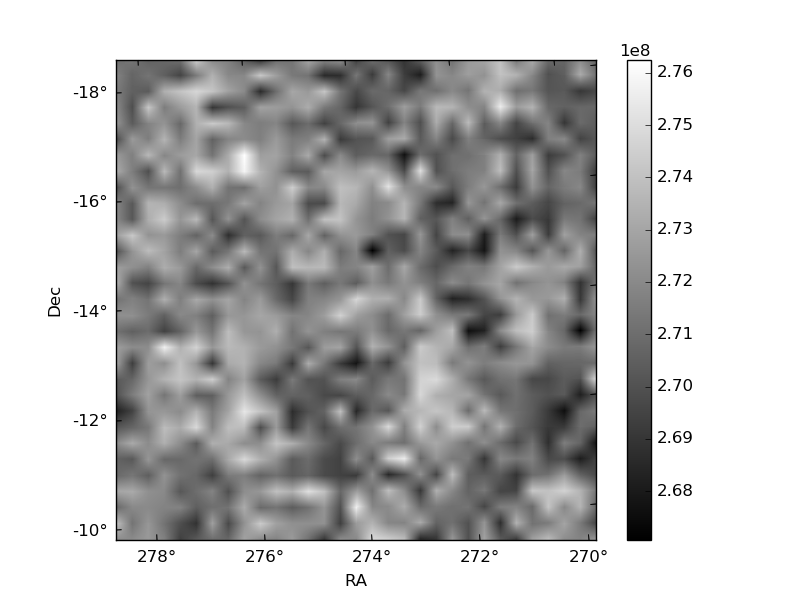
Quadrant B |
|---|---|---|---|
| Quadrant D | 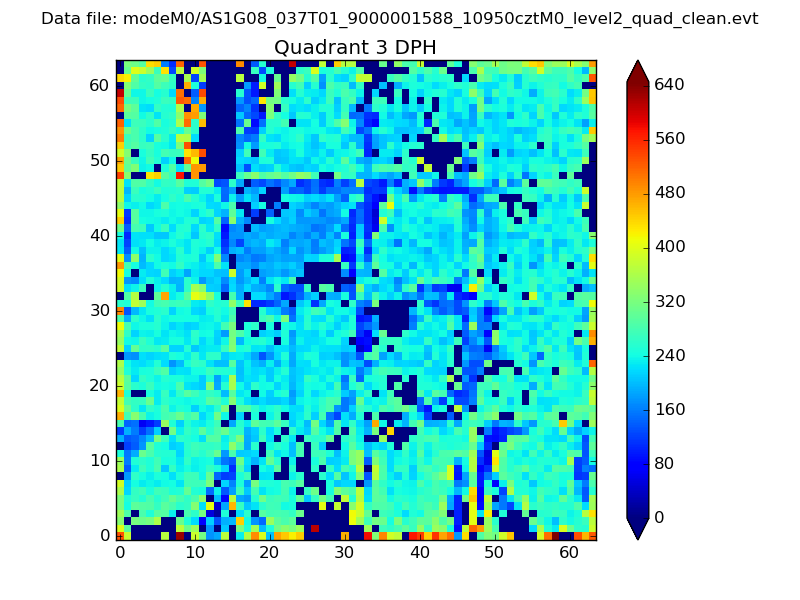 |
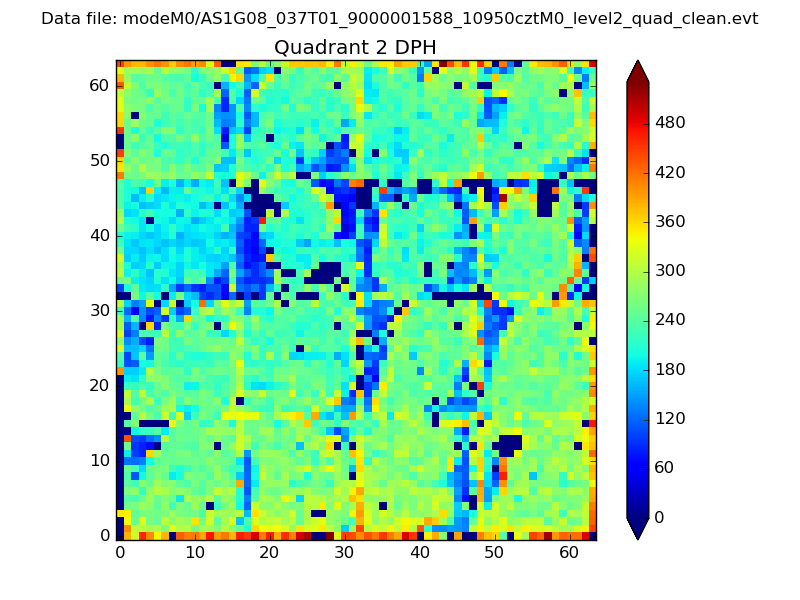 |
Quadrant C |
| Plot type | Count rate plots | Images |
|---|---|---|
| Comparison with Poisson distribution Blue bars denote a histogram of data divided into 1 sec bins. Red curve is a Poisson curve with rate = median count rate of data. |
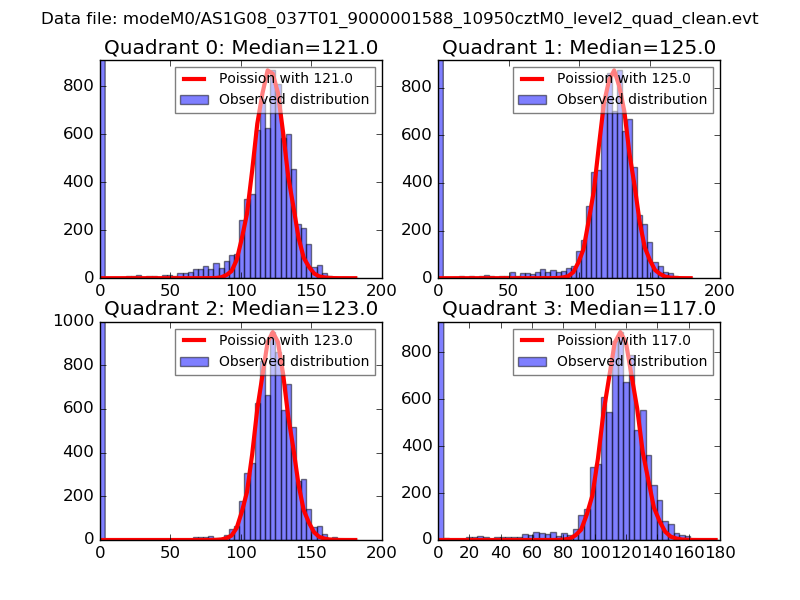 |
 |
| Quadrant-wise count rates Data is divided into 100 sec bins |
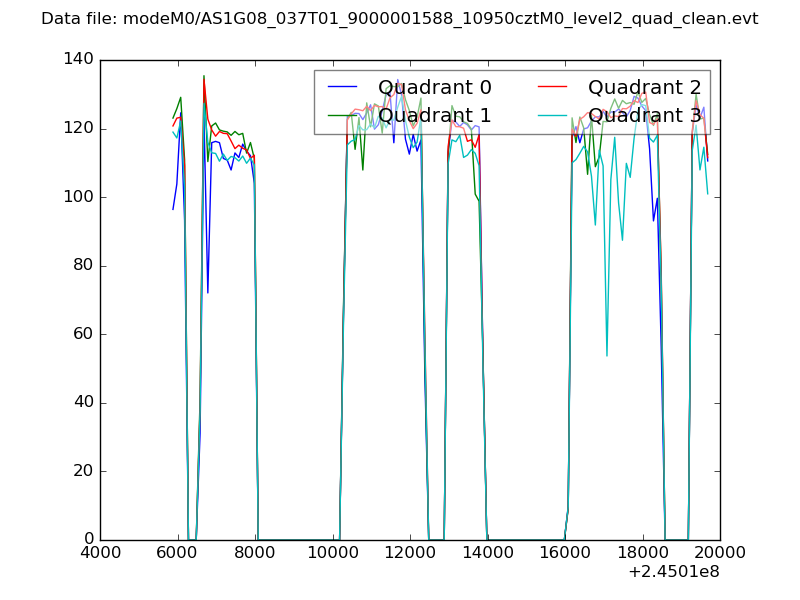 |
|
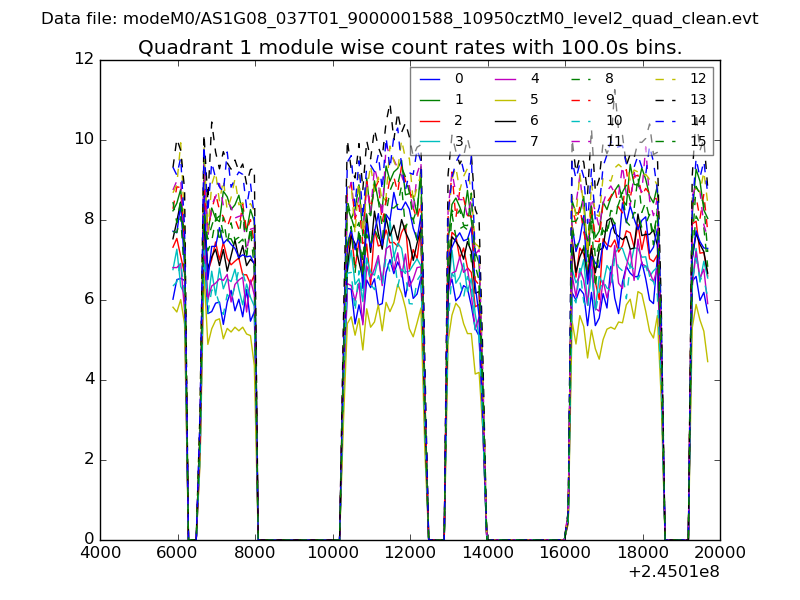
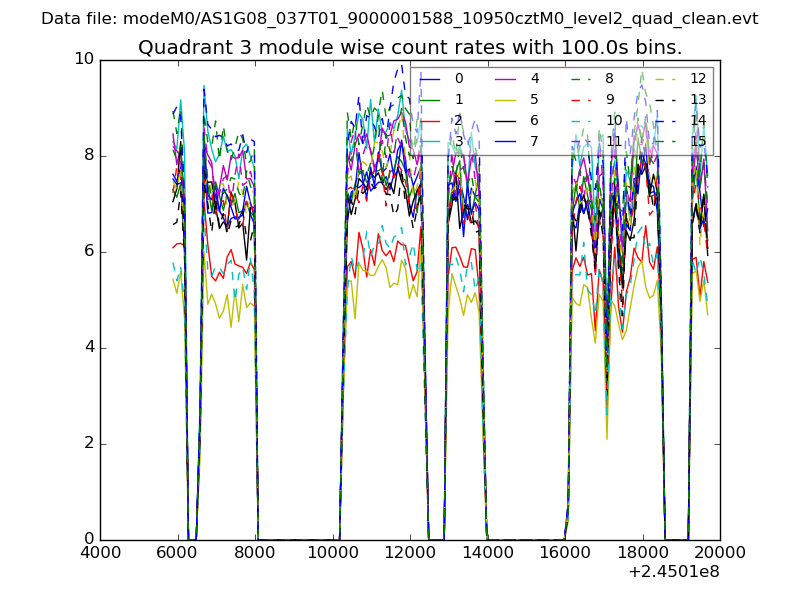
| Module-wise count rates for Quadrant A Data is divided into 100 sec bins |
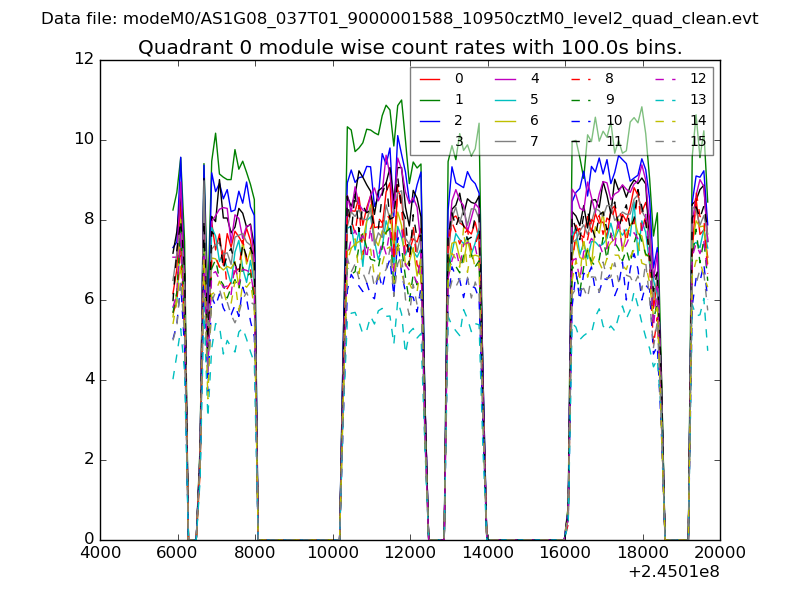 |
 |
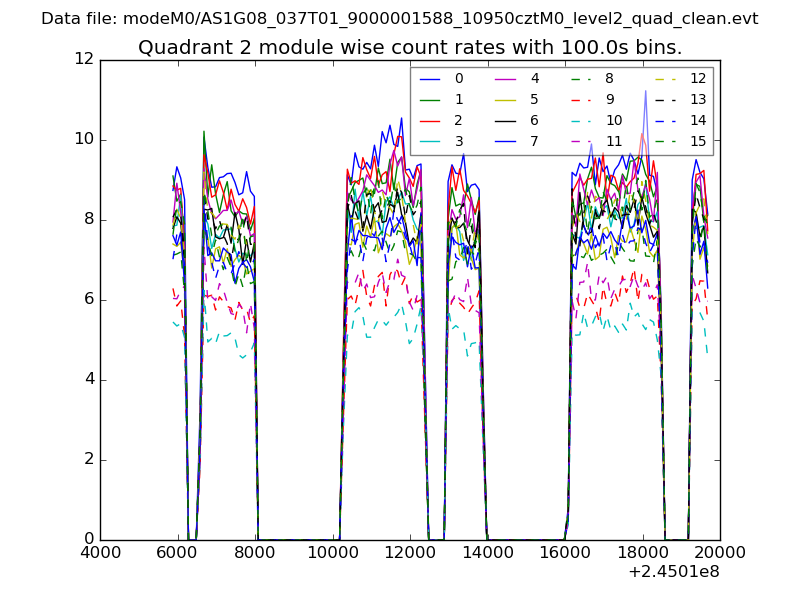
| Module-wise count rates for Quadrant B Data is divided into 100 sec bins |
 |
 |
| Module-wise count rates for Quadrant C Data is divided into 100 sec bins |
 |
 |
| Module-wise count rates for Quadrant D Data is divided into 100 sec bins |
 |
 |
| Parameter | Plot |
|---|---|
| CZT HV Monitor | 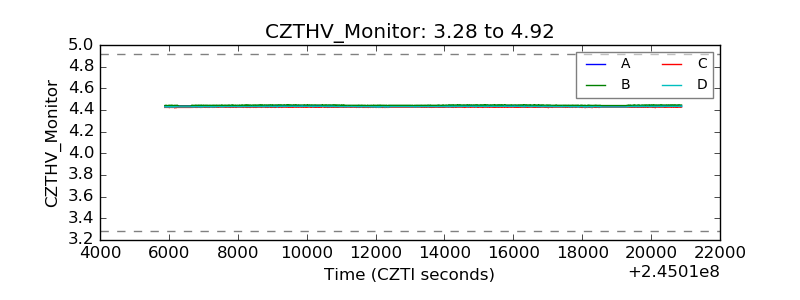 |
| D_VDD | 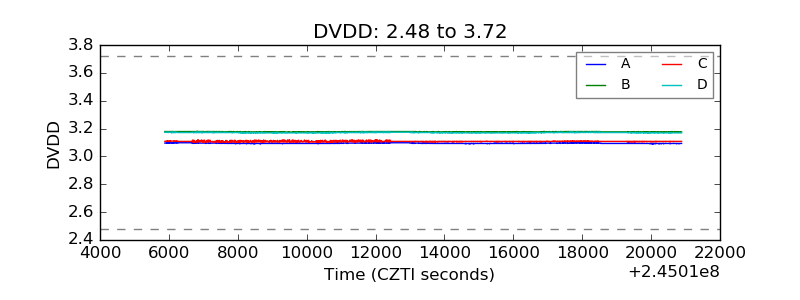 |
| Temperature 1 | 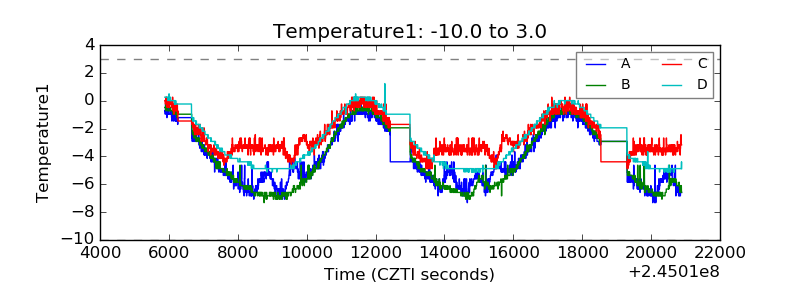 |
| Veto HV Monitor | 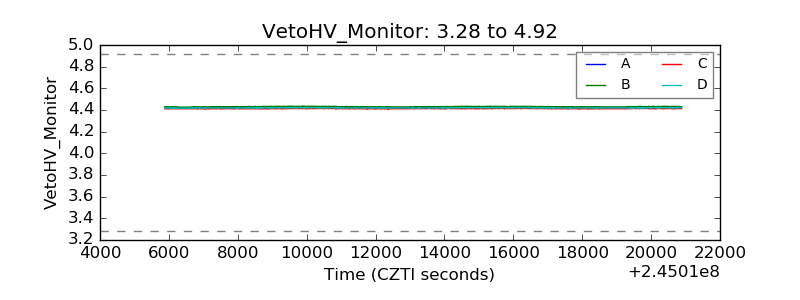 |
| Veto LLD | 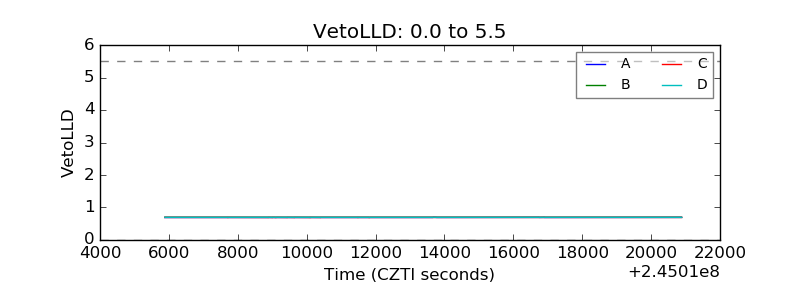 |
| Alpha Counter | 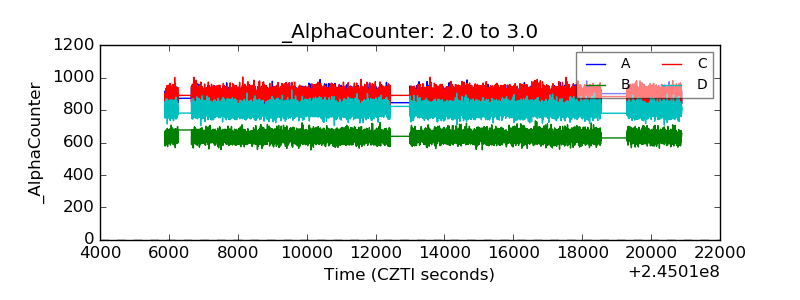 |
| _CPM_Rate | 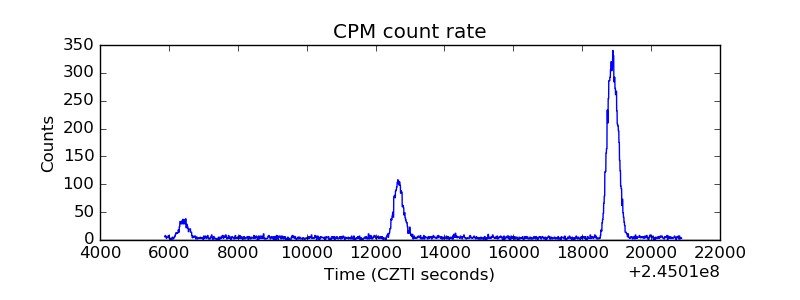 |
| CZT Counter | 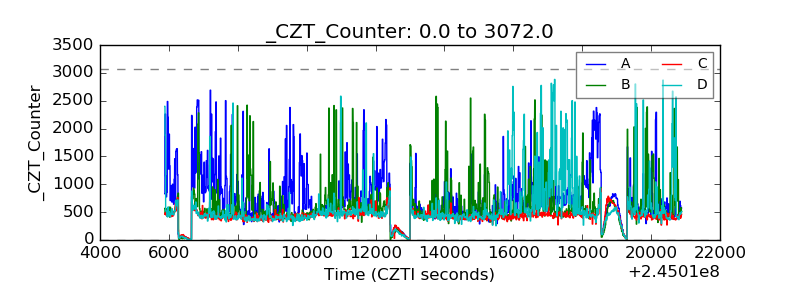 |
| +2.5 Volts monitor | 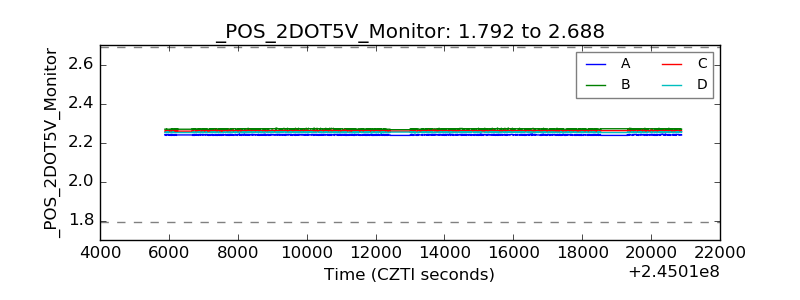 |
| +5 Volts monitor |  |
| _ROLL_ROT | 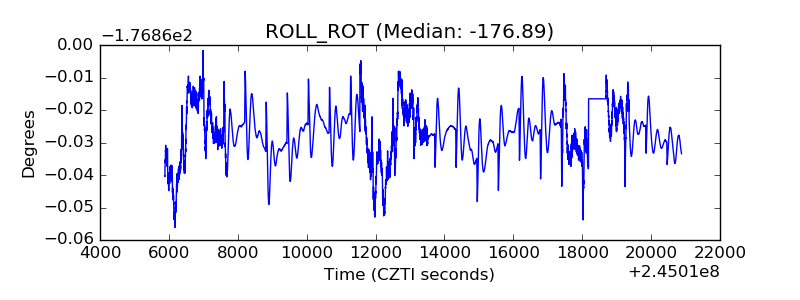 |
| _Roll_DEC | 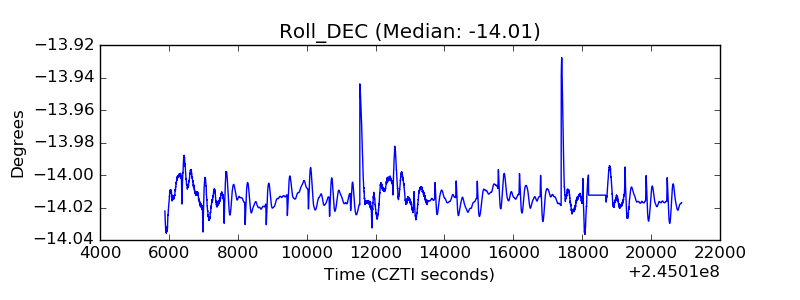 |
| _Roll_RA | 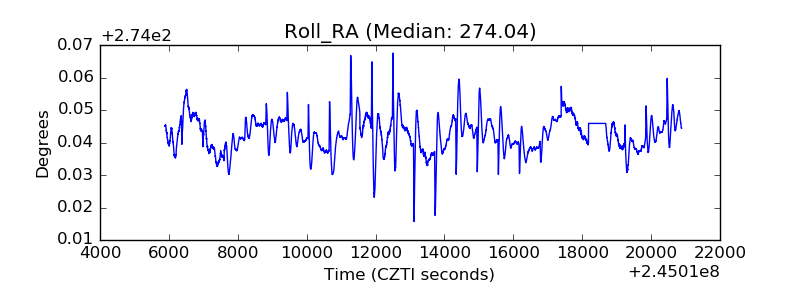 |
| Veto Counter | 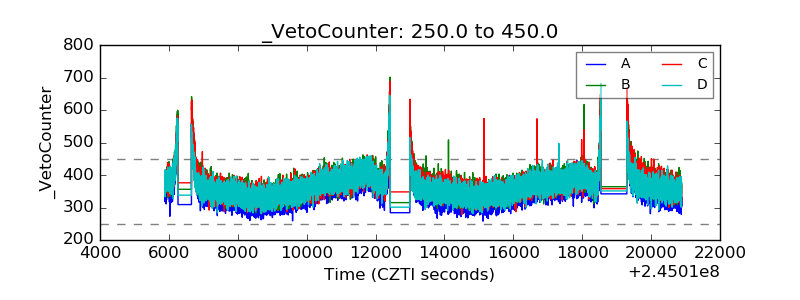 |