| Param | Original file | Final file |
|---|---|---|
| Filename | modeM0/AS1G08_037T01_9000001588_10951cztM0_level2.evt | modeM0/AS1G08_037T01_9000001588_10951cztM0_level2_quad_clean.evt |
| Size (bytes) | 641,724,480 | 64,134,720 |
| Size | 612.0 MB | 61.2 MB |
| Events in quadrant A | 4,839,161 | 379,927 |
| Events in quadrant B | 4,680,408 | 387,052 |
| Events in quadrant C | 2,977,124 | 387,280 |
| Events in quadrant D | 6,483,883 | 319,303 |
| Mode M0 | |||
|---|---|---|---|
| Quadrant | BADHDUFLAG | Total packets | Discarded packets |
| A | 0 | 18866 | 3 |
| B | 0 | 18236 | 2 |
| C | 0 | 13581 | 2 |
| D | 0 | 23901 | 2 |
| Mode SS | |||
|---|---|---|---|
| Quadrant | BADHDUFLAG | Total packets | Discarded packets |
| A | 0 | 134 | 0 |
| B | 0 | 134 | 0 |
| C | 0 | 134 | 0 |
| D | 0 | 134 | 0 |
| Mode M9 | |||
|---|---|---|---|
| Quadrant | BADHDUFLAG | Total packets | Discarded packets |
| A | 0 | 10 | 0 |
| B | 0 | 10 | 0 |
| C | 0 | 10 | 0 |
| D | 0 | 10 | 0 |
| Quadrant | Total seconds | Saturated seconds | Saturation percentage |
|---|---|---|---|
| A | 6719 | 165 | 2.455723% |
| B | 6719 | 433 | 6.444411% |
| C | 6719 | 5 | 0.074416% |
| D | 6719 | 1096 | 16.311951% |
Noise dominated data is calculated using 1-second bins in cleaned event files. If a bin has >2000 counts, and if more than 50% of those come from <1% of pixels, then it is considered to be noise-dominated and hence unusable.
| Quadrant | # 1 sec bins | Bins with >0 counts | Bins with >2000 counts | High rate bins dominated by noise | Noise dominated (total time) | Noise dominated (detector-on time) | Marked lightcurve |
|---|---|---|---|---|---|---|---|
| A | 7659 | 6720 | 91 | 91 | 1.19% | 1.35% | 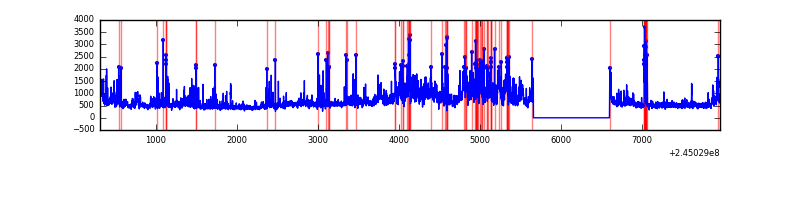 |
| B | 7659 | 6720 | 258 | 258 | 3.37% | 3.84% | 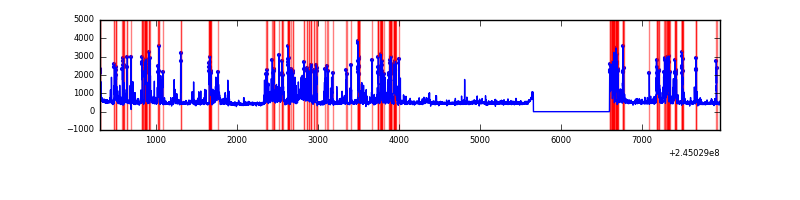 |
| C | 7659 | 6720 | 0 | 0 | 0.00% | 0.00% | 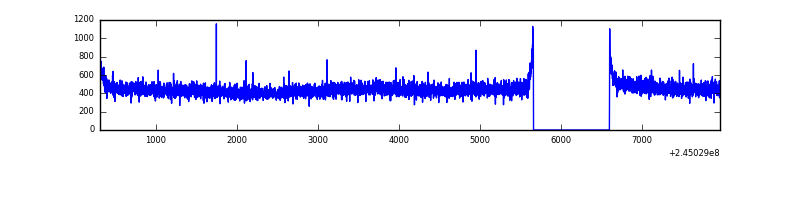 |
| D | 7659 | 6719 | 856 | 856 | 11.18% | 12.74% | 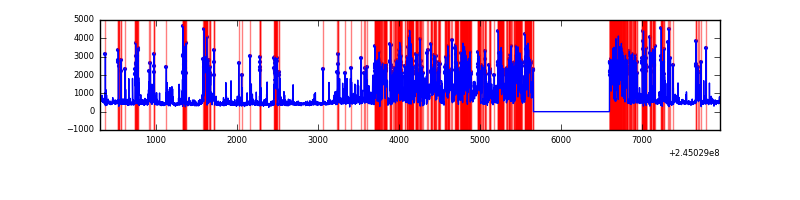 |
Top three noisy pixels from each quadrant. If the there are fewer than three noisy pixels in the level2.evt file, extra rows are filled as -1
| Pixel properties | Quadrant properties | ||||||
|---|---|---|---|---|---|---|---|
| Quadrant | DetID | PixID | Counts | Sigma | Mean | Median | Sigma |
| A | 8 | 15 | 1063096 | 6664.82 | 780 | 764 | 159.4 |
| A | 8 | 5 | 714440 | 4477.43 | 780 | 764 | 159.4 |
| A | 14 | 238 | 21514 | 130.18 | 780 | 764 | 159.4 |
| B | 4 | 239 | 1489691 | 9972.68 | 777 | 758 | 149.3 |
| B | 0 | 214 | 36642 | 240.35 | 777 | 758 | 149.3 |
| B | 6 | 51 | 36135 | 236.95 | 777 | 758 | 149.3 |
| C | 13 | 61 | 5589 | 26.98 | 763 | 766 | 178.7 |
| C | 8 | 222 | 2111 | 7.52 | 763 | 766 | 178.7 |
| C | 3 | 202 | 1836 | 5.99 | 763 | 766 | 178.7 |
| D | 1 | 52 | 2983962 | 17482.82 | 692 | 670 | 170.6 |
| D | 10 | 253 | 238294 | 1392.53 | 692 | 670 | 170.6 |
| D | 13 | 61 | 153804 | 897.4 | 692 | 670 | 170.6 |
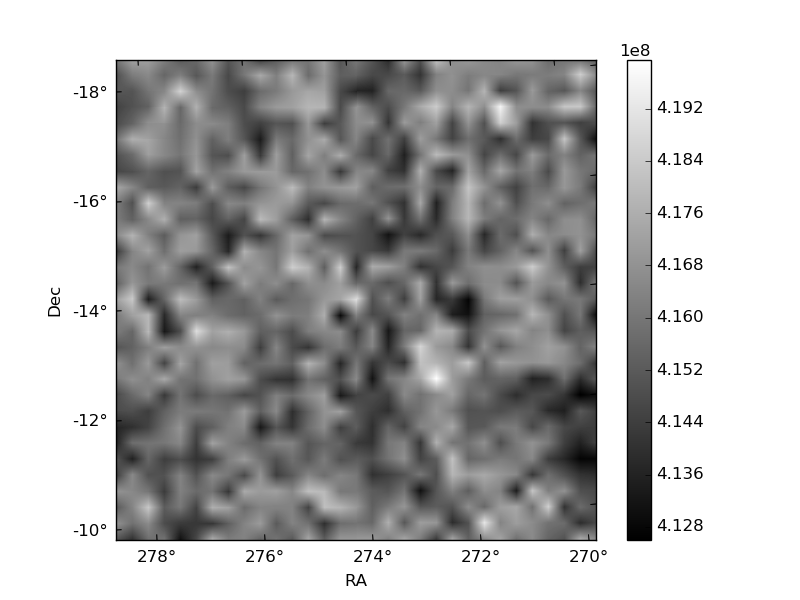
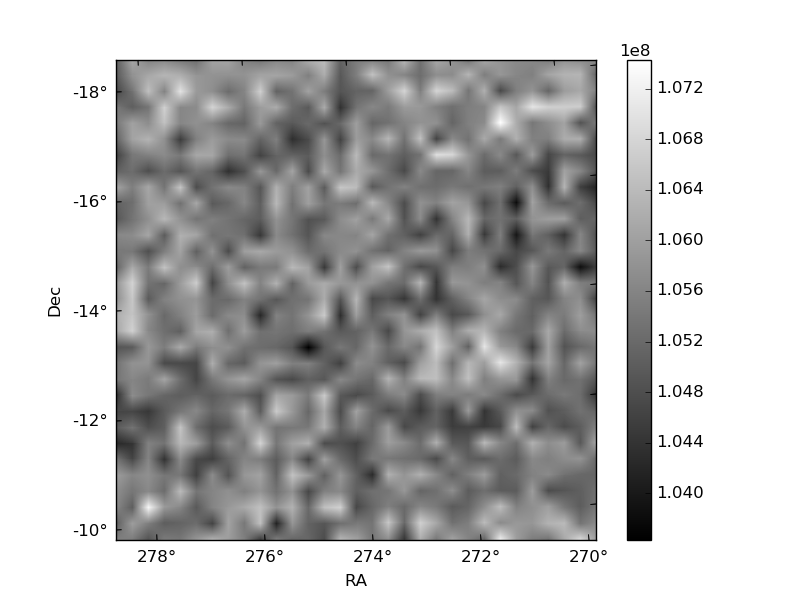
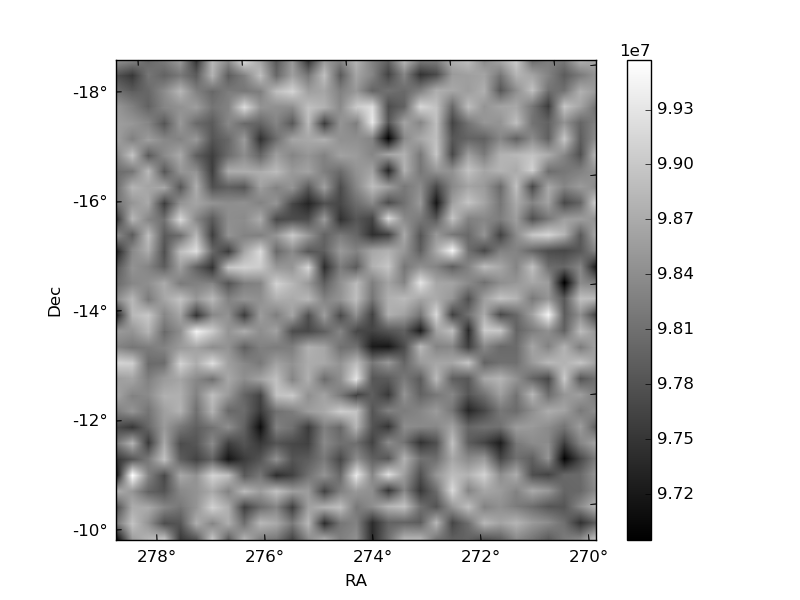
Histogram calculated using DETX and DETY for each event in the final _common_clean file
| Quadrant A | 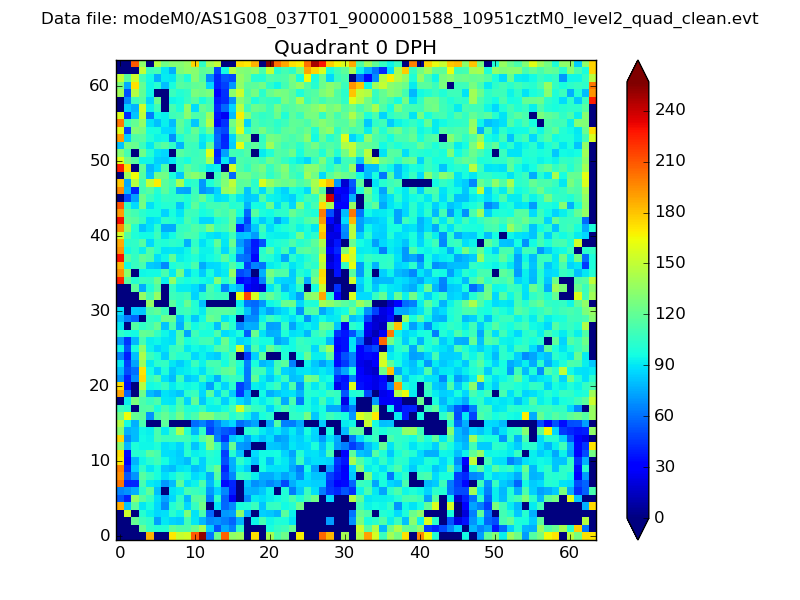 |
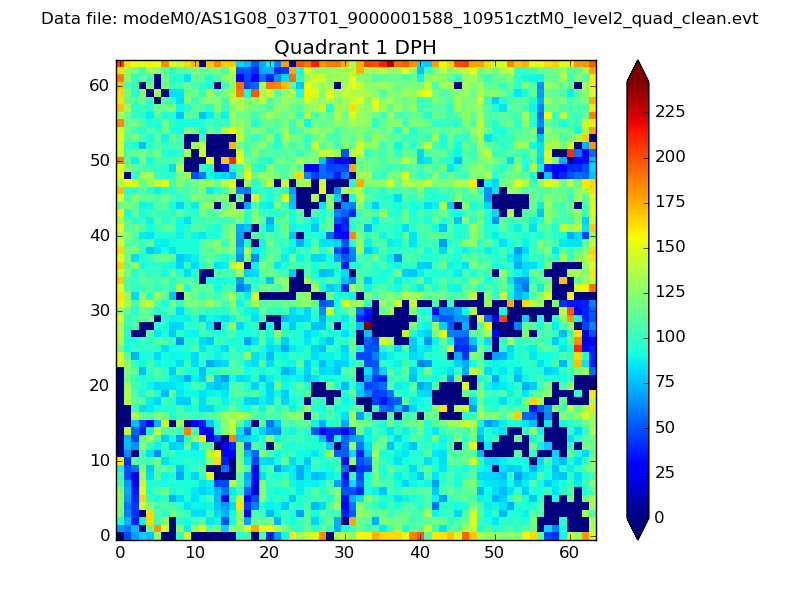 |
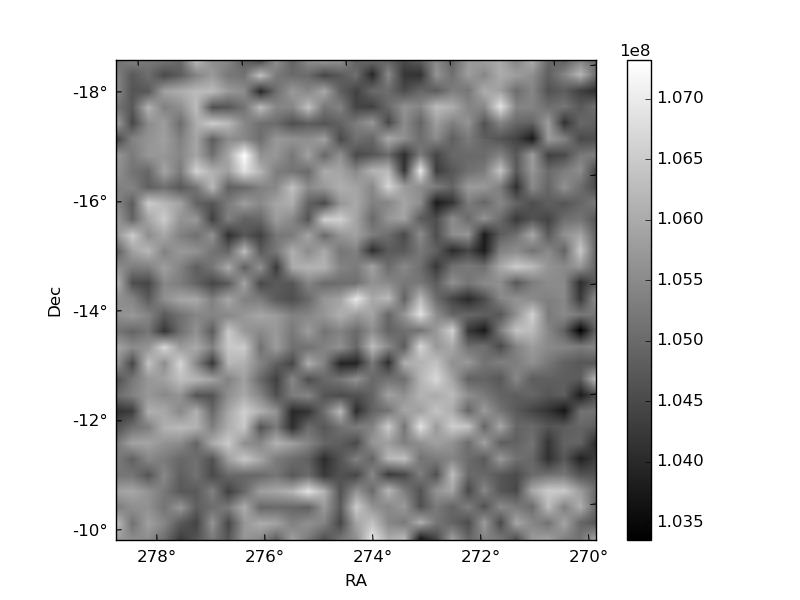
Quadrant B |
|---|---|---|---|
| Quadrant D | 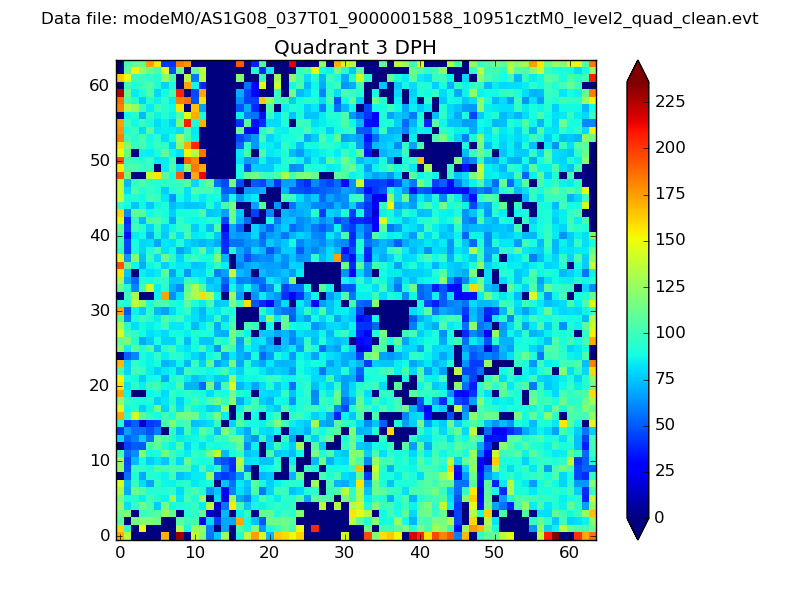 |
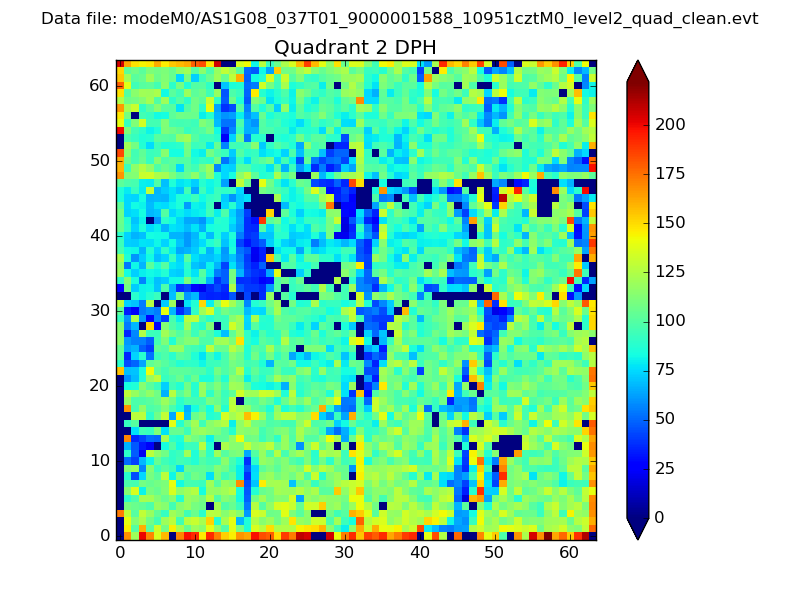 |
Quadrant C |
| Plot type | Count rate plots | Images |
|---|---|---|
| Comparison with Poisson distribution Blue bars denote a histogram of data divided into 1 sec bins. Red curve is a Poisson curve with rate = median count rate of data. |
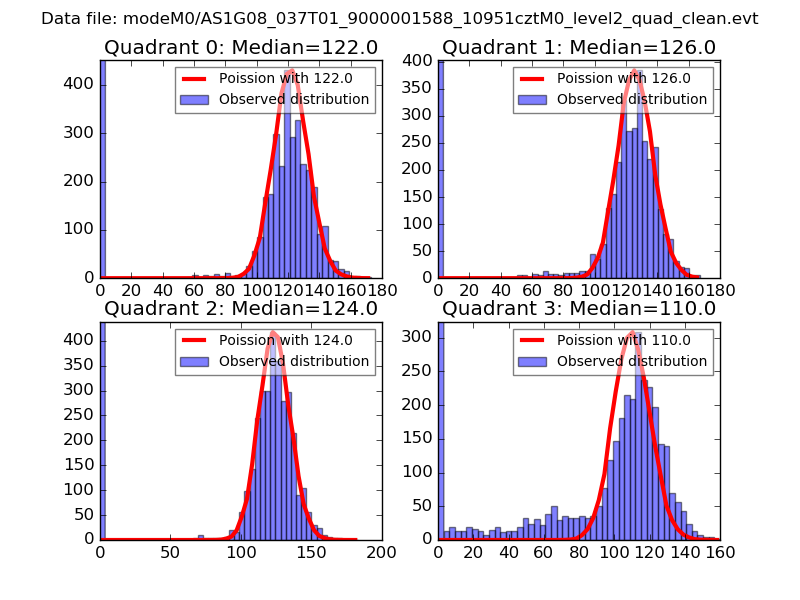 |
 |
| Quadrant-wise count rates Data is divided into 100 sec bins |
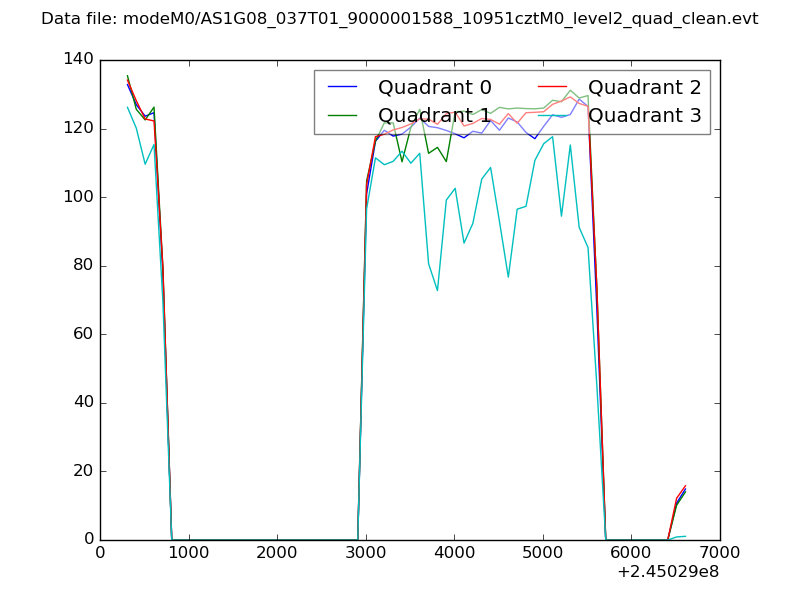 |
|
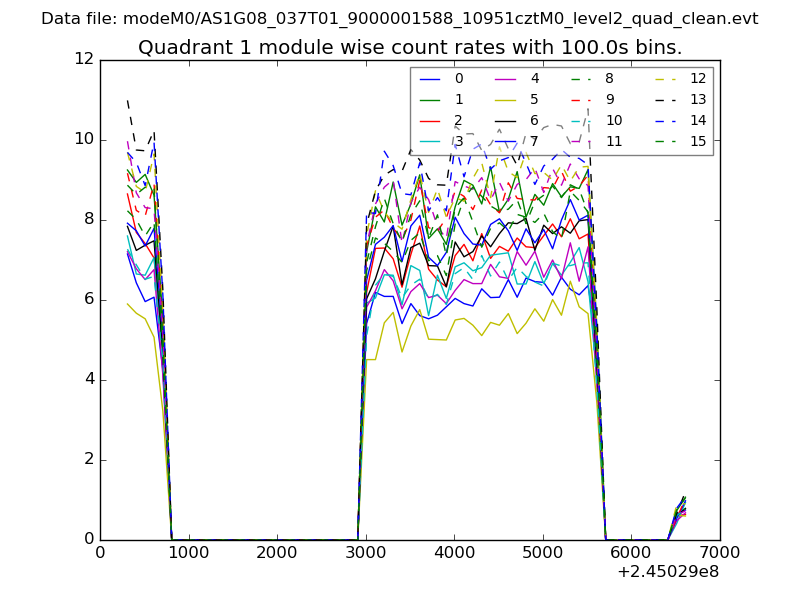
| Module-wise count rates for Quadrant A Data is divided into 100 sec bins |
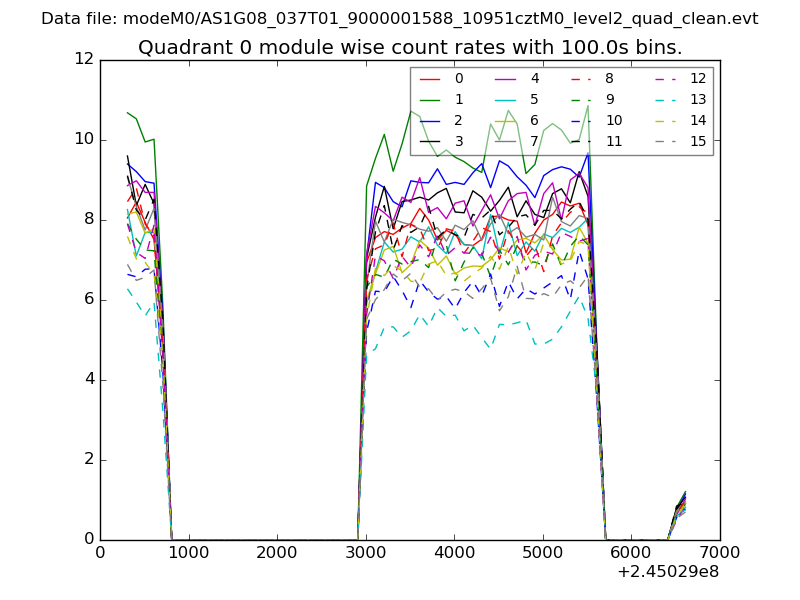 |
 |
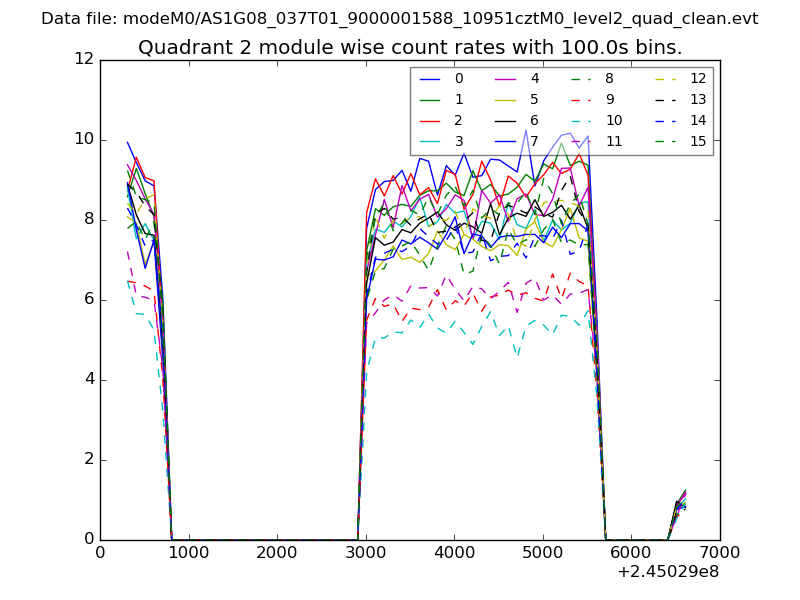
| Module-wise count rates for Quadrant B Data is divided into 100 sec bins |
 |
 |
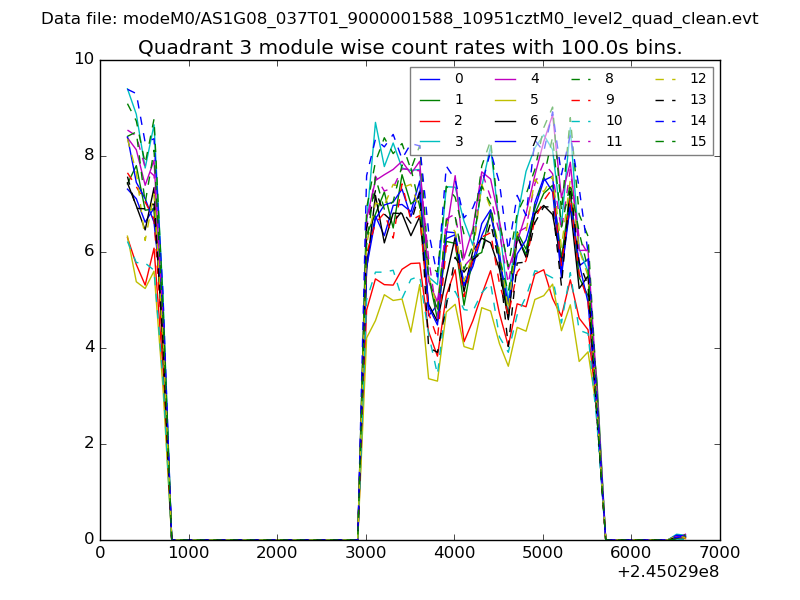
| Module-wise count rates for Quadrant C Data is divided into 100 sec bins |
 |
 |
| Module-wise count rates for Quadrant D Data is divided into 100 sec bins |
 |
 |
| Parameter | Plot |
|---|---|
| CZT HV Monitor | 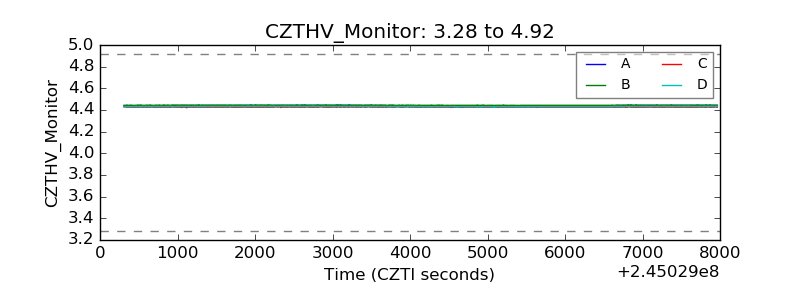 |
| D_VDD | 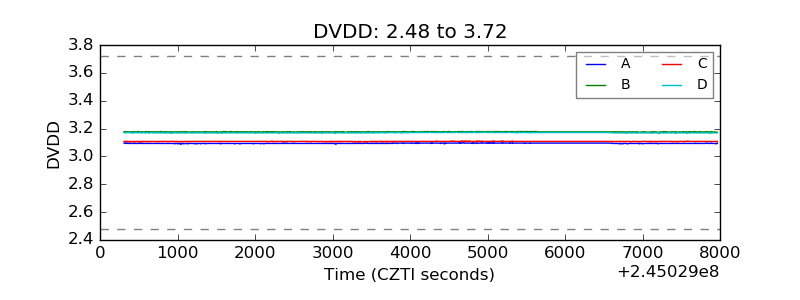 |
| Temperature 1 | 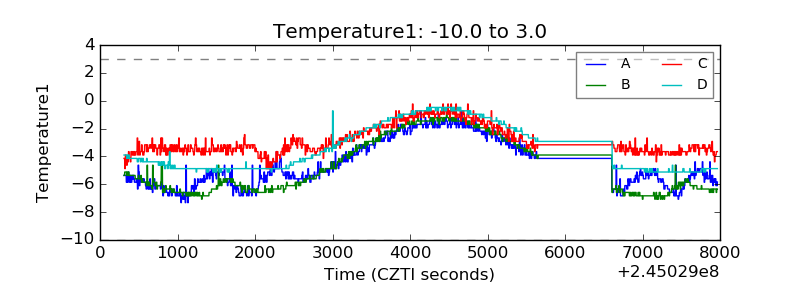 |
| Veto HV Monitor |  |
| Veto LLD | 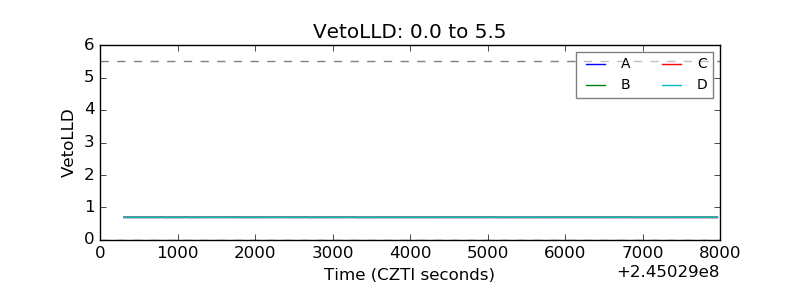 |
| Alpha Counter | 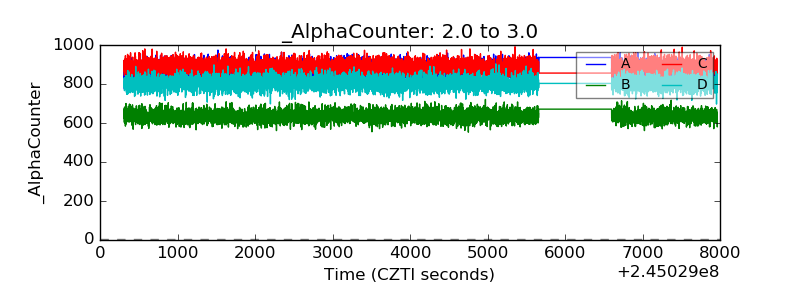 |
| _CPM_Rate | 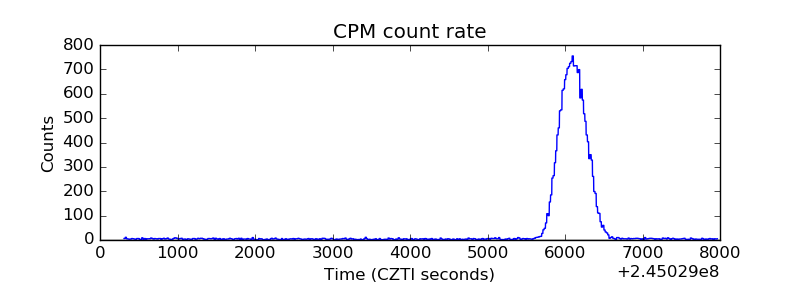 |
| CZT Counter | 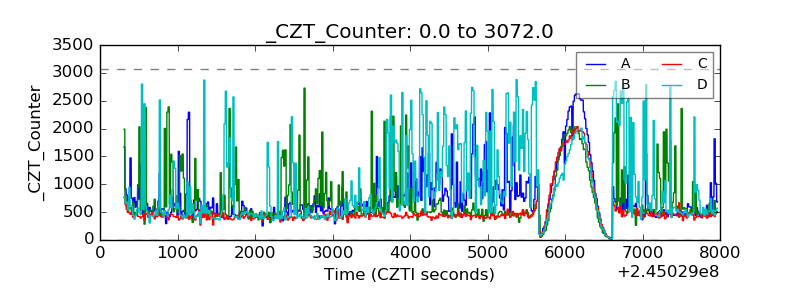 |
| +2.5 Volts monitor |  |
| +5 Volts monitor |  |
| _ROLL_ROT | 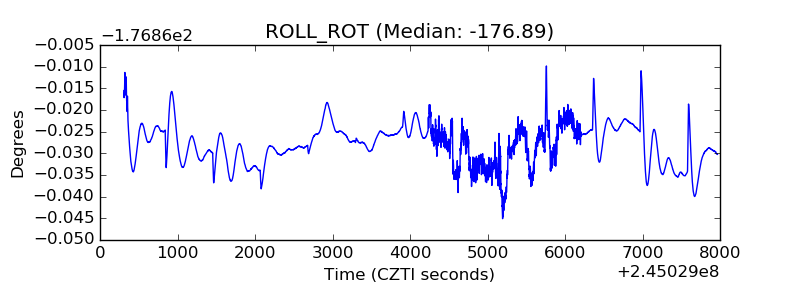 |
| _Roll_DEC | 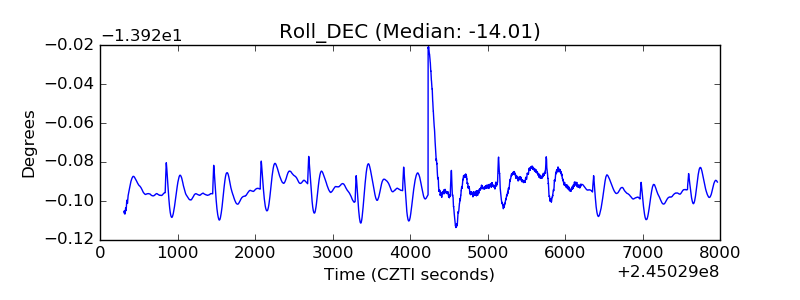 |
| _Roll_RA | 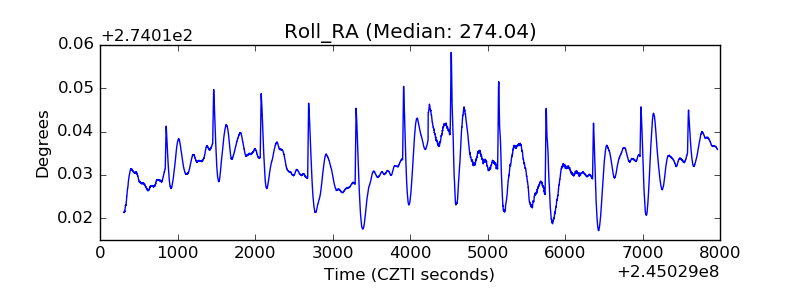 |
| Veto Counter | 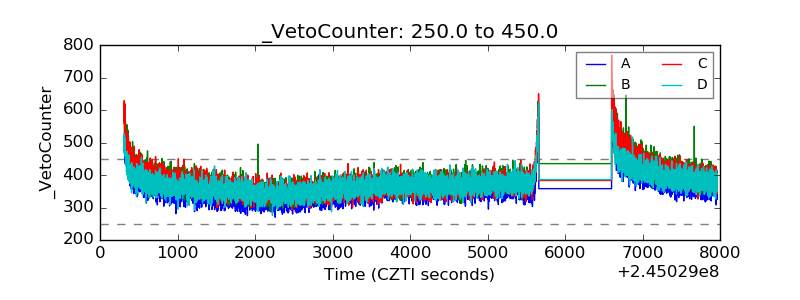 |