| Param | Original file | Final file |
|---|---|---|
| Filename | modeM0/AS1G08_037T01_9000001588_10952cztM0_level2.evt | modeM0/AS1G08_037T01_9000001588_10952cztM0_level2_quad_clean.evt |
| Size (bytes) | 572,103,360 | 62,087,040 |
| Size | 545.6 MB | 59.2 MB |
| Events in quadrant A | 4,190,374 | 362,136 |
| Events in quadrant B | 4,574,936 | 366,428 |
| Events in quadrant C | 3,033,399 | 368,094 |
| Events in quadrant D | 5,081,289 | 323,937 |
| Mode M0 | |||
|---|---|---|---|
| Quadrant | BADHDUFLAG | Total packets | Discarded packets |
| A | 0 | 16651 | 3 |
| B | 0 | 17764 | 2 |
| C | 0 | 13478 | 2 |
| D | 0 | 19366 | 2 |
| Mode SS | |||
|---|---|---|---|
| Quadrant | BADHDUFLAG | Total packets | Discarded packets |
| A | 0 | 134 | 0 |
| B | 0 | 134 | 0 |
| C | 0 | 134 | 0 |
| D | 0 | 134 | 0 |
| Mode M9 | |||
|---|---|---|---|
| Quadrant | BADHDUFLAG | Total packets | Discarded packets |
| A | 0 | 14 | 0 |
| B | 0 | 14 | 0 |
| C | 0 | 14 | 0 |
| D | 0 | 15 | 0 |
| Quadrant | Total seconds | Saturated seconds | Saturation percentage |
|---|---|---|---|
| A | 6578 | 203 | 3.086044% |
| B | 6578 | 479 | 7.281849% |
| C | 6578 | 50 | 0.760109% |
| D | 6578 | 688 | 10.459106% |
Noise dominated data is calculated using 1-second bins in cleaned event files. If a bin has >2000 counts, and if more than 50% of those come from <1% of pixels, then it is considered to be noise-dominated and hence unusable.
| Quadrant | # 1 sec bins | Bins with >0 counts | Bins with >2000 counts | High rate bins dominated by noise | Noise dominated (total time) | Noise dominated (detector-on time) | Marked lightcurve |
|---|---|---|---|---|---|---|---|
| A | 7608 | 6578 | 104 | 104 | 1.37% | 1.58% | 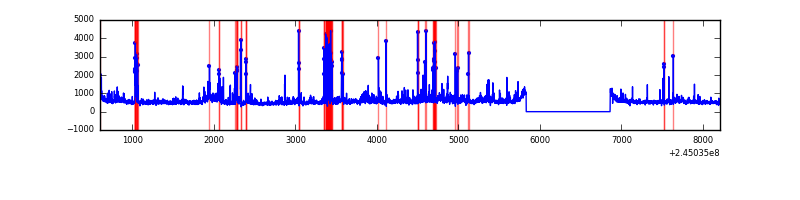 |
| B | 7608 | 6578 | 248 | 248 | 3.26% | 3.77% | 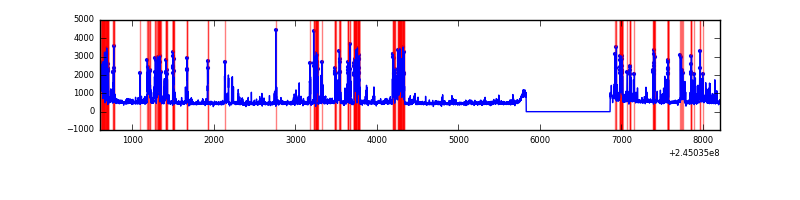 |
| C | 7608 | 6578 | 2 | 2 | 0.03% | 0.03% |  |
| D | 7608 | 6578 | 551 | 551 | 7.24% | 8.38% | 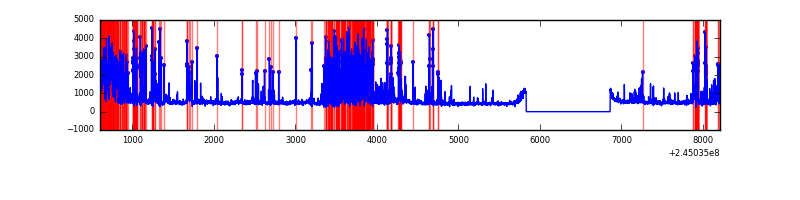 |
Top three noisy pixels from each quadrant. If the there are fewer than three noisy pixels in the level2.evt file, extra rows are filled as -1
| Pixel properties | Quadrant properties | ||||||
|---|---|---|---|---|---|---|---|
| Quadrant | DetID | PixID | Counts | Sigma | Mean | Median | Sigma |
| A | 8 | 5 | 835535 | 5192.05 | 792 | 777 | 160.8 |
| A | 8 | 15 | 231555 | 1435.4 | 792 | 777 | 160.8 |
| A | 15 | 223 | 35217 | 214.21 | 792 | 777 | 160.8 |
| B | 4 | 239 | 1332275 | 8885.35 | 788 | 769 | 149.9 |
| B | 3 | 189 | 70463 | 465.08 | 788 | 769 | 149.9 |
| B | 0 | 214 | 34855 | 227.46 | 788 | 769 | 149.9 |
| C | 12 | 4 | 8289 | 41.68 | 776 | 780 | 180.1 |
| C | 13 | 61 | 5730 | 27.48 | 776 | 780 | 180.1 |
| C | 5 | 207 | 2246 | 8.14 | 776 | 780 | 180.1 |
| D | 1 | 52 | 990128 | 5664.9 | 723 | 703 | 174.7 |
| D | 10 | 253 | 945653 | 5410.26 | 723 | 703 | 174.7 |
| D | 13 | 249 | 131884 | 751.07 | 723 | 703 | 174.7 |
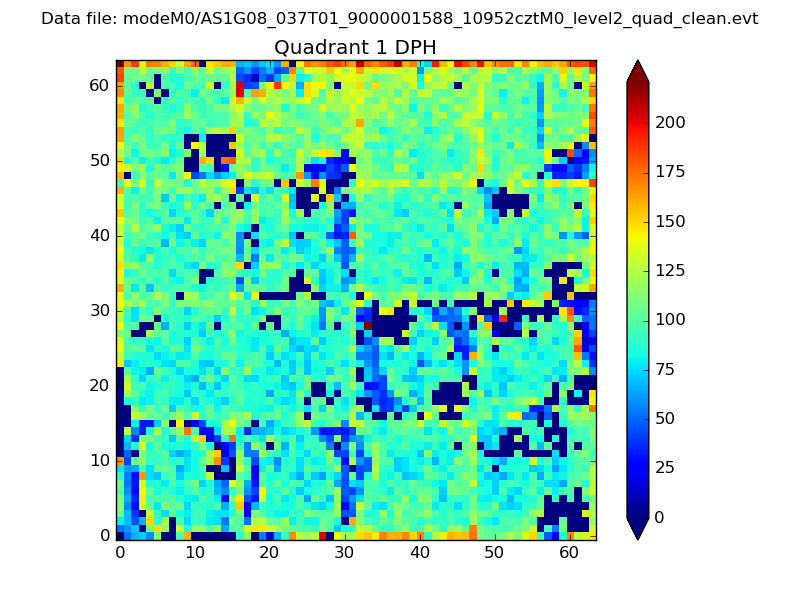
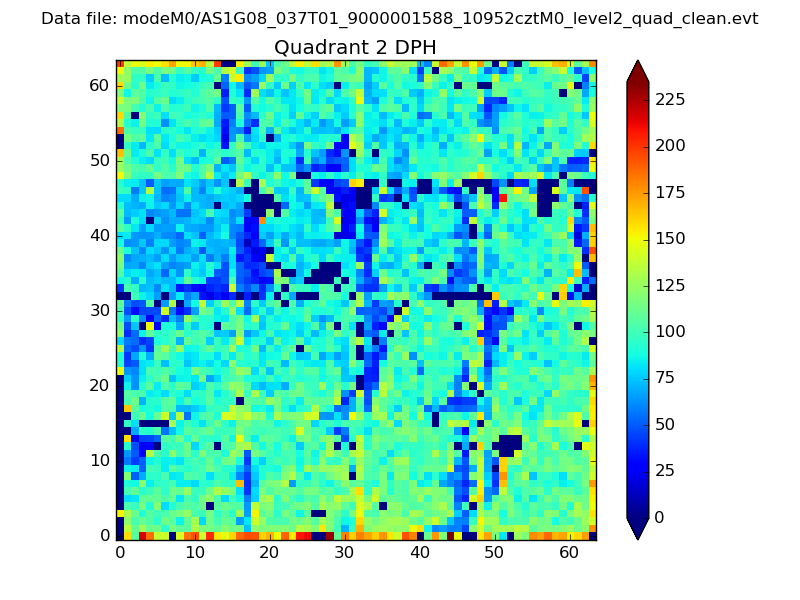
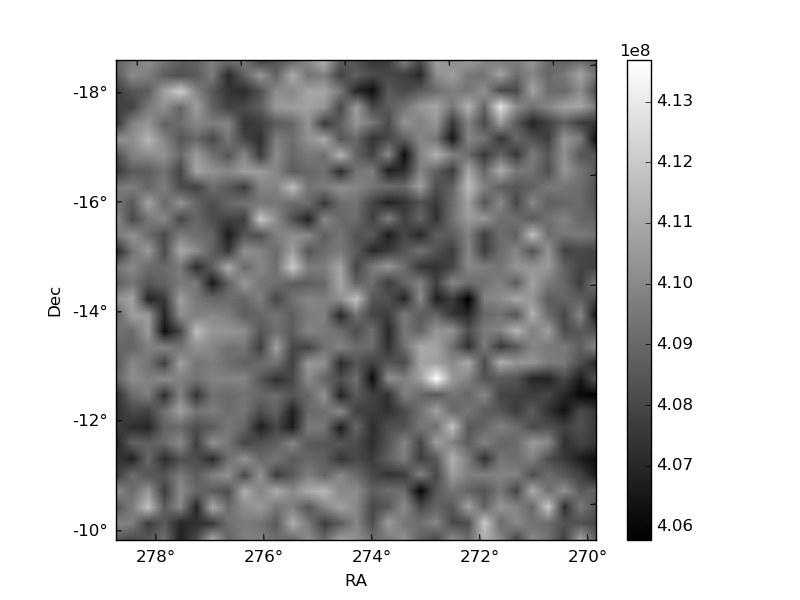
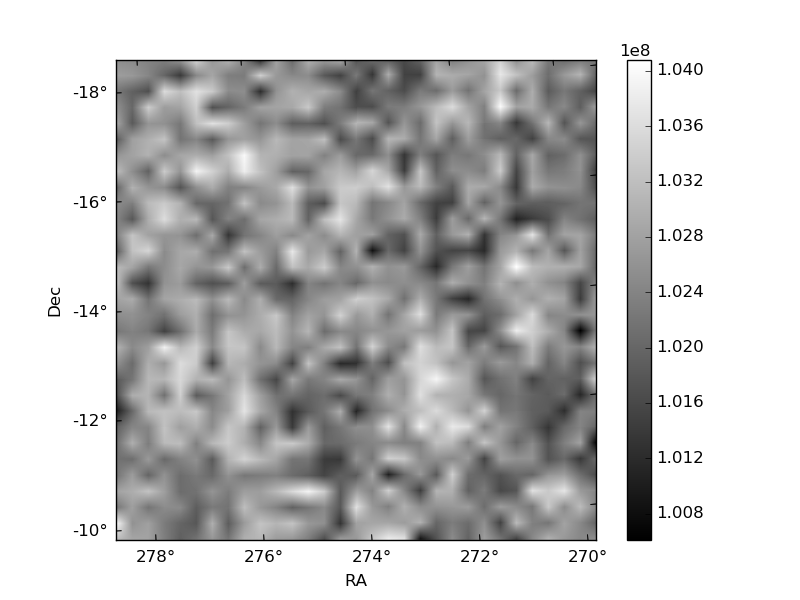
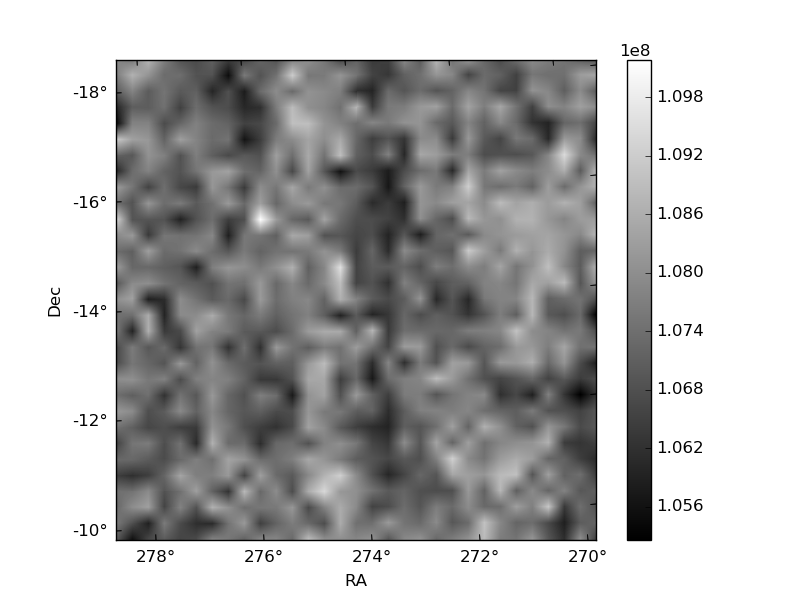
Histogram calculated using DETX and DETY for each event in the final _common_clean file
| Quadrant A | 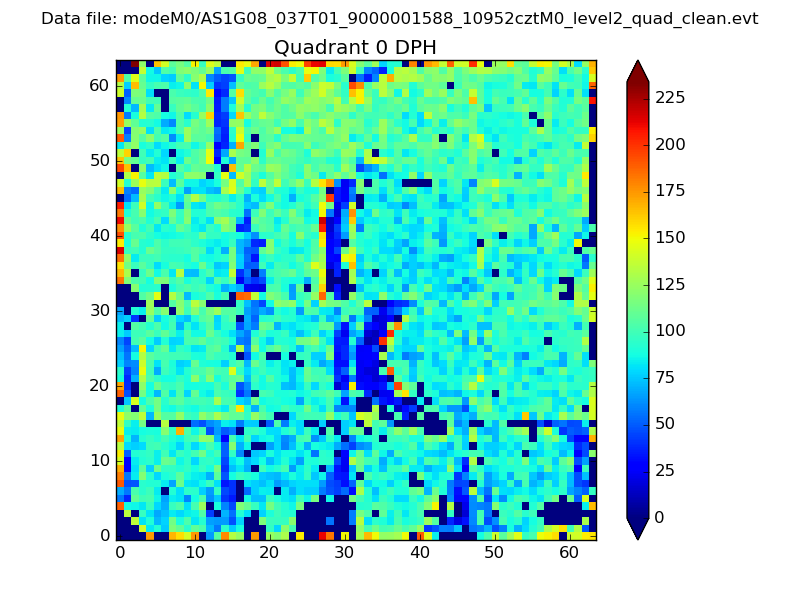 |
 |
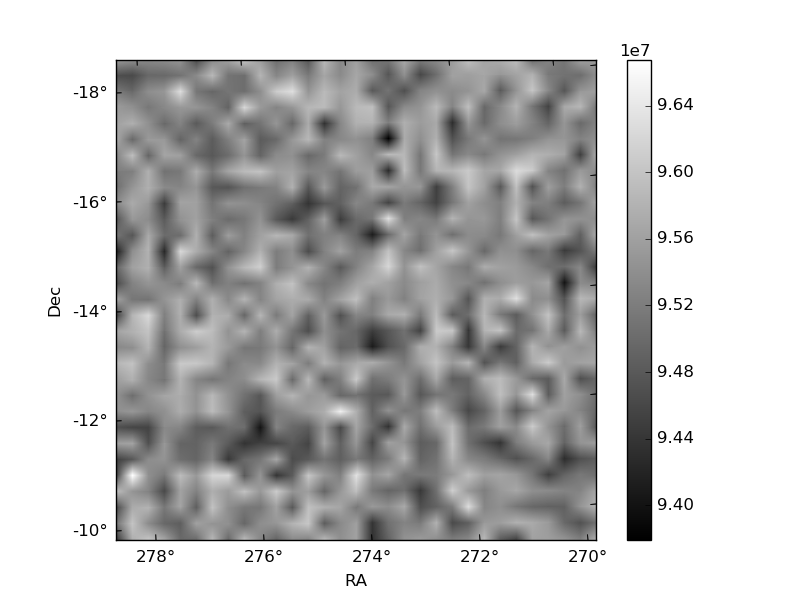
Quadrant B |
|---|---|---|---|
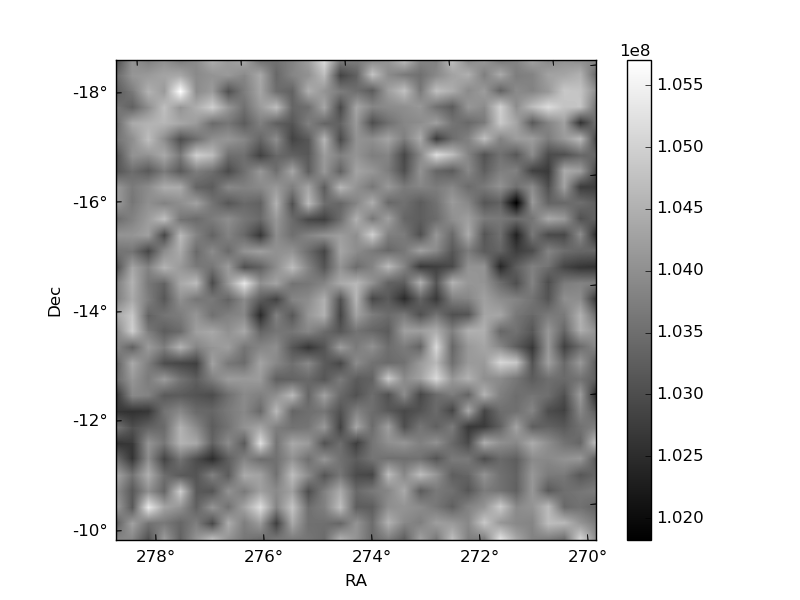
| Quadrant D | 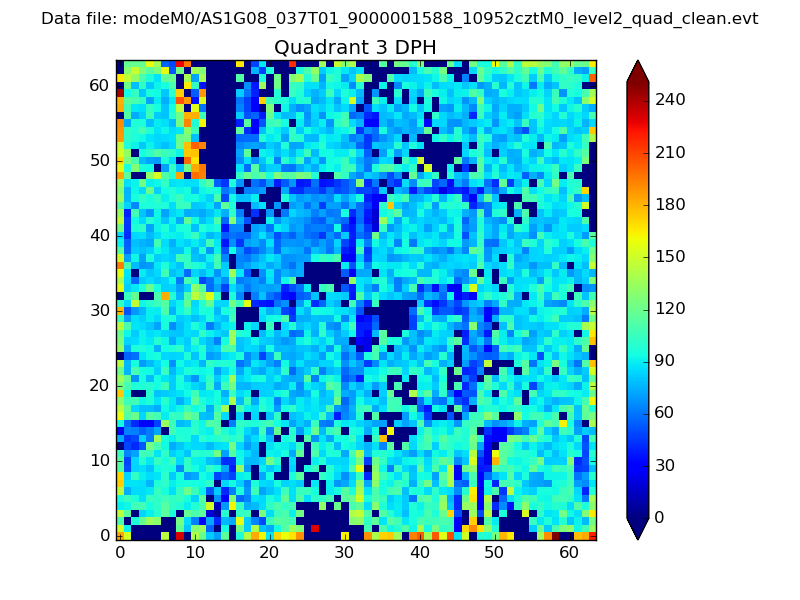 |
 |
Quadrant C |
| Plot type | Count rate plots | Images |
|---|---|---|
| Comparison with Poisson distribution Blue bars denote a histogram of data divided into 1 sec bins. Red curve is a Poisson curve with rate = median count rate of data. |
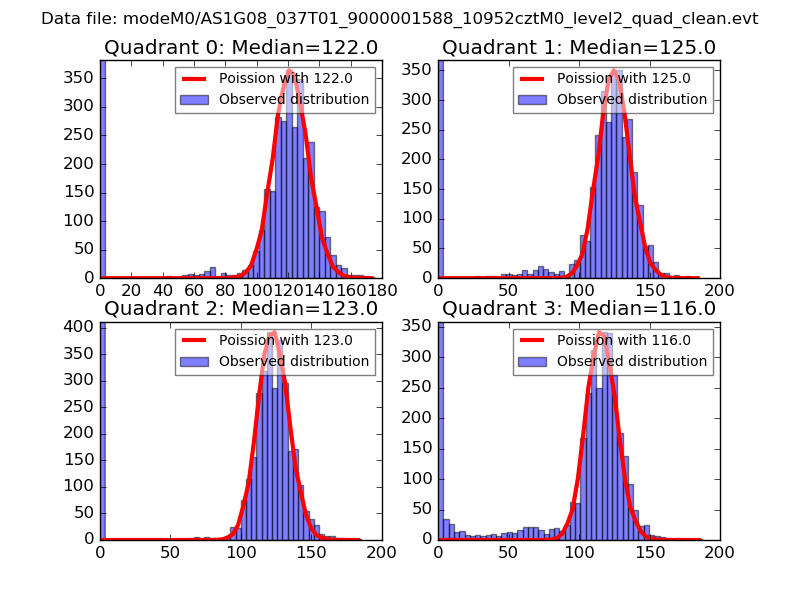 |
 |
| Quadrant-wise count rates Data is divided into 100 sec bins |
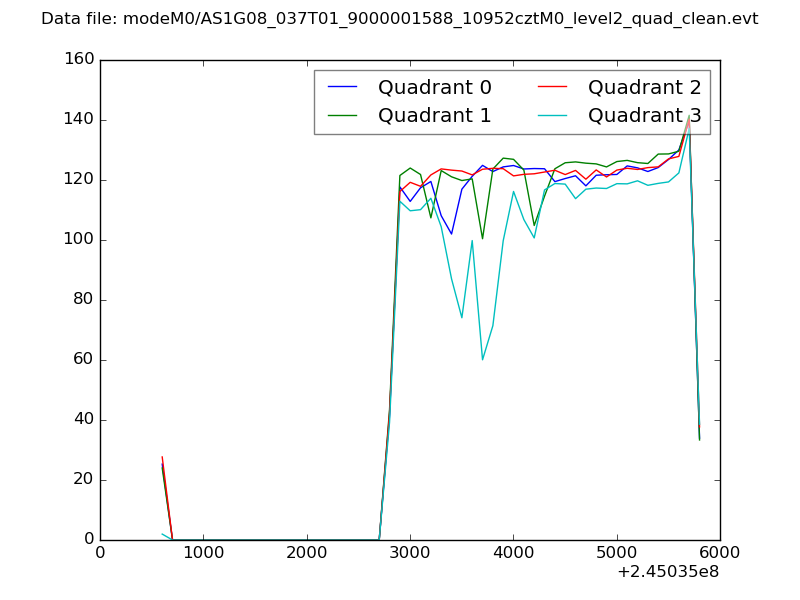 |
|
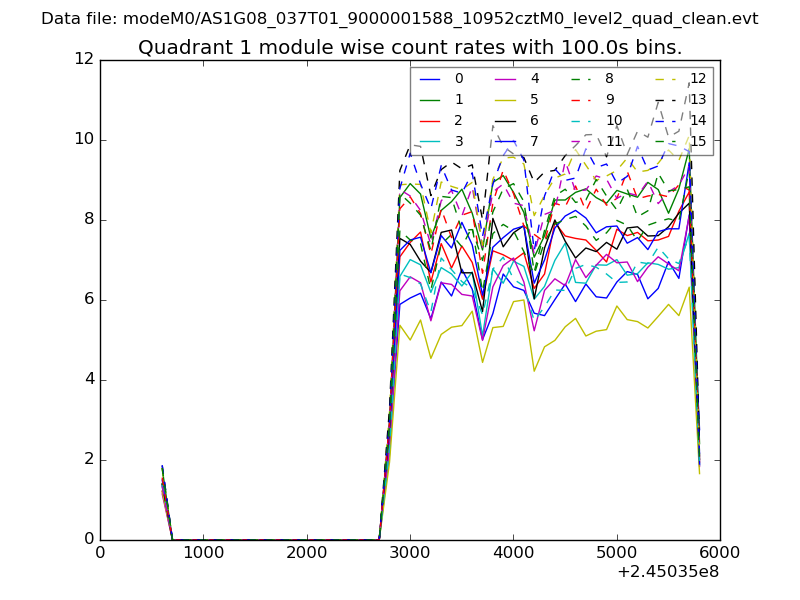
| Module-wise count rates for Quadrant A Data is divided into 100 sec bins |
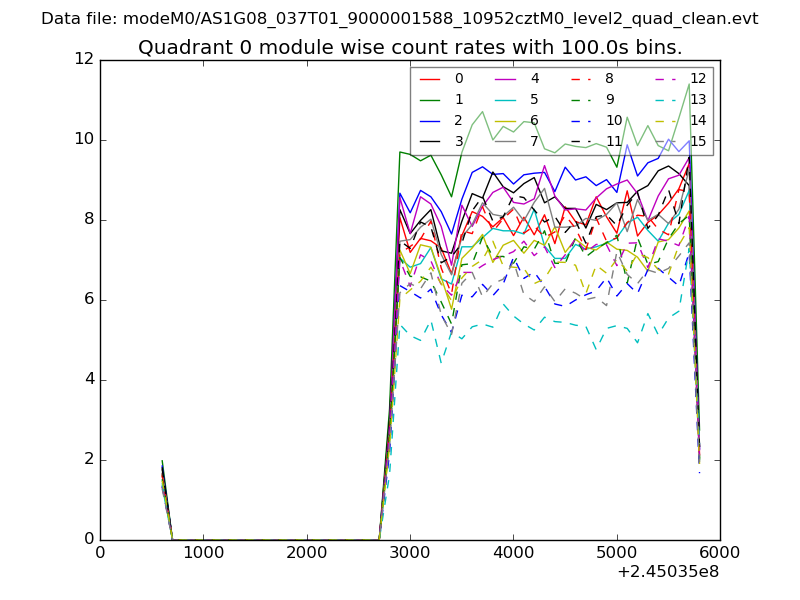 |
 |
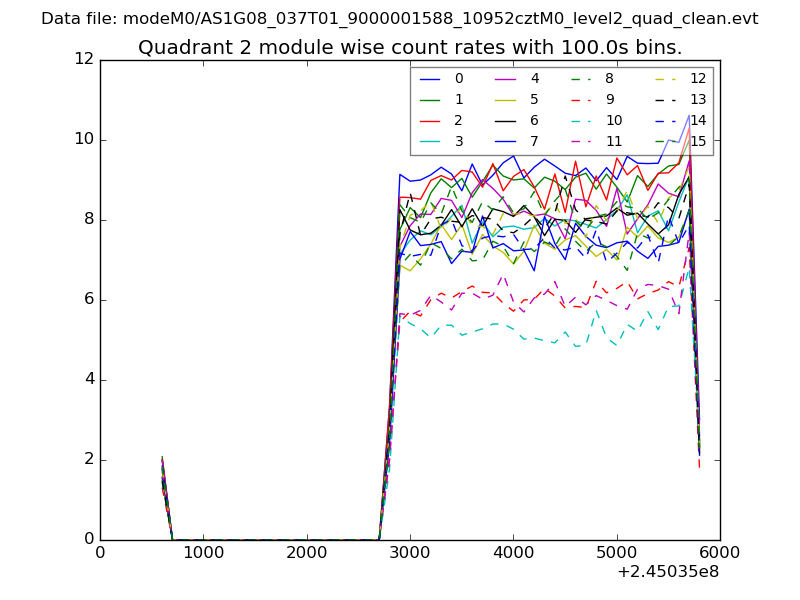
| Module-wise count rates for Quadrant B Data is divided into 100 sec bins |
 |
 |
| Module-wise count rates for Quadrant C Data is divided into 100 sec bins |
 |
 |
| Module-wise count rates for Quadrant D Data is divided into 100 sec bins |
 |
 |
| Parameter | Plot |
|---|---|
| CZT HV Monitor | 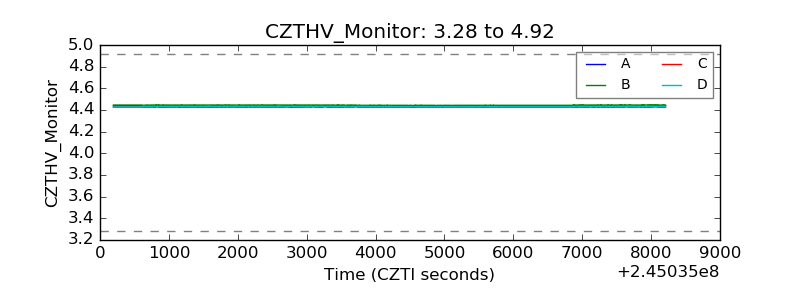 |
| D_VDD | 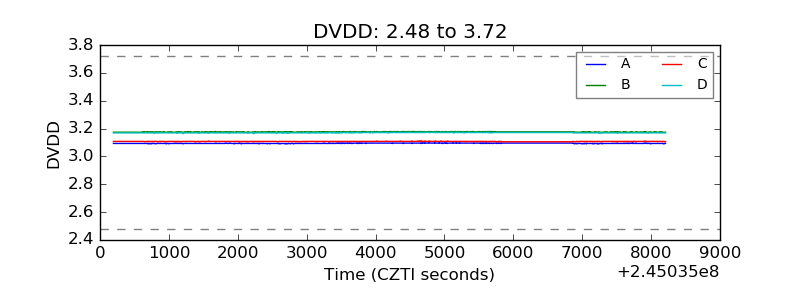 |
| Temperature 1 | 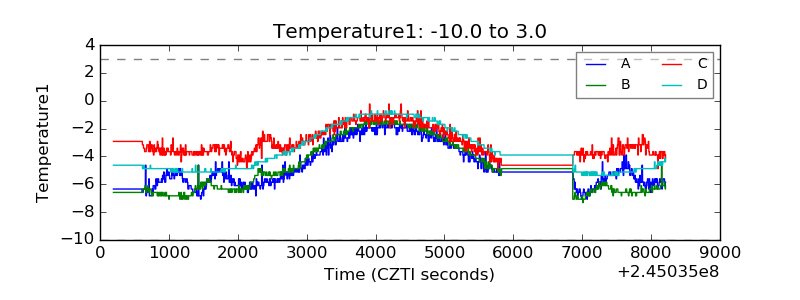 |
| Veto HV Monitor | 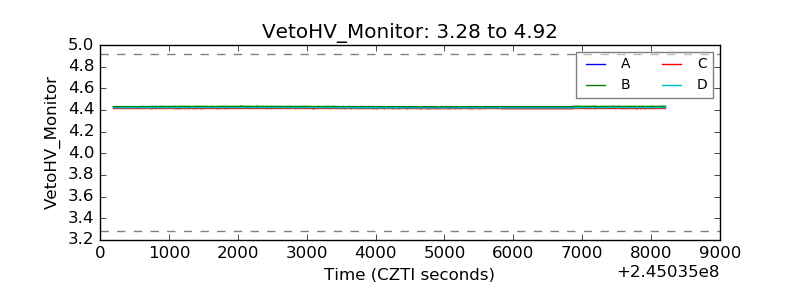 |
| Veto LLD | 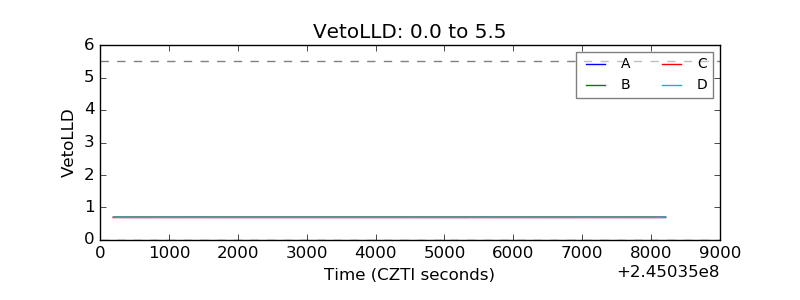 |
| Alpha Counter | 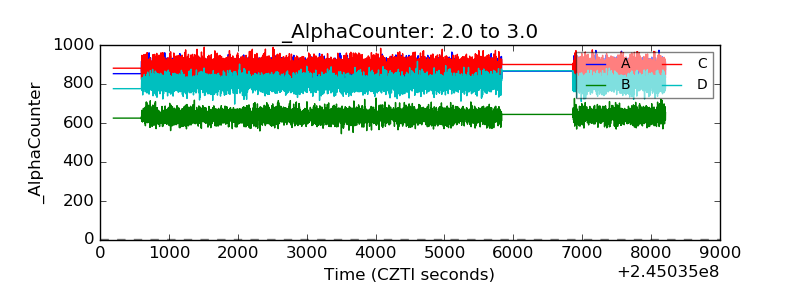 |
| _CPM_Rate | 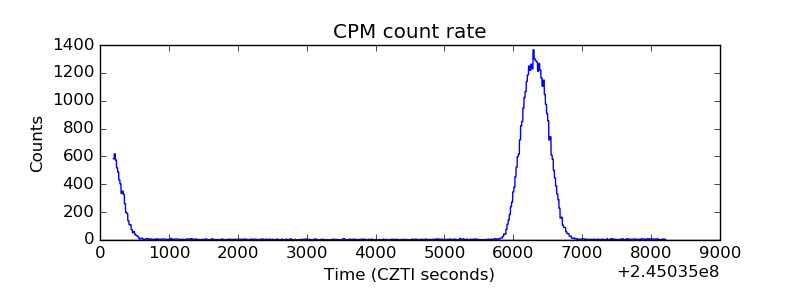 |
| CZT Counter | 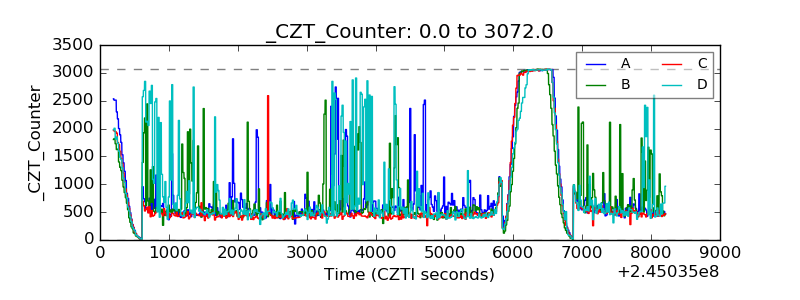 |
| +2.5 Volts monitor |  |
| +5 Volts monitor |  |
| _ROLL_ROT | 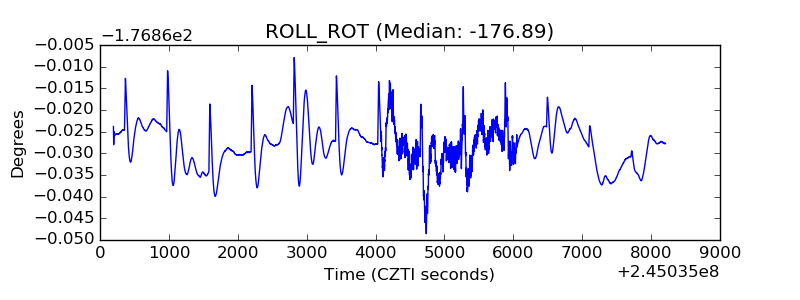 |
| _Roll_DEC | 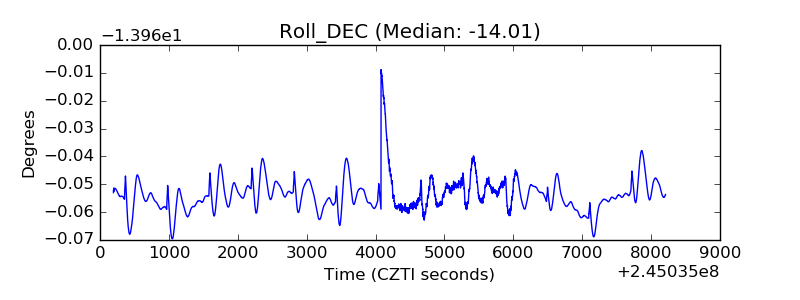 |
| _Roll_RA | 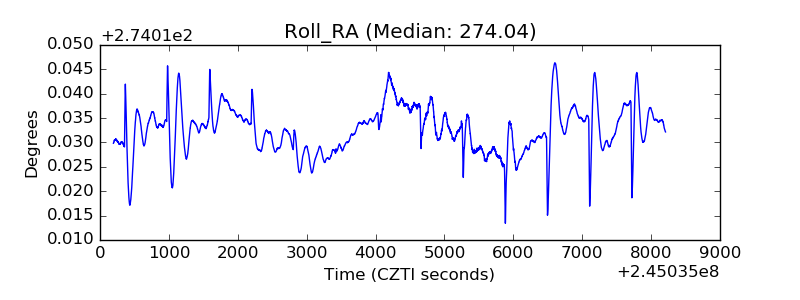 |
| Veto Counter | 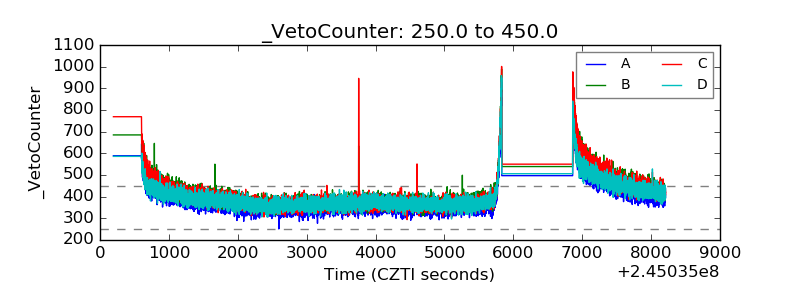 |