| Param | Original file | Final file |
|---|---|---|
| Filename | modeM0/AS1G08_037T01_9000001588_10954cztM0_level2.evt | modeM0/AS1G08_037T01_9000001588_10954cztM0_level2_quad_clean.evt |
| Size (bytes) | 320,961,600 | 43,424,640 |
| Size | 306.1 MB | 41.4 MB |
| Events in quadrant A | 2,351,945 | 262,828 |
| Events in quadrant B | 2,753,102 | 264,318 |
| Events in quadrant C | 1,826,145 | 263,283 |
| Events in quadrant D | 2,519,950 | 245,457 |
| Mode M0 | |||
|---|---|---|---|
| Quadrant | BADHDUFLAG | Total packets | Discarded packets |
| A | 0 | 9443 | 1 |
| B | 0 | 10667 | 1 |
| C | 0 | 8033 | 1 |
| D | 0 | 10042 | 1 |
| Mode SS | |||
|---|---|---|---|
| Quadrant | BADHDUFLAG | Total packets | Discarded packets |
| A | 0 | 80 | 0 |
| B | 0 | 80 | 0 |
| C | 0 | 80 | 0 |
| D | 0 | 80 | 0 |
| Mode M9 | |||
|---|---|---|---|
| Quadrant | BADHDUFLAG | Total packets | Discarded packets |
| A | 0 | 2 | 0 |
| B | 0 | 2 | 0 |
| C | 0 | 2 | 0 |
| D | 0 | 3 | 0 |
| Quadrant | Total seconds | Saturated seconds | Saturation percentage |
|---|---|---|---|
| A | 3944 | 46 | 1.166329% |
| B | 3944 | 231 | 5.856998% |
| C | 3944 | 10 | 0.253550% |
| D | 3944 | 144 | 3.651116% |
Noise dominated data is calculated using 1-second bins in cleaned event files. If a bin has >2000 counts, and if more than 50% of those come from <1% of pixels, then it is considered to be noise-dominated and hence unusable.
| Quadrant | # 1 sec bins | Bins with >0 counts | Bins with >2000 counts | High rate bins dominated by noise | Noise dominated (total time) | Noise dominated (detector-on time) | Marked lightcurve |
|---|---|---|---|---|---|---|---|
| A | 3944 | 3944 | 22 | 22 | 0.56% | 0.56% | 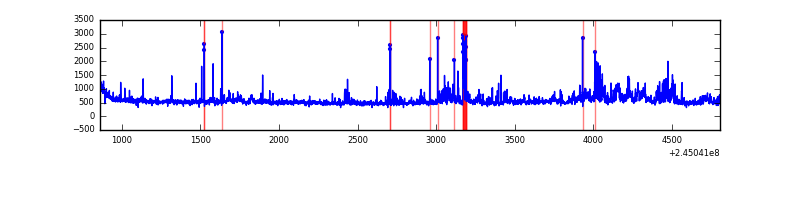 |
| B | 3944 | 3944 | 125 | 125 | 3.17% | 3.17% | 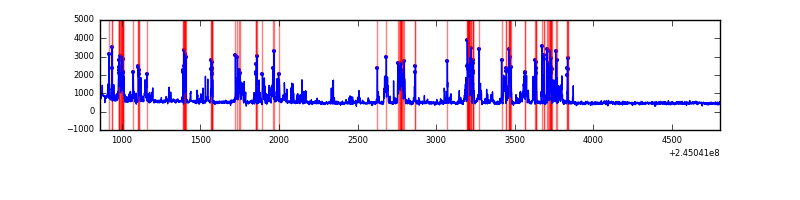 |
| C | 3944 | 3944 | 0 | 0 | 0.00% | 0.00% |  |
| D | 3944 | 3944 | 116 | 116 | 2.94% | 2.94% | 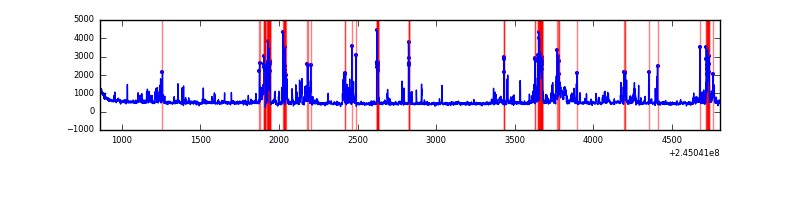 |
Top three noisy pixels from each quadrant. If the there are fewer than three noisy pixels in the level2.evt file, extra rows are filled as -1
| Pixel properties | Quadrant properties | ||||||
|---|---|---|---|---|---|---|---|
| Quadrant | DetID | PixID | Counts | Sigma | Mean | Median | Sigma |
| A | 8 | 5 | 331065 | 3331.56 | 485 | 476 | 99.2 |
| A | 8 | 15 | 147483 | 1481.48 | 485 | 476 | 99.2 |
| A | 11 | 29 | 6806 | 63.79 | 485 | 476 | 99.2 |
| B | 4 | 239 | 829667 | 9057.15 | 479 | 469 | 91.6 |
| B | 0 | 214 | 24955 | 267.46 | 479 | 469 | 91.6 |
| B | 0 | 219 | 10792 | 112.76 | 479 | 469 | 91.6 |
| C | 13 | 61 | 3466 | 27.79 | 467 | 471 | 107.8 |
| C | 8 | 222 | 1396 | 8.58 | 467 | 471 | 107.8 |
| C | 14 | 234 | 1360 | 8.25 | 467 | 471 | 107.8 |
| D | 1 | 52 | 243521 | 2172.51 | 459 | 446 | 111.9 |
| D | 10 | 253 | 138273 | 1231.85 | 459 | 446 | 111.9 |
| D | 13 | 249 | 137162 | 1221.92 | 459 | 446 | 111.9 |
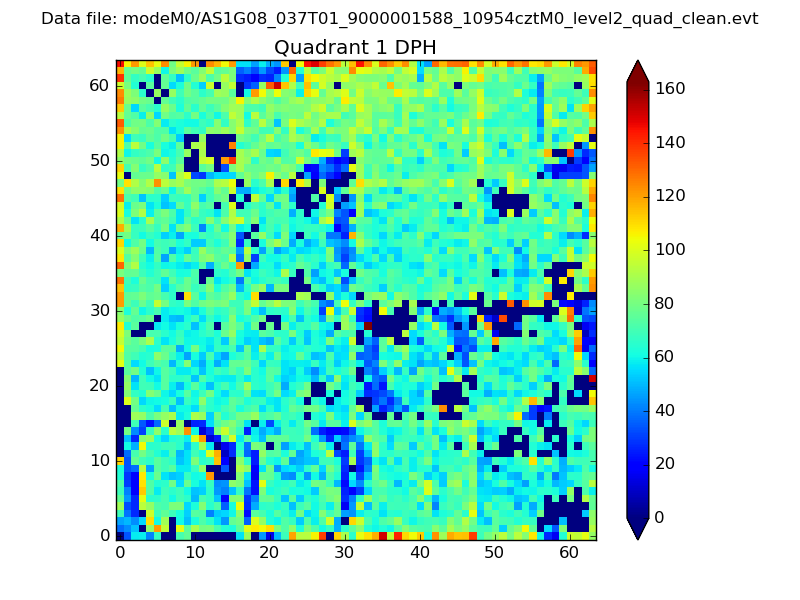
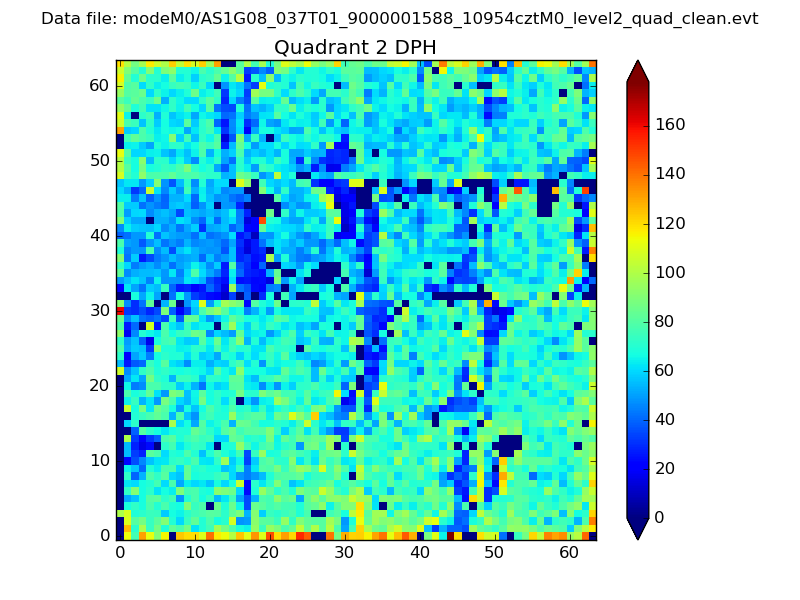
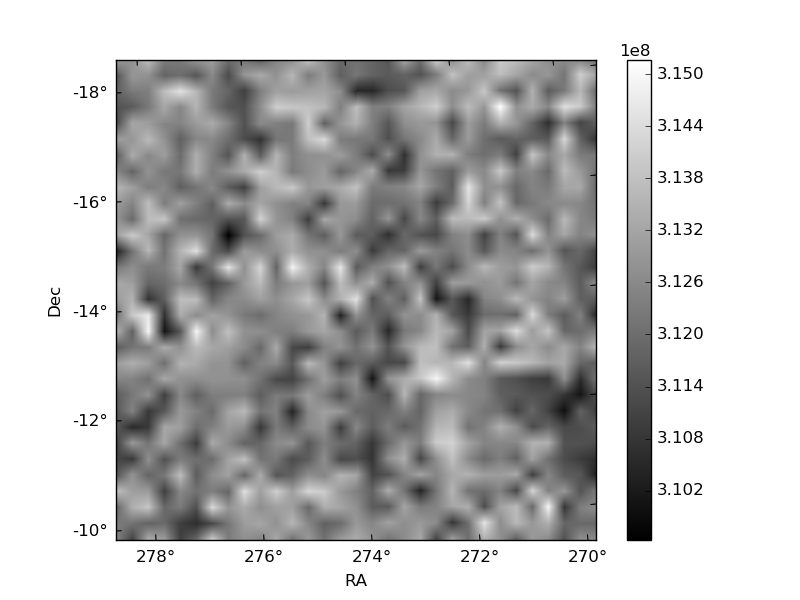
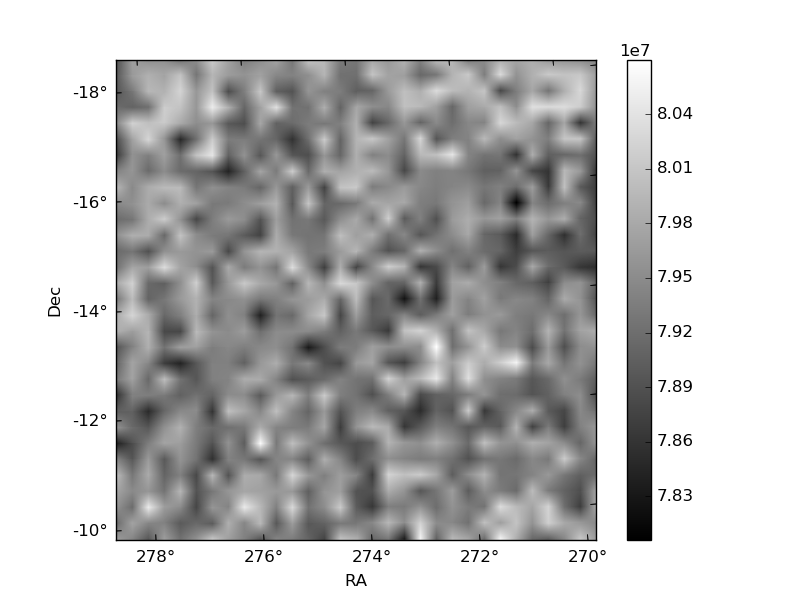
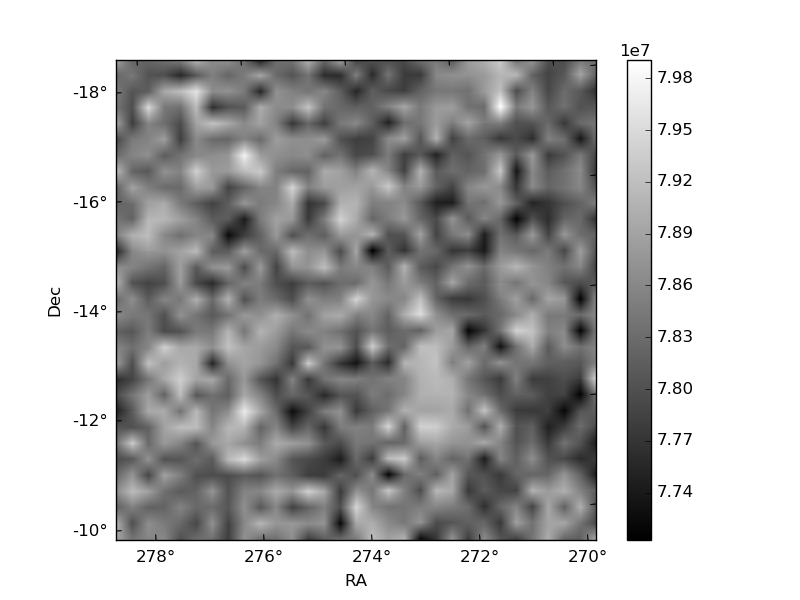
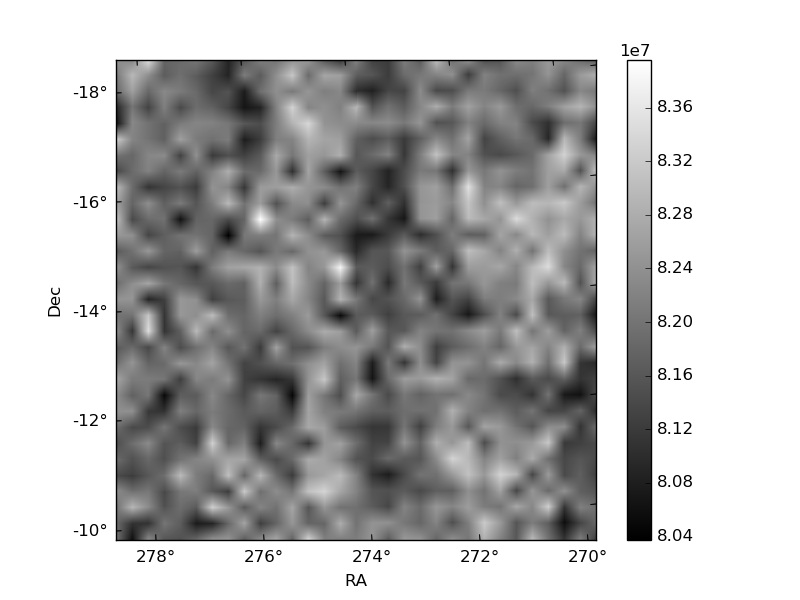
Histogram calculated using DETX and DETY for each event in the final _common_clean file
| Quadrant A | 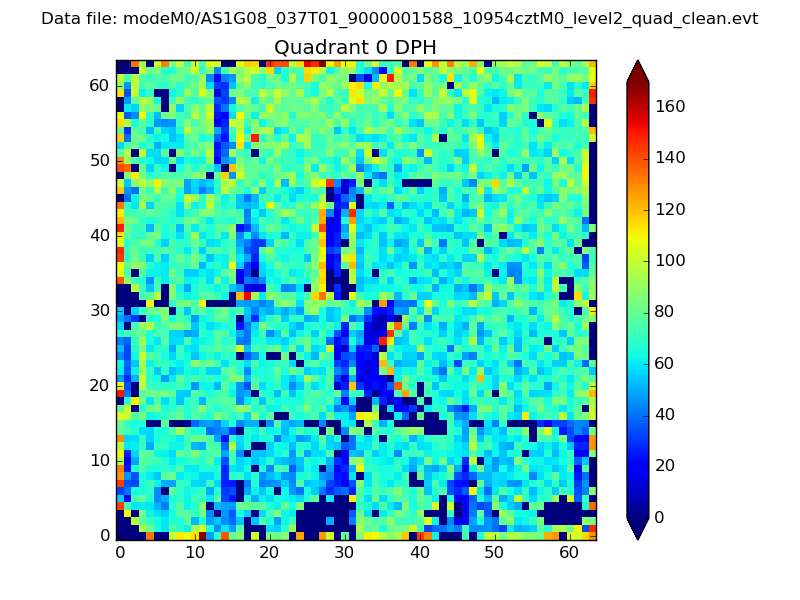 |
 |
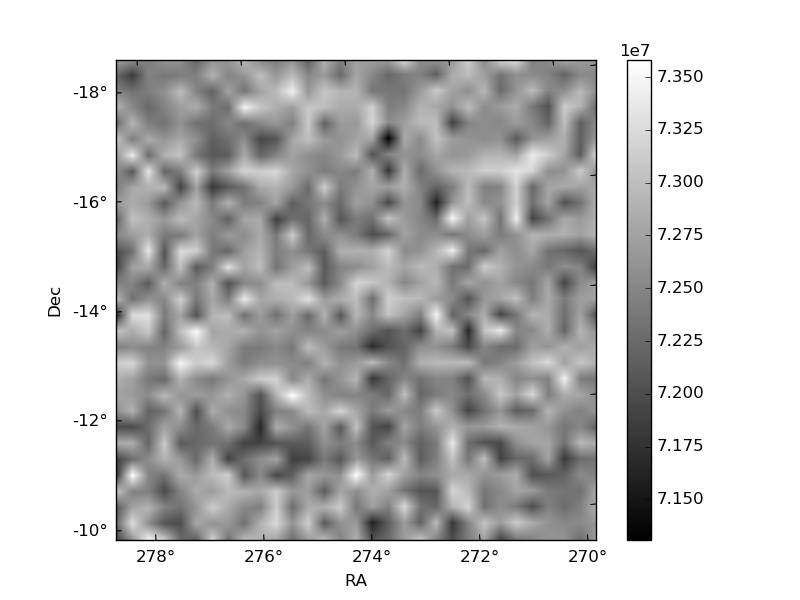
Quadrant B |
|---|---|---|---|
| Quadrant D | 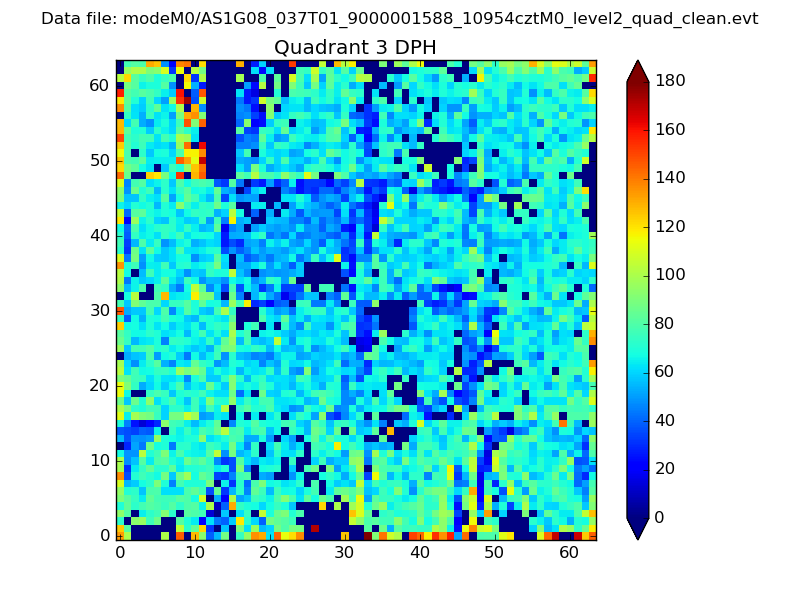 |
 |
Quadrant C |
| Plot type | Count rate plots | Images |
|---|---|---|
| Comparison with Poisson distribution Blue bars denote a histogram of data divided into 1 sec bins. Red curve is a Poisson curve with rate = median count rate of data. |
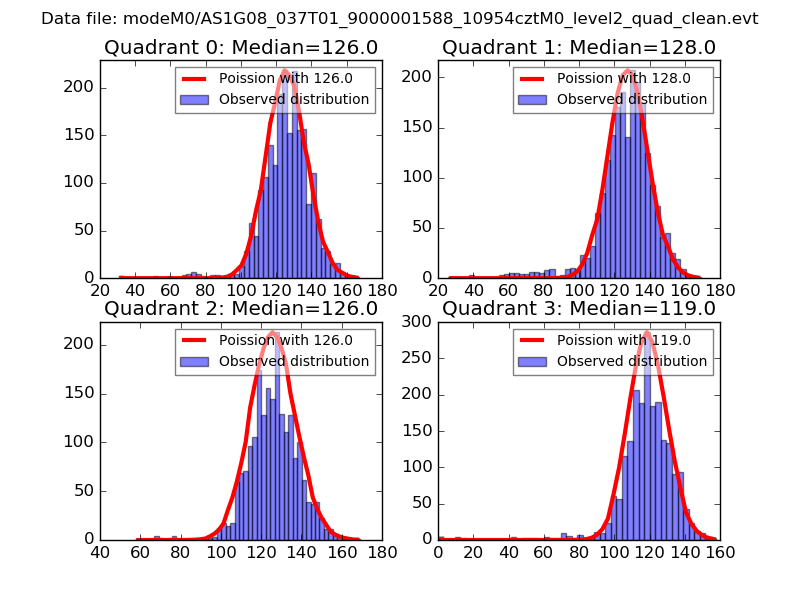 |
 |
| Quadrant-wise count rates Data is divided into 100 sec bins |
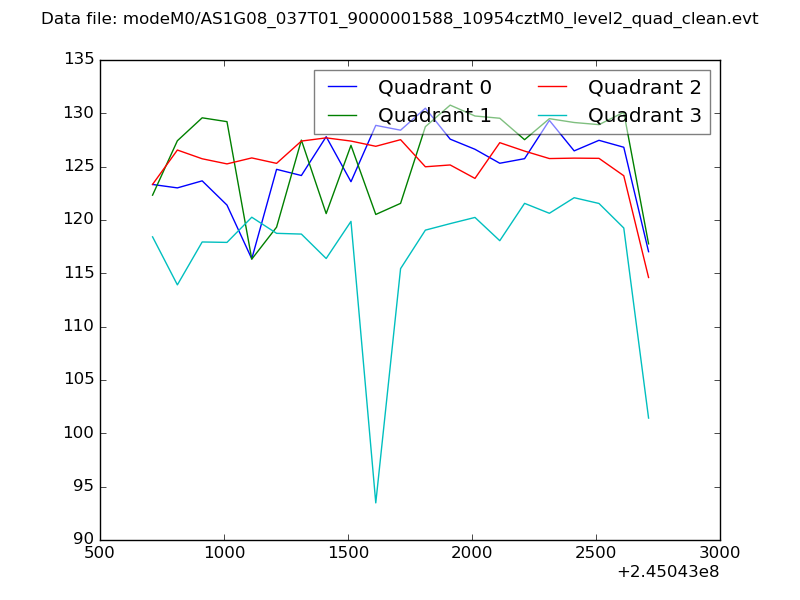 |
|
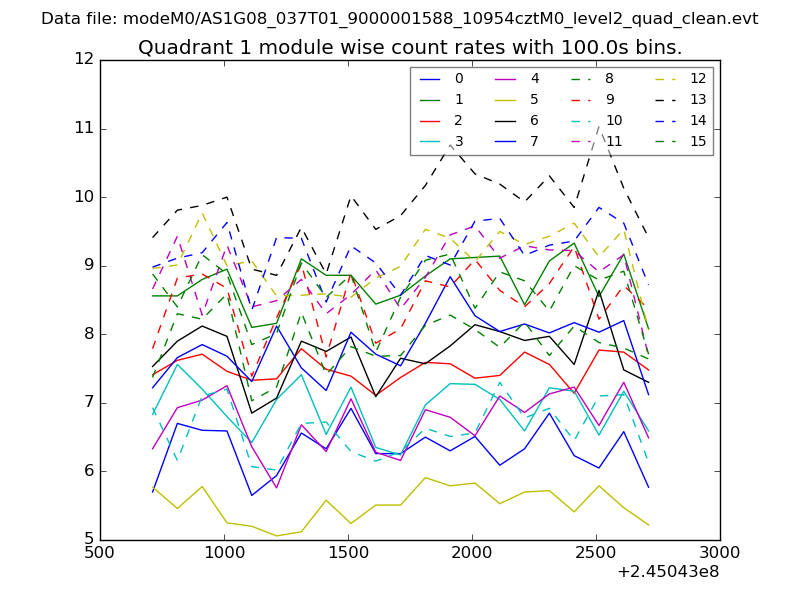
| Module-wise count rates for Quadrant A Data is divided into 100 sec bins |
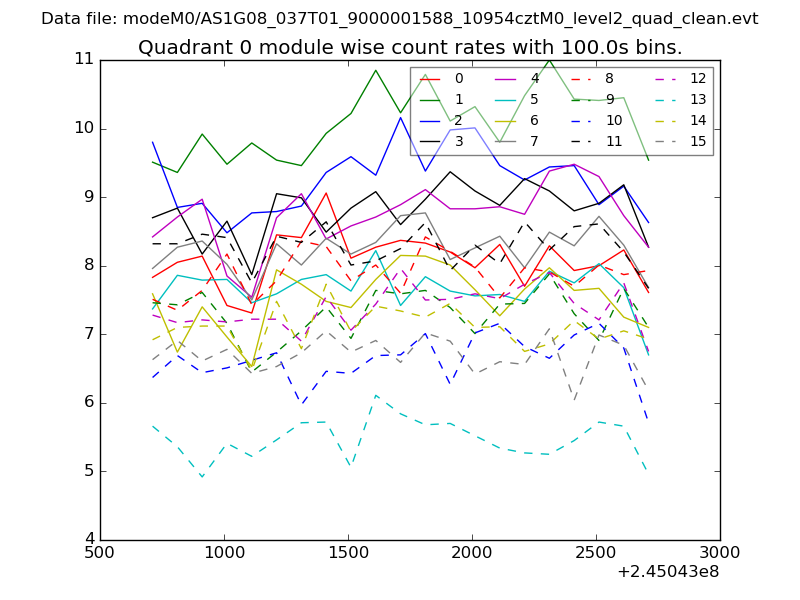 |
 |
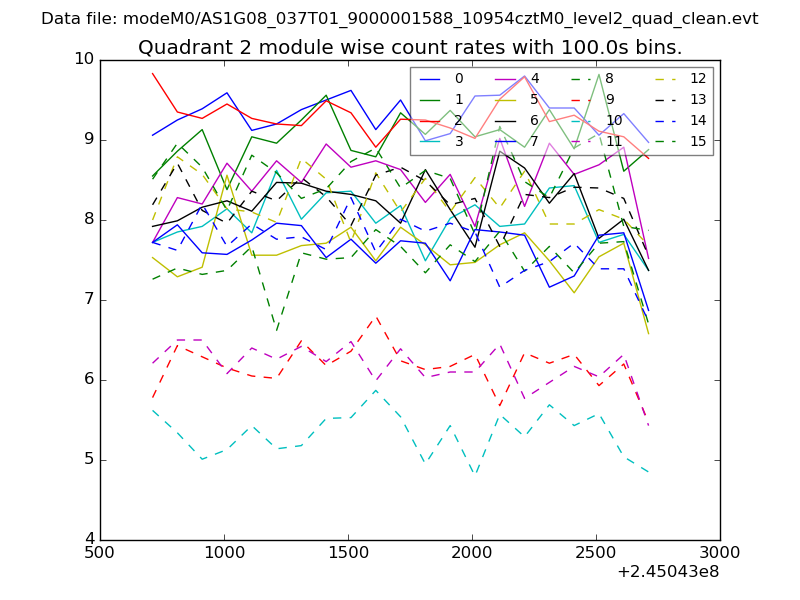
| Module-wise count rates for Quadrant B Data is divided into 100 sec bins |
 |
 |
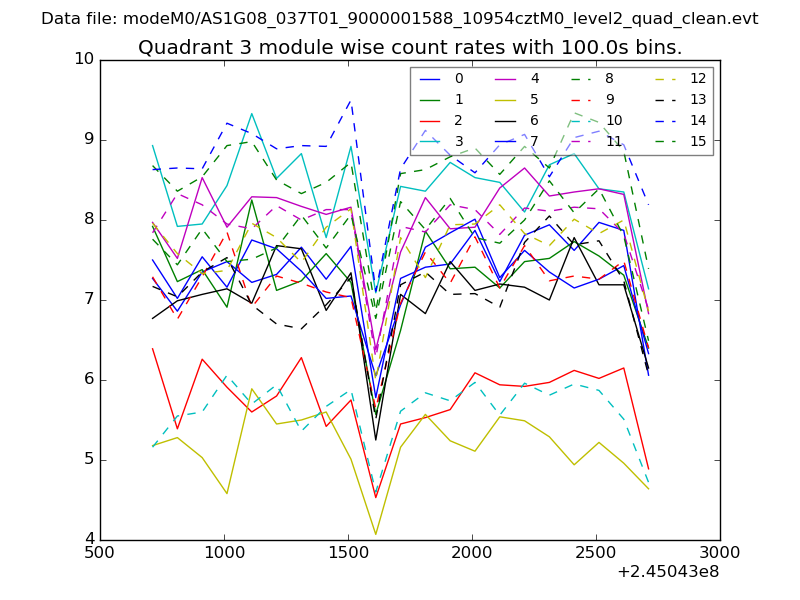
| Module-wise count rates for Quadrant C Data is divided into 100 sec bins |
 |
 |
| Module-wise count rates for Quadrant D Data is divided into 100 sec bins |
 |
 |
| Parameter | Plot |
|---|---|
| CZT HV Monitor | 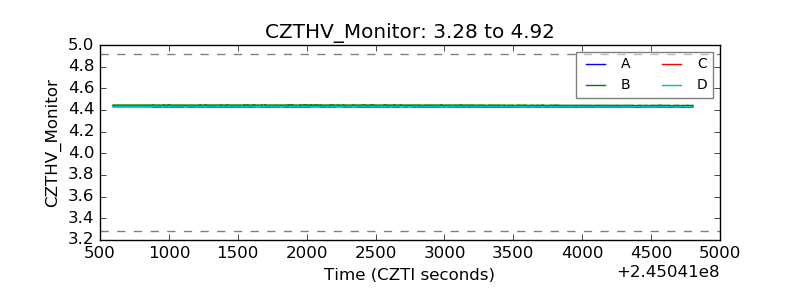 |
| D_VDD | 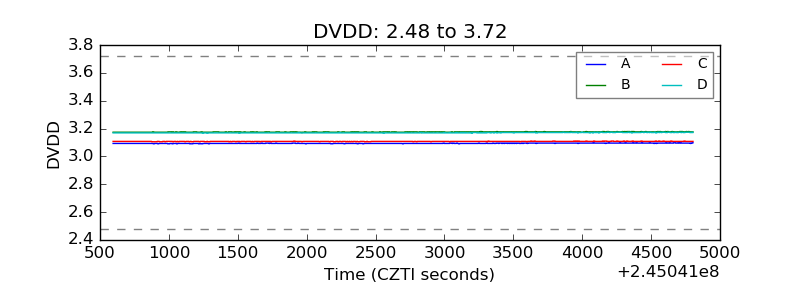 |
| Temperature 1 | 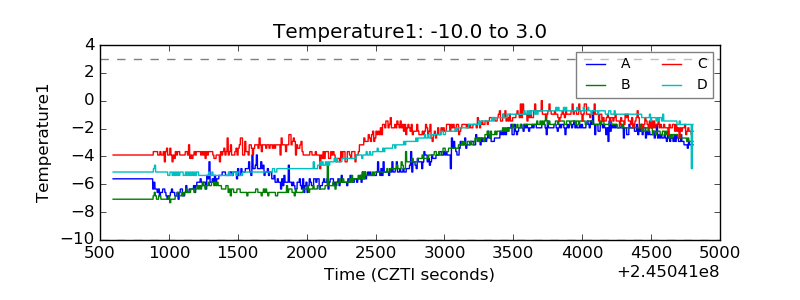 |
| Veto HV Monitor | 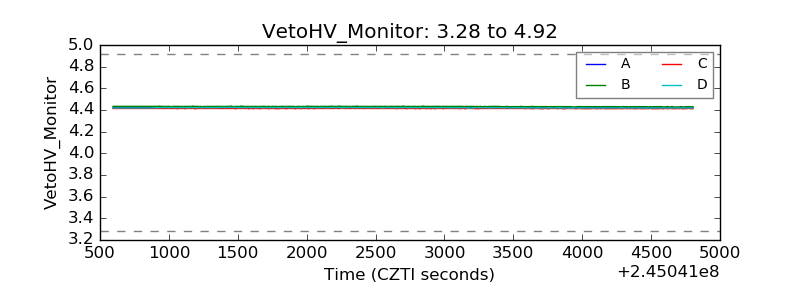 |
| Veto LLD | 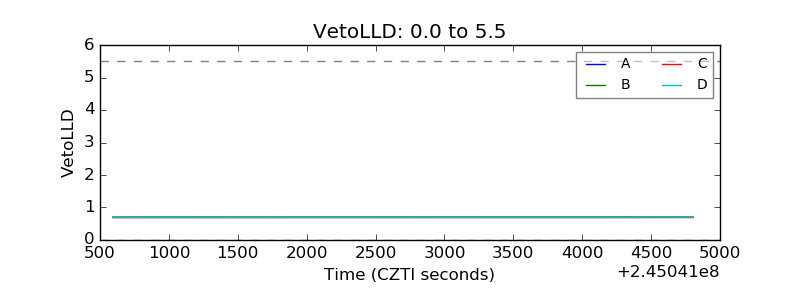 |
| Alpha Counter | 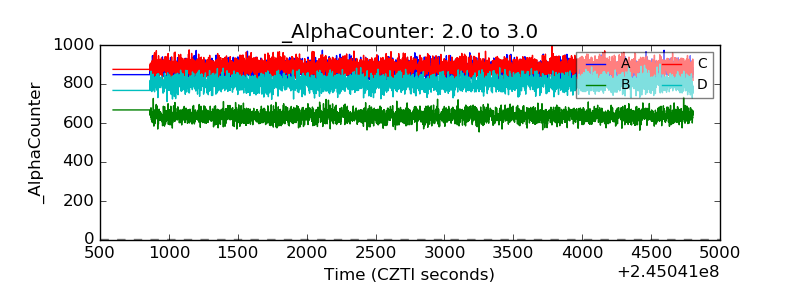 |
| _CPM_Rate | 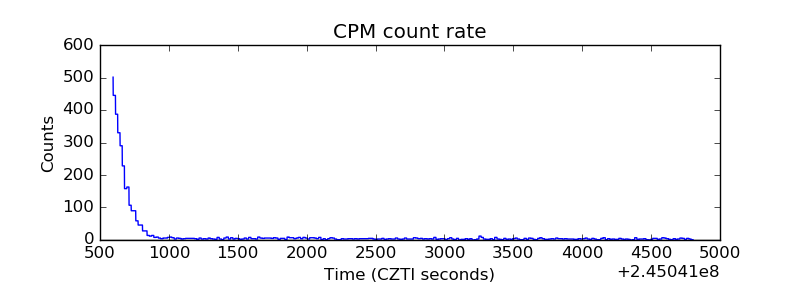 |
| CZT Counter | 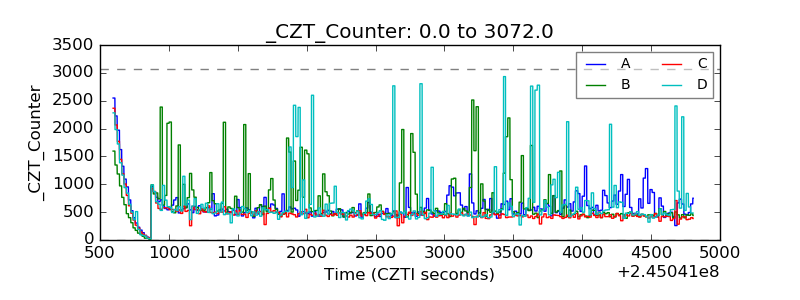 |
| +2.5 Volts monitor |  |
| +5 Volts monitor |  |
| _ROLL_ROT | 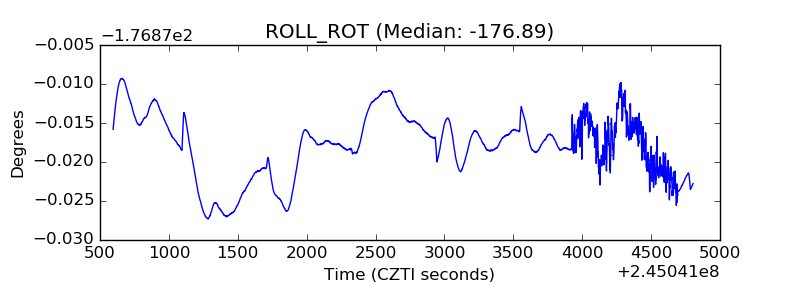 |
| _Roll_DEC | 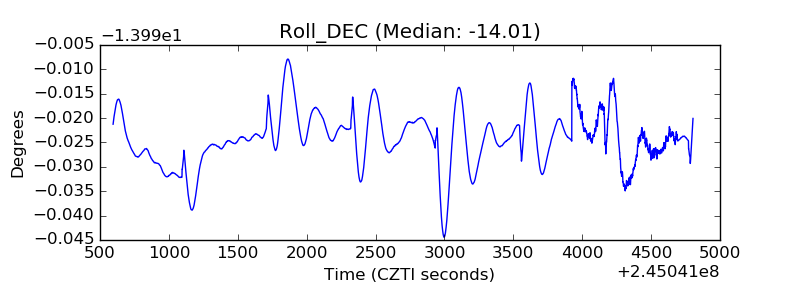 |
| _Roll_RA | 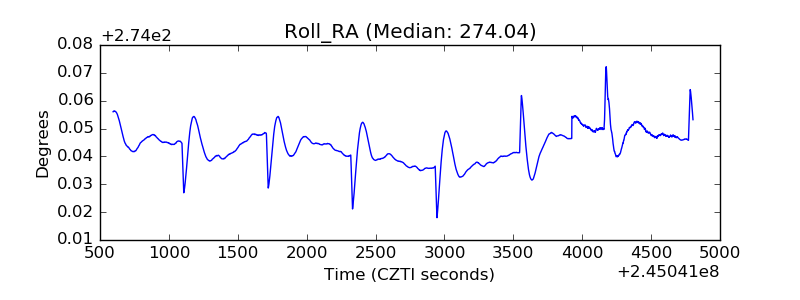 |
| Veto Counter | 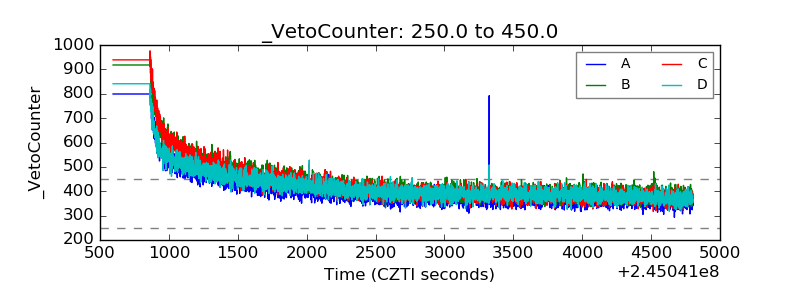 |