| Param | Original file | Final file |
|---|---|---|
| Filename | modeM0/AS1T01_193T01_9000001590cztM0_level2.fits | modeM0/AS1T01_193T01_9000001590cztM0_level2_quad_clean.evt |
| Size (bytes) | 572,466,240 | 713,180,160 |
| Size | 545.9 MB | 680.1 MB |
| Events in quadrant A | 3,396,970 | 4,421,576 |
| Events in quadrant B | 3,320,490 | 4,502,624 |
| Events in quadrant C | 3,469,736 | 4,517,866 |
| Events in quadrant D | 2,887,370 | 3,900,527 |
| Mode SS | |||
|---|---|---|---|
| Quadrant | BADHDUFLAG | Total packets | Discarded packets |
| A | 0 | 1262 | 0 |
| B | 0 | 1266 | 0 |
| C | 0 | 1266 | 0 |
| D | 0 | 1264 | 0 |
| Mode M0 | |||
|---|---|---|---|
| Quadrant | BADHDUFLAG | Total packets | Discarded packets |
| A | 0 | 170240 | 0 |
| B | 0 | 155291 | 0 |
| C | 0 | 126783 | 0 |
| D | 0 | 167899 | 0 |
| Mode M9 | |||
|---|---|---|---|
| Quadrant | BADHDUFLAG | Total packets | Discarded packets |
| A | 0 | 96 | 0 |
| B | 0 | 96 | 0 |
| C | 0 | 97 | 0 |
| D | 0 | 96 | 0 |
| Quadrant | Total seconds | Saturated seconds | Saturation percentage |
|---|---|---|---|
| A | 62061 | 3772 | 6.077891% |
| B | 62052 | 3028 | 4.879778% |
| C | 62151 | 432 | 0.695081% |
| D | 62002 | 4477 | 7.220735% |
Noise dominated data is calculated using 1-second bins in cleaned event files. If a bin has >2000 counts, and if more than 50% of those come from <1% of pixels, then it is considered to be noise-dominated and hence unusable.
| Quadrant | # 1 sec bins | Bins with >0 counts | Bins with >2000 counts | High rate bins dominated by noise | Noise dominated (total time) | Noise dominated (detector-on time) | Marked lightcurve |
|---|---|---|---|---|---|---|---|
| A | 71567 | 62423 | 0 | 0 | 0.00% | 0.00% | 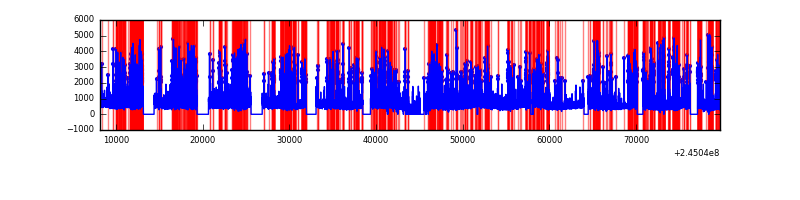 |
| B | 71567 | 62462 | 0 | 0 | 0.00% | 0.00% | 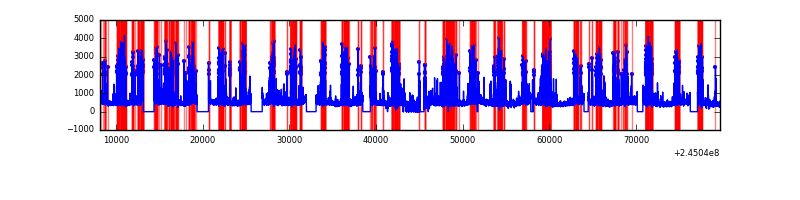 |
| C | 71567 | 62557 | 0 | 0 | 0.00% | 0.00% | 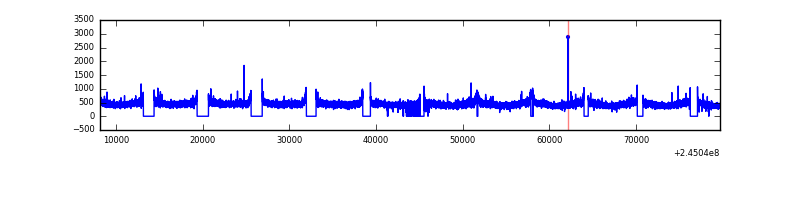 |
| D | 71567 | 61862 | 0 | 0 | 0.00% | 0.00% | 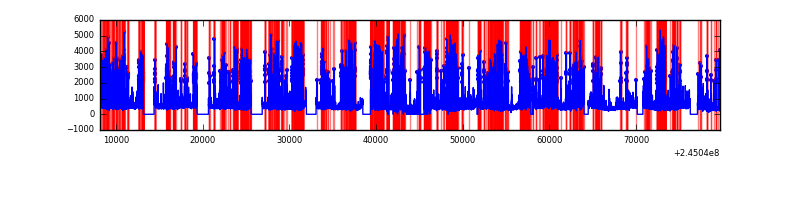 |
Top three noisy pixels from each quadrant. If the there are fewer than three noisy pixels in the level2.evt file, extra rows are filled as -1
| Pixel properties | Quadrant properties | ||||||
|---|---|---|---|---|---|---|---|
| Quadrant | DetID | PixID | Counts | Sigma | Mean | Median | Sigma |
| A | 0 | 29 | 3392 | 11.56 | 885 | 832 | 221.5 |
| A | 7 | 110 | 2840 | 9.07 | 885 | 832 | 221.5 |
| A | 0 | 30 | 2675 | 8.32 | 885 | 832 | 221.5 |
| B | 2 | 9 | 2915 | 11.98 | 876 | 837 | 173.4 |
| B | 3 | 17 | 2210 | 7.92 | 876 | 837 | 173.4 |
| B | 12 | 226 | 2210 | 7.92 | 876 | 837 | 173.4 |
| C | 1 | 81 | 2746 | 7.97 | 915 | 852 | 237.7 |
| C | 1 | 80 | 2708 | 7.81 | 915 | 852 | 237.7 |
| C | 12 | 241 | 2462 | 6.77 | 915 | 852 | 237.7 |
| D | 6 | 231 | 2139 | 6.18 | 825 | 750 | 224.6 |
| D | 3 | 14 | 2116 | 6.08 | 825 | 750 | 224.6 |
| D | 7 | 5 | 2024 | 5.67 | 825 | 750 | 224.6 |
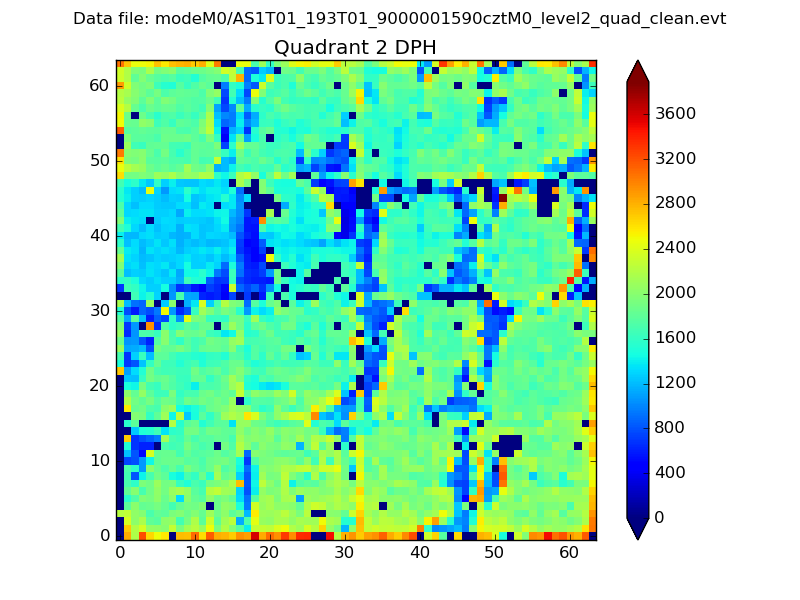
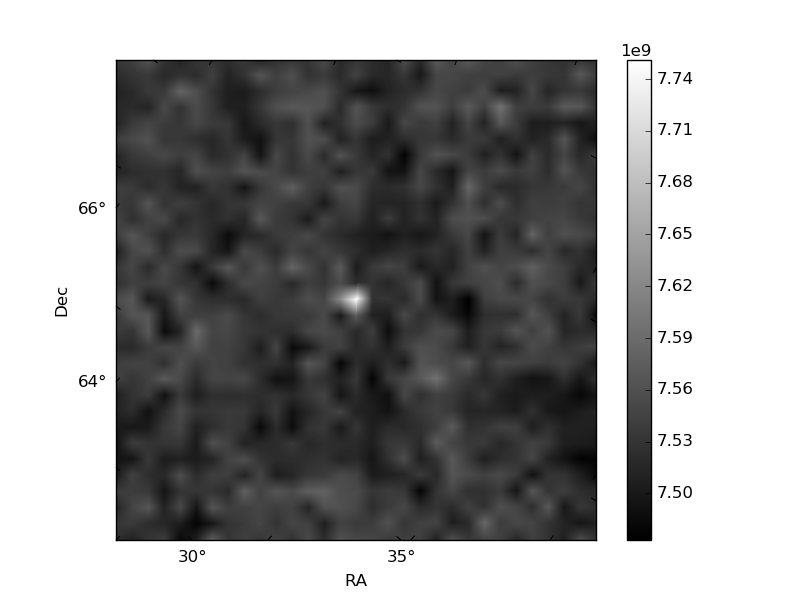
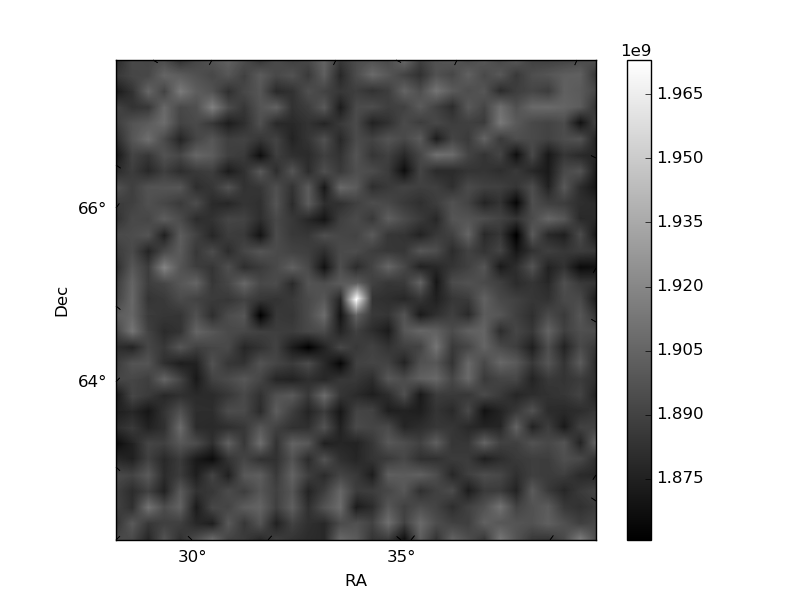
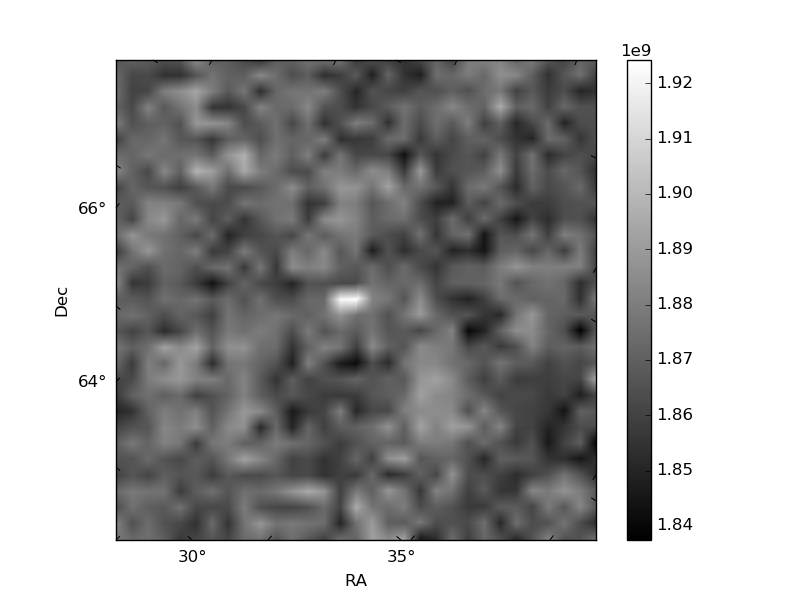
Histogram calculated using DETX and DETY for each event in the final _common_clean file
| Quadrant A | 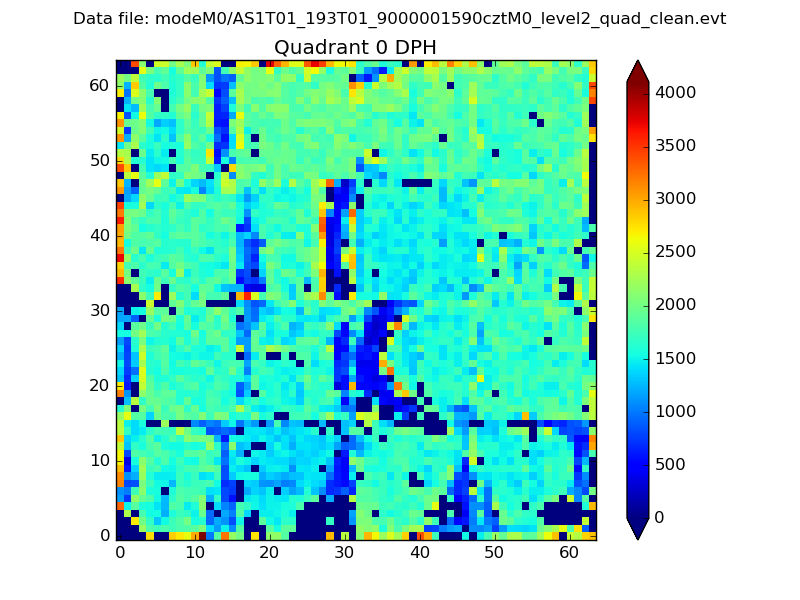 |
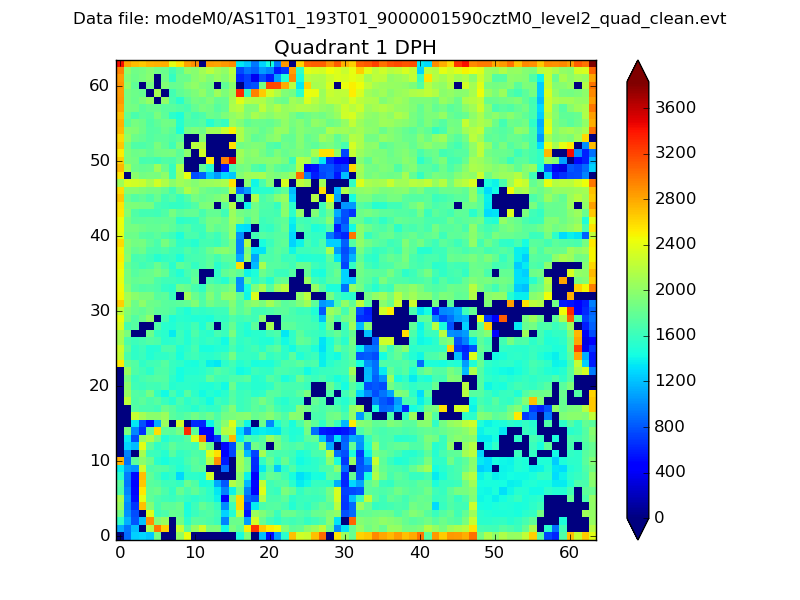 |
Quadrant B |
|---|---|---|---|
| Quadrant D | 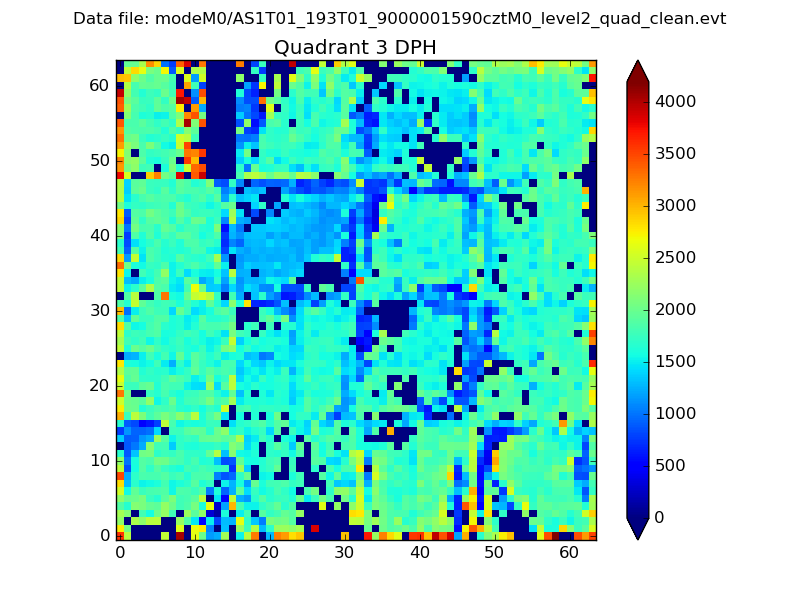 |
 |
Quadrant C |
| Plot type | Count rate plots | Images |
|---|---|---|
| Comparison with Poisson distribution Blue bars denote a histogram of data divided into 1 sec bins. Red curve is a Poisson curve with rate = median count rate of data. |
 |
 |
| Quadrant-wise count rates Data is divided into 100 sec bins |
 |
|
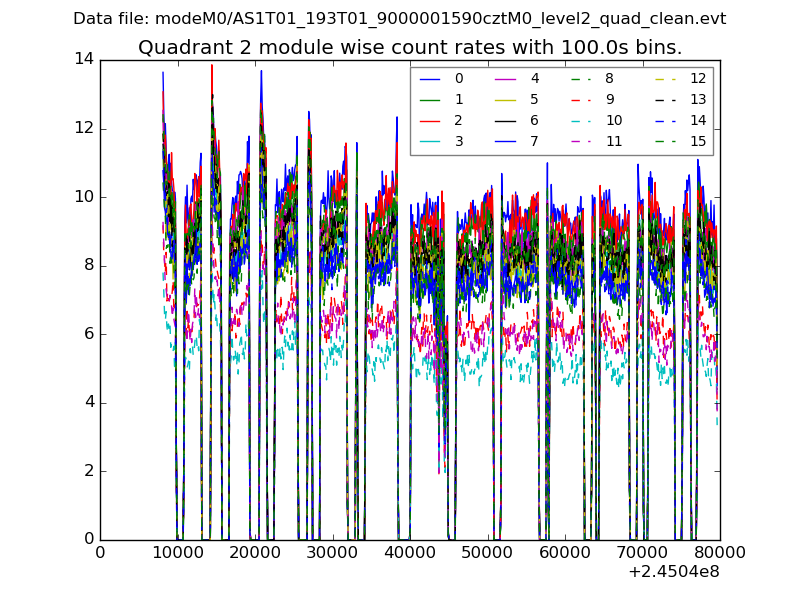
| Module-wise count rates for Quadrant A Data is divided into 100 sec bins |
 |
 |
| Module-wise count rates for Quadrant B Data is divided into 100 sec bins |
 |
 |
| Module-wise count rates for Quadrant C Data is divided into 100 sec bins |
 |
 |
| Module-wise count rates for Quadrant D Data is divided into 100 sec bins |
 |
 |
| Parameter | Plot |
|---|---|
| CZT HV Monitor |  |
| D_VDD | 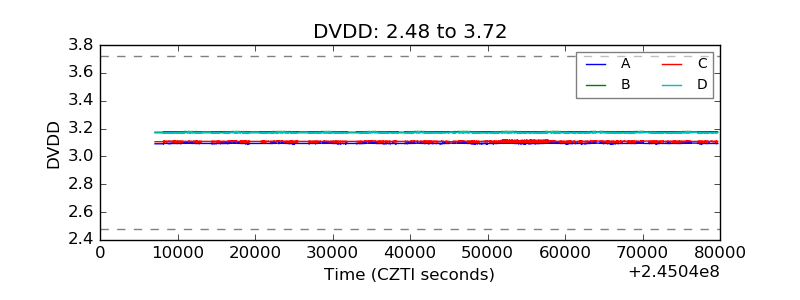 |
| Temperature 1 |  |
| Veto HV Monitor | 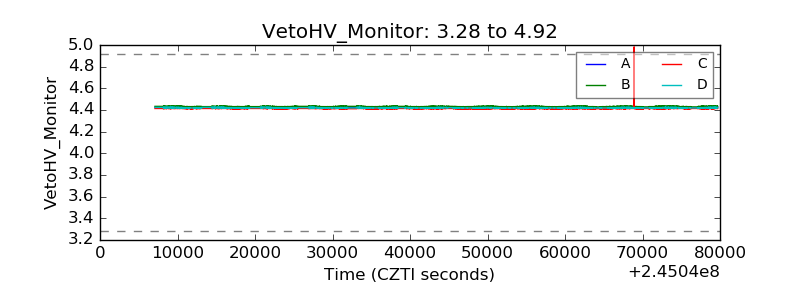 |
| Veto LLD | 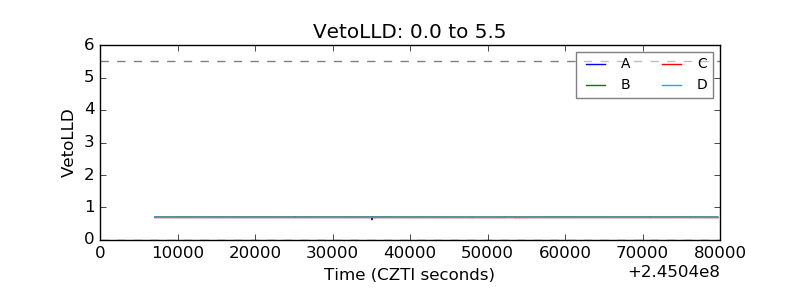 |
| Alpha Counter | 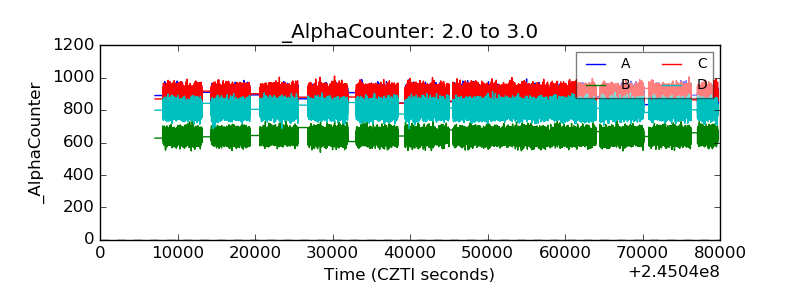 |
| _CPM_Rate | 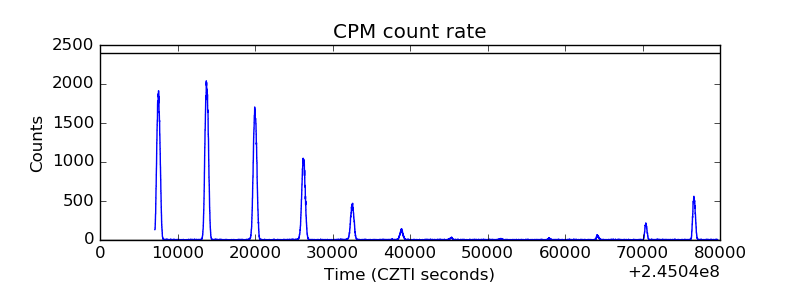 |
| CZT Counter | 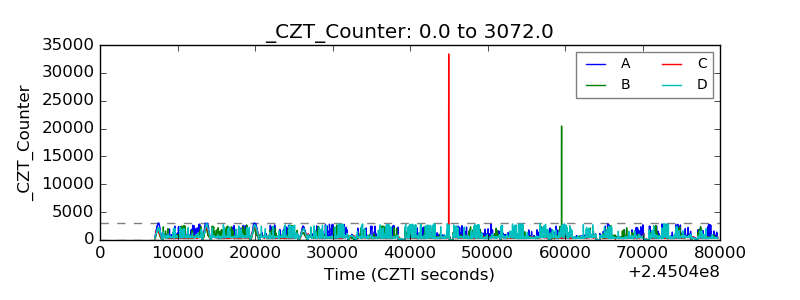 |
| +2.5 Volts monitor | 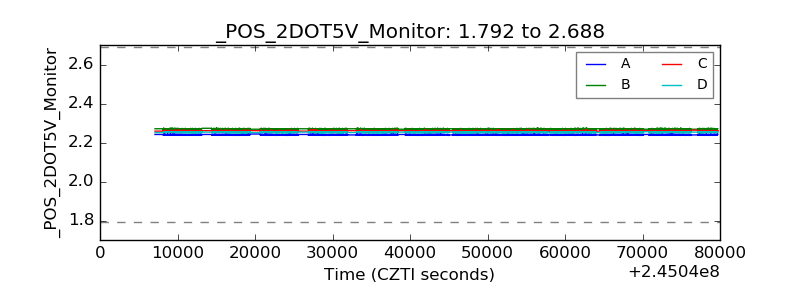 |
| +5 Volts monitor |  |
| _ROLL_ROT | 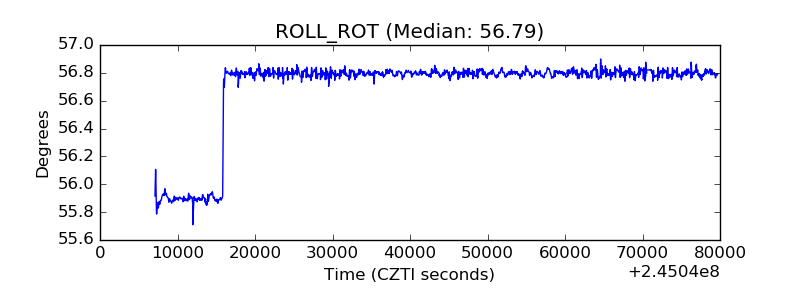 |
| _Roll_DEC | 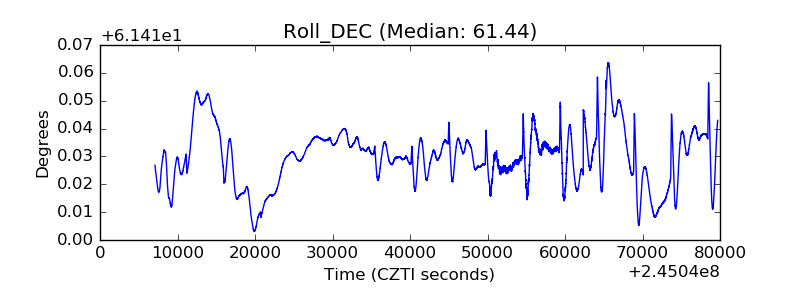 |
| _Roll_RA | 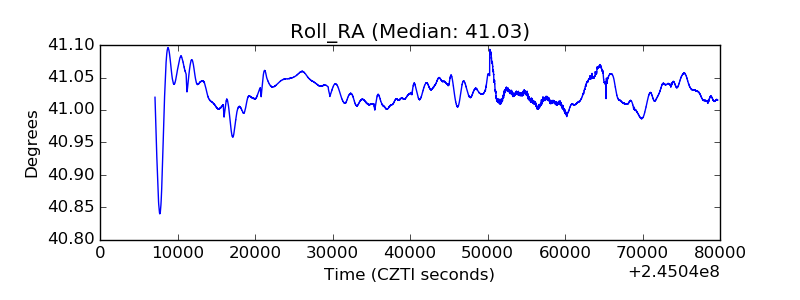 |
| Veto Counter |  |