| Param | Original file | Final file |
|---|---|---|
| Filename | modeM0/AS1T01_193T01_9000001590_10955cztM0_level2.evt | modeM0/AS1T01_193T01_9000001590_10955cztM0_level2_quad_clean.evt |
| Size (bytes) | 419,696,640 | 81,250,560 |
| Size | 400.3 MB | 77.5 MB |
| Events in quadrant A | 3,921,358 | 524,979 |
| Events in quadrant B | 3,332,462 | 540,509 |
| Events in quadrant C | 2,209,012 | 550,087 |
| Events in quadrant D | 2,927,418 | 514,070 |
| Mode SS | |||
|---|---|---|---|
| Quadrant | BADHDUFLAG | Total packets | Discarded packets |
| A | 0 | 112 | 22 |
| B | 0 | 112 | 16 |
| C | 0 | 112 | 18 |
| D | 0 | 112 | 16 |
| Mode M0 | |||
|---|---|---|---|
| Quadrant | BADHDUFLAG | Total packets | Discarded packets |
| A | 0 | 16860 | 2133 |
| B | 0 | 14869 | 1974 |
| C | 0 | 11212 | 1540 |
| D | 0 | 13916 | 2320 |
| Mode M9 | |||
|---|---|---|---|
| Quadrant | BADHDUFLAG | Total packets | Discarded packets |
| A | 0 | 12 | 0 |
| B | 0 | 12 | 0 |
| C | 0 | 12 | 0 |
| D | 0 | 12 | 0 |
| Quadrant | Total seconds | Saturated seconds | Saturation percentage |
|---|---|---|---|
| A | 4704 | 446 | 9.481293% |
| B | 4699 | 375 | 7.980421% |
| C | 4744 | 15 | 0.316189% |
| D | 4699 | 165 | 3.511385% |
Noise dominated data is calculated using 1-second bins in cleaned event files. If a bin has >2000 counts, and if more than 50% of those come from <1% of pixels, then it is considered to be noise-dominated and hence unusable.
| Quadrant | # 1 sec bins | Bins with >0 counts | Bins with >2000 counts | High rate bins dominated by noise | Noise dominated (total time) | Noise dominated (detector-on time) | Marked lightcurve |
|---|---|---|---|---|---|---|---|
| A | 6755 | 4894 | 297 | 297 | 4.40% | 6.07% |  |
| B | 6755 | 4903 | 214 | 214 | 3.17% | 4.36% | 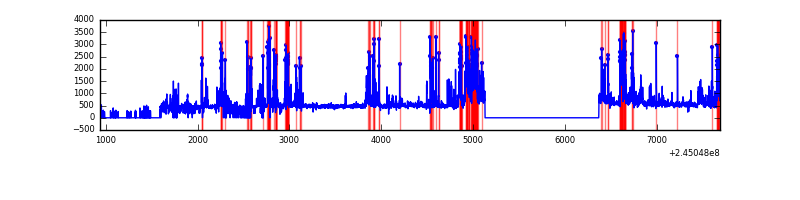 |
| C | 6755 | 4957 | 0 | 0 | 0.00% | 0.00% | 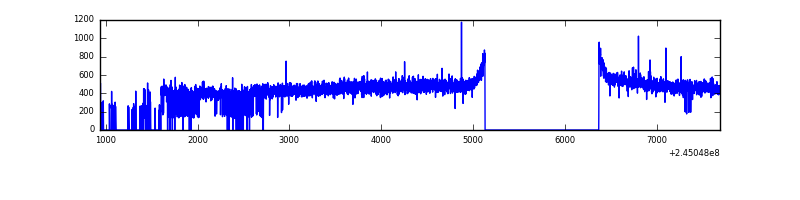 |
| D | 6755 | 4893 | 98 | 98 | 1.45% | 2.00% | 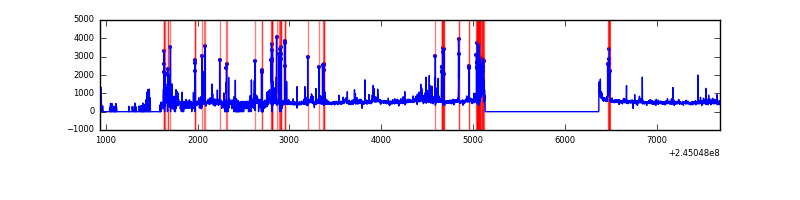 |
Top three noisy pixels from each quadrant. If the there are fewer than three noisy pixels in the level2.evt file, extra rows are filled as -1
| Pixel properties | Quadrant properties | ||||||
|---|---|---|---|---|---|---|---|
| Quadrant | DetID | PixID | Counts | Sigma | Mean | Median | Sigma |
| A | 8 | 5 | 1541575 | 13457.65 | 567 | 558 | 114.5 |
| A | 8 | 15 | 178390 | 1553.0 | 567 | 558 | 114.5 |
| A | 11 | 29 | 13529 | 113.28 | 567 | 558 | 114.5 |
| B | 4 | 239 | 918620 | 8589.41 | 564 | 552 | 106.9 |
| B | 4 | 173 | 174475 | 1627.22 | 564 | 552 | 106.9 |
| B | 0 | 214 | 20689 | 188.4 | 564 | 552 | 106.9 |
| C | 13 | 61 | 4172 | 27.93 | 565 | 568 | 129.0 |
| C | 14 | 128 | 3479 | 22.56 | 565 | 568 | 129.0 |
| C | 12 | 4 | 2157 | 12.31 | 565 | 568 | 129.0 |
| D | 1 | 52 | 296298 | 2237.03 | 552 | 537 | 132.2 |
| D | 10 | 253 | 167855 | 1265.53 | 552 | 537 | 132.2 |
| D | 8 | 195 | 128117 | 964.97 | 552 | 537 | 132.2 |
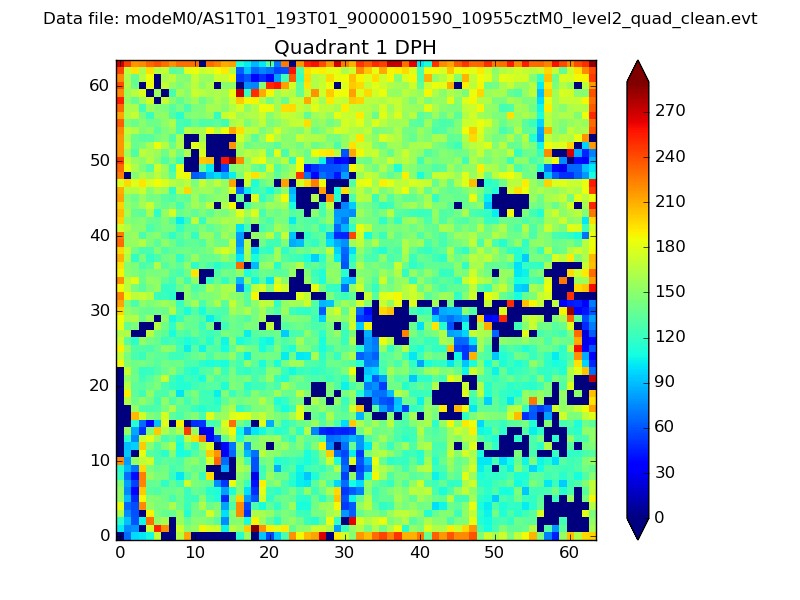
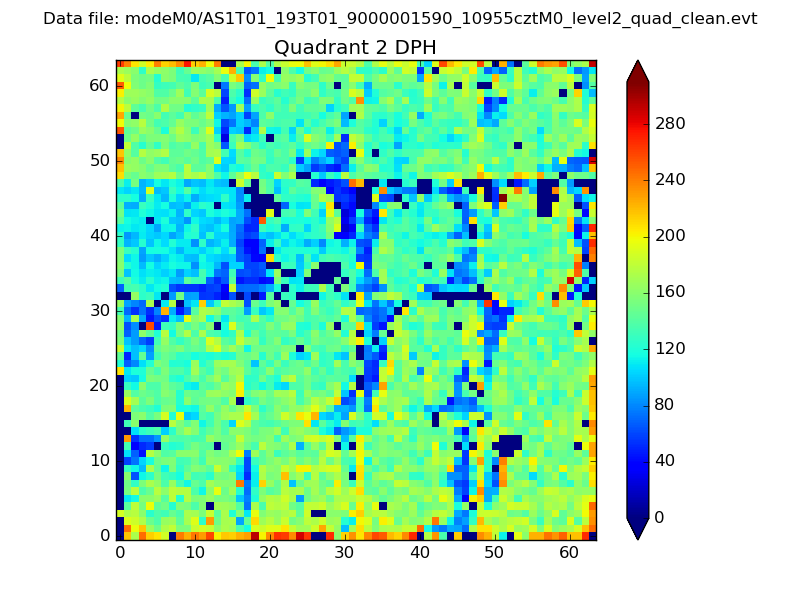
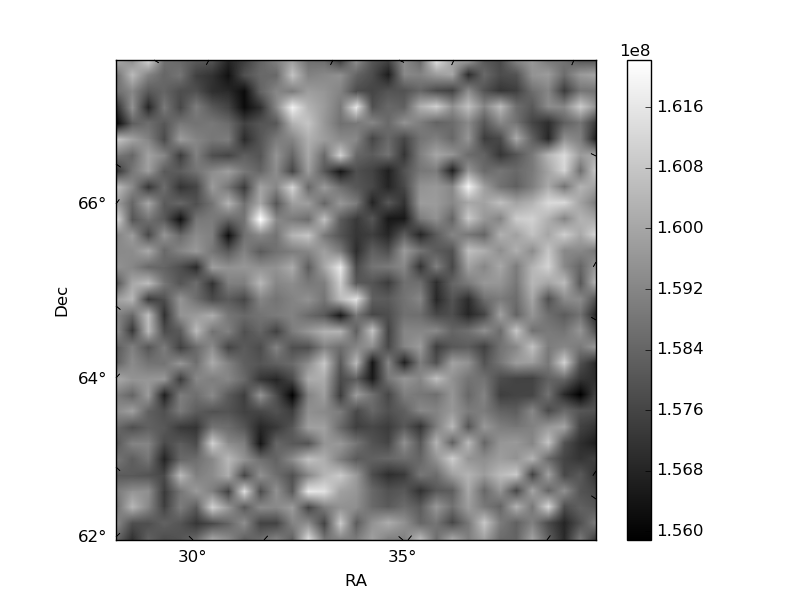
Histogram calculated using DETX and DETY for each event in the final _common_clean file
| Quadrant A | 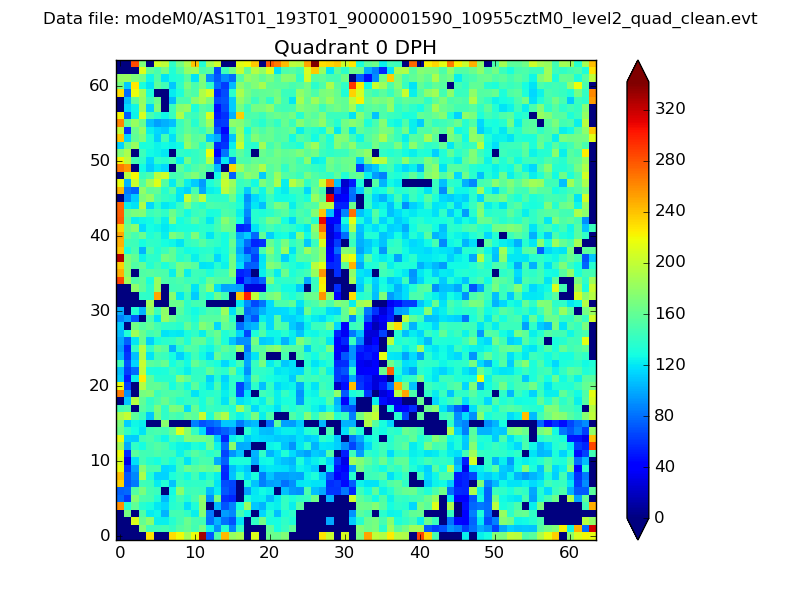 |
 |
Quadrant B |
|---|---|---|---|
| Quadrant D | 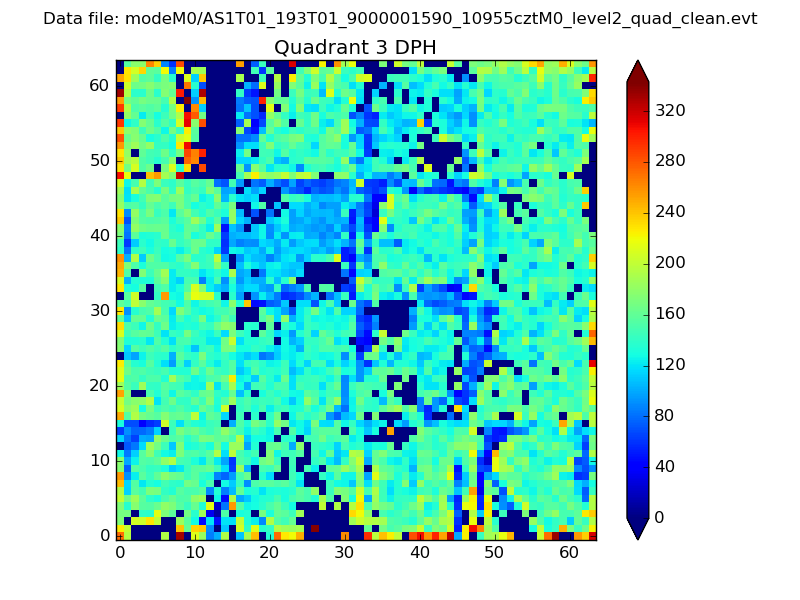 |
 |
Quadrant C |
| Plot type | Count rate plots | Images |
|---|---|---|
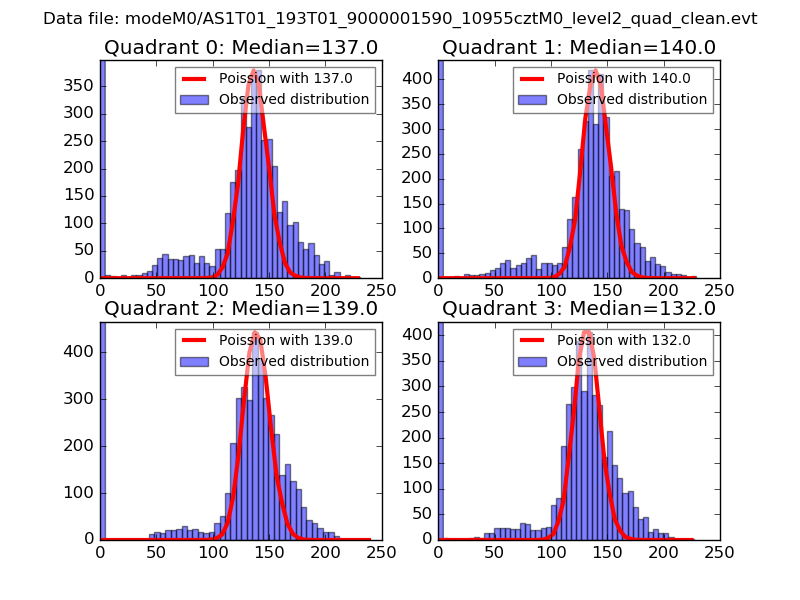
| Comparison with Poisson distribution Blue bars denote a histogram of data divided into 1 sec bins. Red curve is a Poisson curve with rate = median count rate of data. |
 |
 |
| Quadrant-wise count rates Data is divided into 100 sec bins |
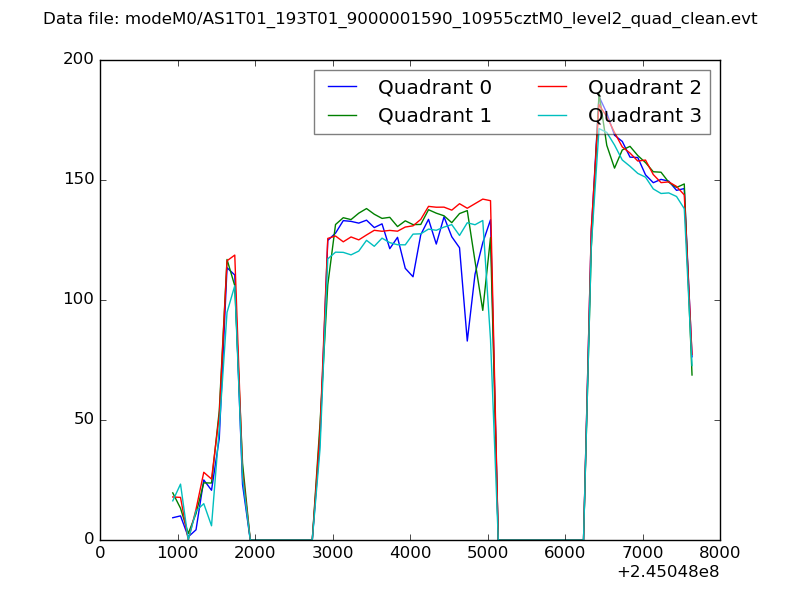 |
|
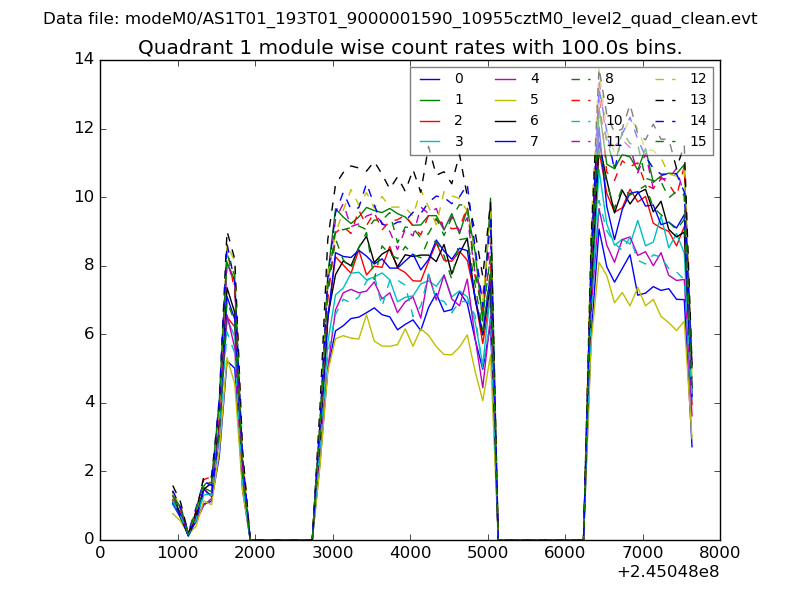
| Module-wise count rates for Quadrant A Data is divided into 100 sec bins |
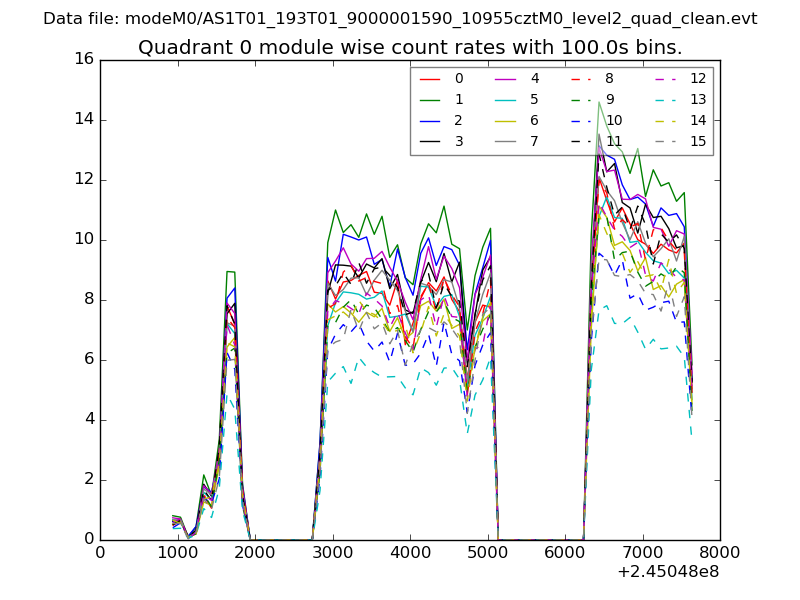 |
 |
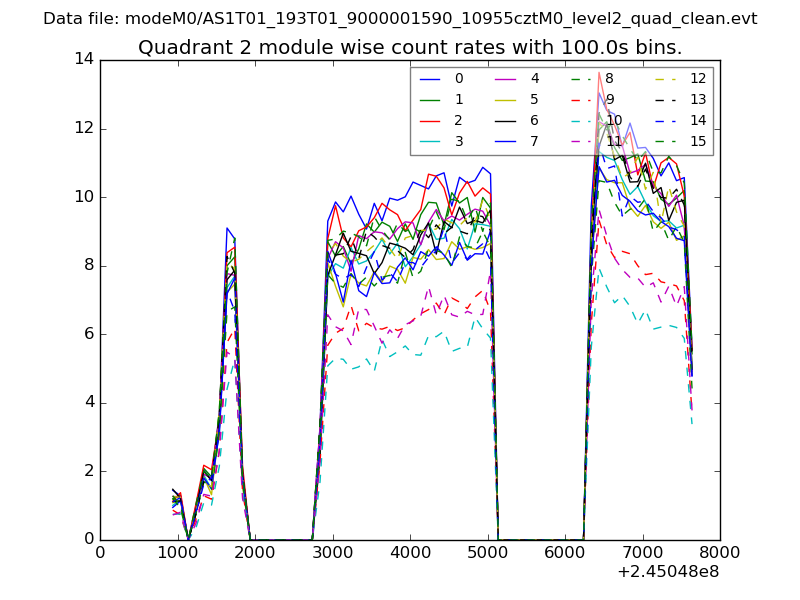
| Module-wise count rates for Quadrant B Data is divided into 100 sec bins |
 |
 |
| Module-wise count rates for Quadrant C Data is divided into 100 sec bins |
 |
 |
| Module-wise count rates for Quadrant D Data is divided into 100 sec bins |
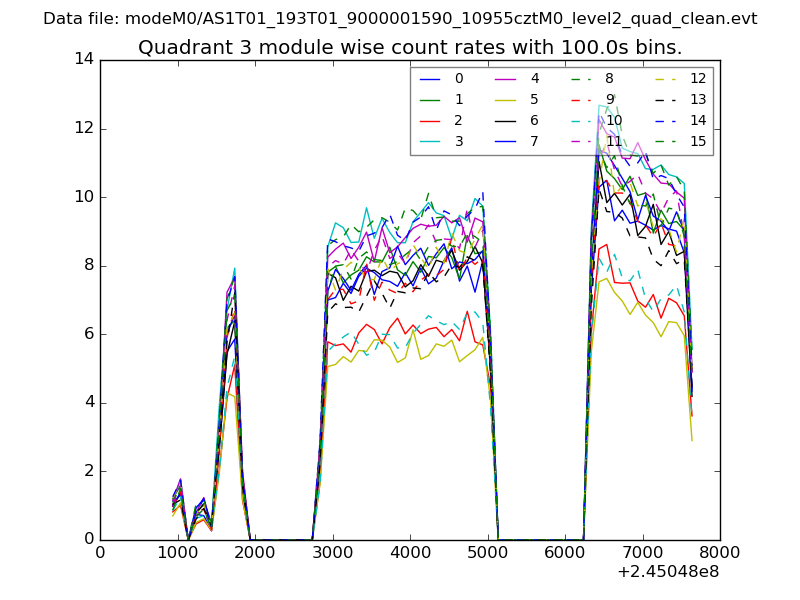 |
 |
| Parameter | Plot |
|---|---|
| CZT HV Monitor | 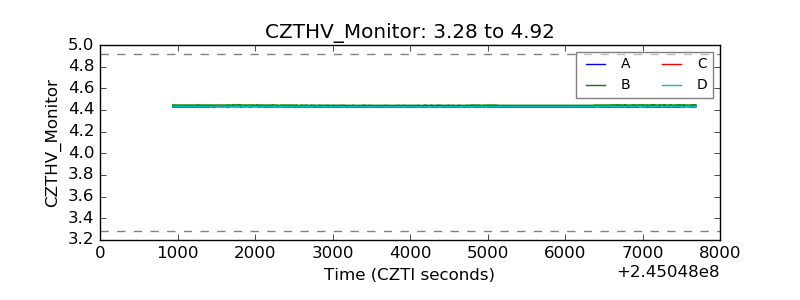 |
| D_VDD | 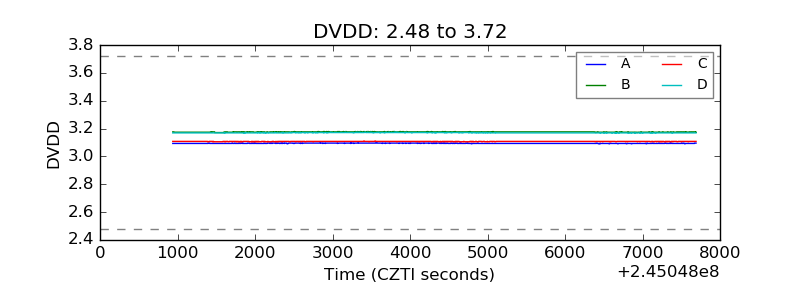 |
| Temperature 1 | 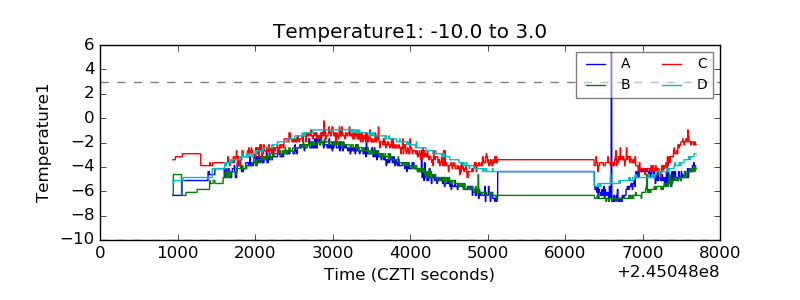 |
| Veto HV Monitor |  |
| Veto LLD | 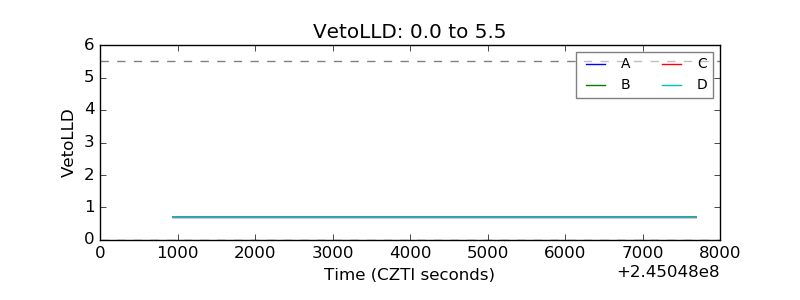 |
| Alpha Counter | 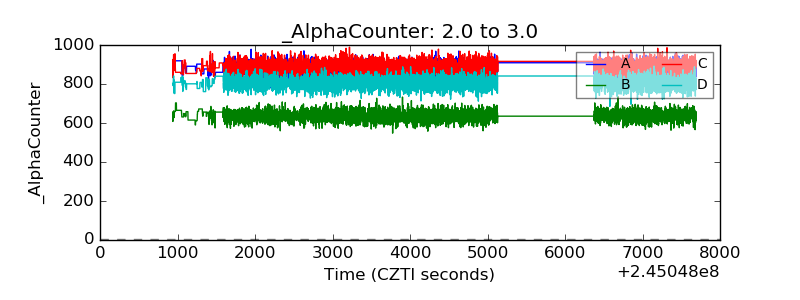 |
| _CPM_Rate | 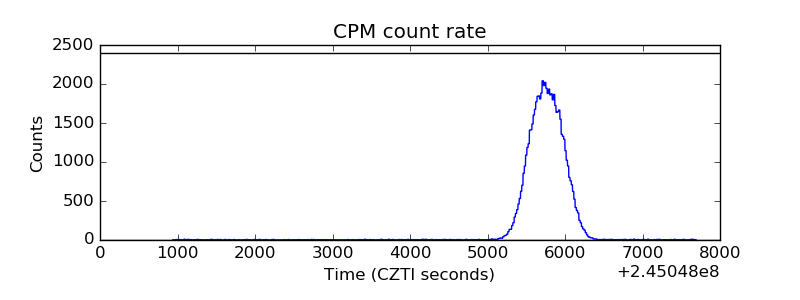 |
| CZT Counter | 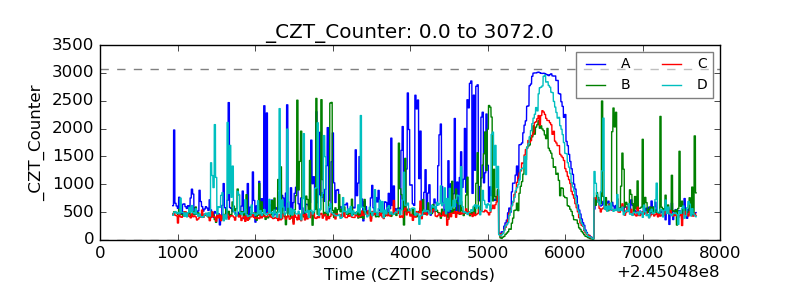 |
| +2.5 Volts monitor |  |
| +5 Volts monitor |  |
| _ROLL_ROT | 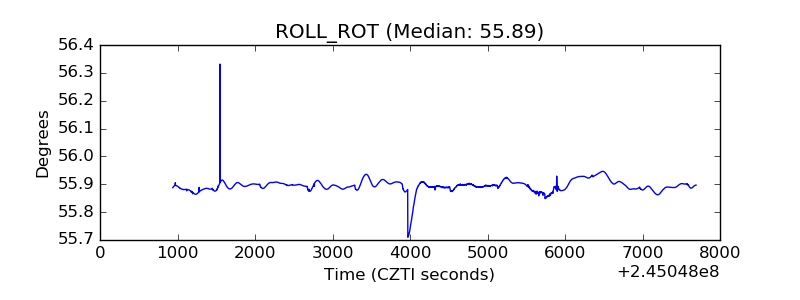 |
| _Roll_DEC | 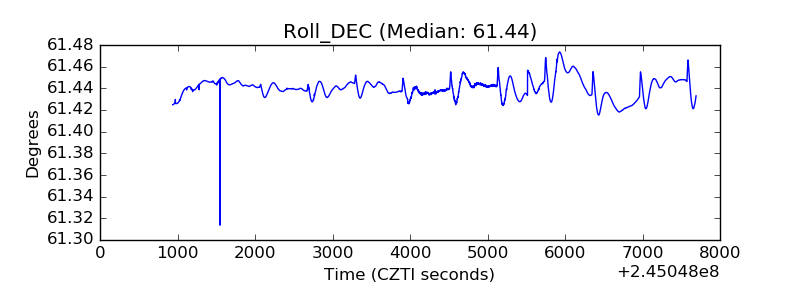 |
| _Roll_RA | 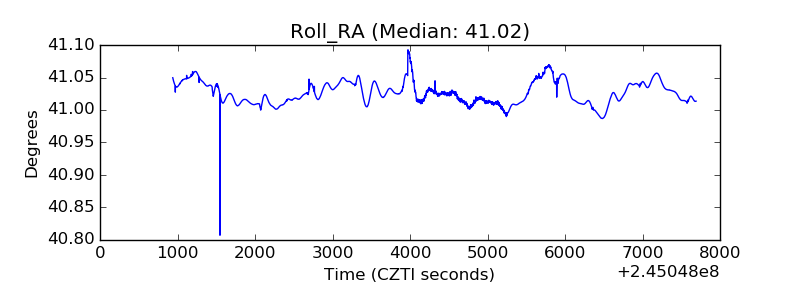 |
| Veto Counter | 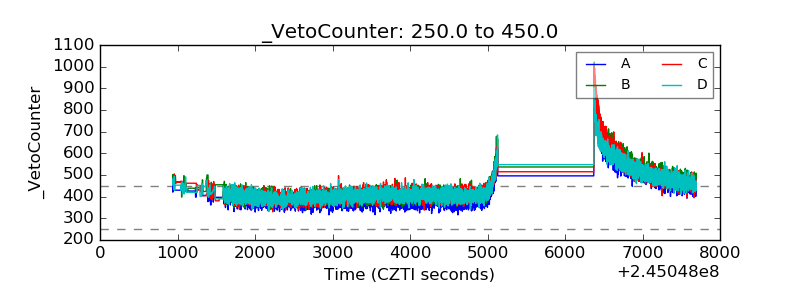 |