| Param | Original file | Final file |
|---|---|---|
| Filename | modeM0/AS1T01_193T01_9000001590_10956cztM0_level2.evt | modeM0/AS1T01_193T01_9000001590_10956cztM0_level2_quad_clean.evt |
| Size (bytes) | 921,404,160 | 171,809,280 |
| Size | 878.7 MB | 163.9 MB |
| Events in quadrant A | 8,145,784 | 1,112,726 |
| Events in quadrant B | 7,222,002 | 1,139,241 |
| Events in quadrant C | 4,888,231 | 1,146,449 |
| Events in quadrant D | 6,938,431 | 1,076,733 |
| Mode SS | |||
|---|---|---|---|
| Quadrant | BADHDUFLAG | Total packets | Discarded packets |
| A | 0 | 216 | 0 |
| B | 0 | 216 | 0 |
| C | 0 | 216 | 0 |
| D | 0 | 216 | 0 |
| Mode M0 | |||
|---|---|---|---|
| Quadrant | BADHDUFLAG | Total packets | Discarded packets |
| A | 0 | 30981 | 3 |
| B | 0 | 28094 | 8 |
| C | 0 | 21410 | 2 |
| D | 0 | 27136 | 2 |
| Mode M9 | |||
|---|---|---|---|
| Quadrant | BADHDUFLAG | Total packets | Discarded packets |
| A | 0 | 25 | 0 |
| B | 0 | 25 | 0 |
| C | 0 | 25 | 0 |
| D | 0 | 25 | 0 |
| Quadrant | Total seconds | Saturated seconds | Saturation percentage |
|---|---|---|---|
| A | 10509 | 798 | 7.593491% |
| B | 10508 | 704 | 6.699657% |
| C | 10509 | 48 | 0.456751% |
| D | 10509 | 504 | 4.795889% |
Noise dominated data is calculated using 1-second bins in cleaned event files. If a bin has >2000 counts, and if more than 50% of those come from <1% of pixels, then it is considered to be noise-dominated and hence unusable.
| Quadrant | # 1 sec bins | Bins with >0 counts | Bins with >2000 counts | High rate bins dominated by noise | Noise dominated (total time) | Noise dominated (detector-on time) | Marked lightcurve |
|---|---|---|---|---|---|---|---|
| A | 13064 | 10510 | 514 | 514 | 3.93% | 4.89% | 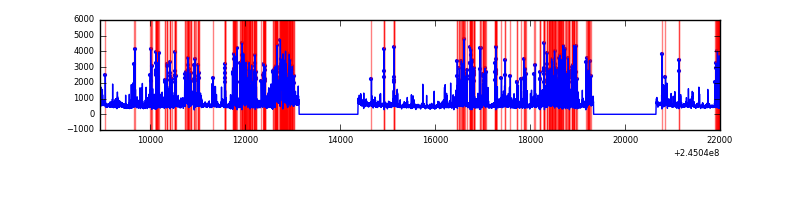 |
| B | 13064 | 10511 | 405 | 405 | 3.10% | 3.85% | 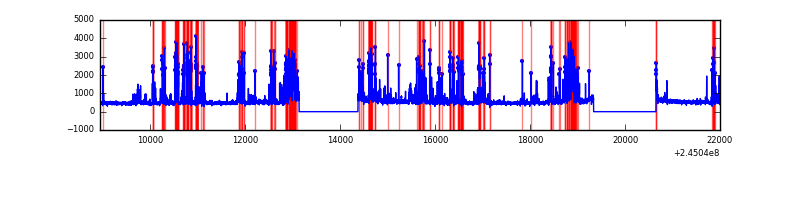 |
| C | 13064 | 10511 | 0 | 0 | 0.00% | 0.00% | 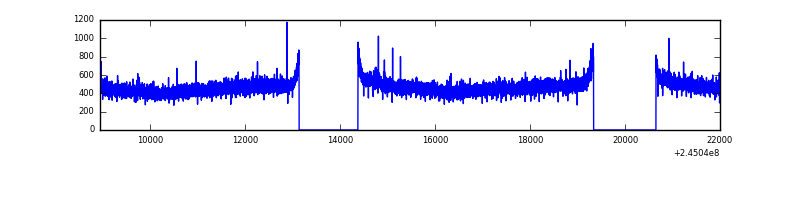 |
| D | 13064 | 10511 | 299 | 299 | 2.29% | 2.84% | 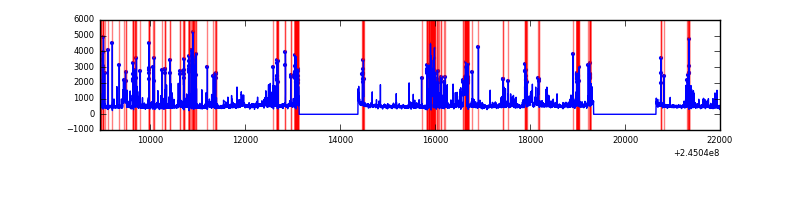 |
Top three noisy pixels from each quadrant. If the there are fewer than three noisy pixels in the level2.evt file, extra rows are filled as -1
| Pixel properties | Quadrant properties | ||||||
|---|---|---|---|---|---|---|---|
| Quadrant | DetID | PixID | Counts | Sigma | Mean | Median | Sigma |
| A | 8 | 5 | 2892810 | 11360.92 | 1276 | 1253 | 254.5 |
| A | 8 | 15 | 290610 | 1136.88 | 1276 | 1253 | 254.5 |
| A | 11 | 29 | 26038 | 97.38 | 1276 | 1253 | 254.5 |
| B | 4 | 239 | 1951573 | 8256.73 | 1272 | 1245 | 236.2 |
| B | 4 | 173 | 193502 | 813.92 | 1272 | 1245 | 236.2 |
| B | 0 | 214 | 56357 | 233.32 | 1272 | 1245 | 236.2 |
| C | 13 | 61 | 9306 | 28.37 | 1251 | 1260 | 283.6 |
| C | 8 | 222 | 4686 | 12.08 | 1251 | 1260 | 283.6 |
| C | 14 | 128 | 4542 | 11.57 | 1251 | 1260 | 283.6 |
| D | 1 | 52 | 524013 | 1799.28 | 1226 | 1195 | 290.6 |
| D | 10 | 253 | 516806 | 1774.48 | 1226 | 1195 | 290.6 |
| D | 8 | 195 | 302679 | 1037.56 | 1226 | 1195 | 290.6 |
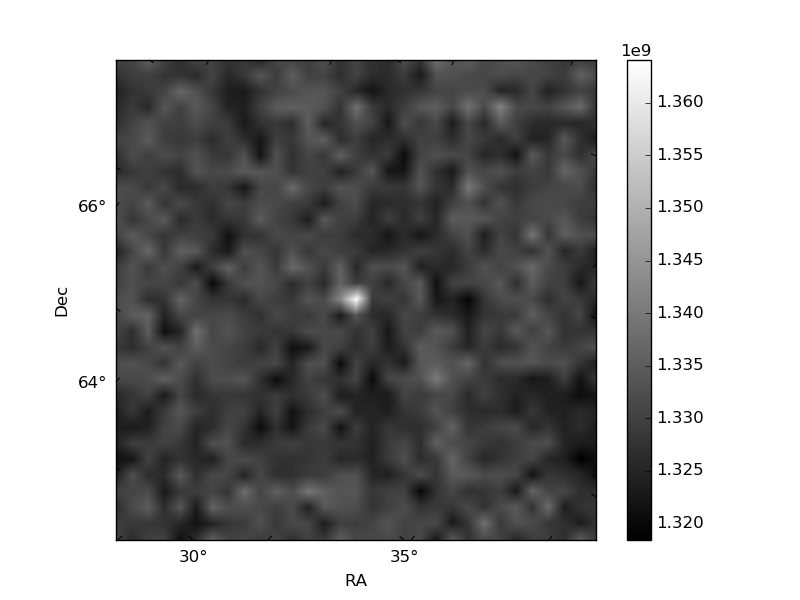
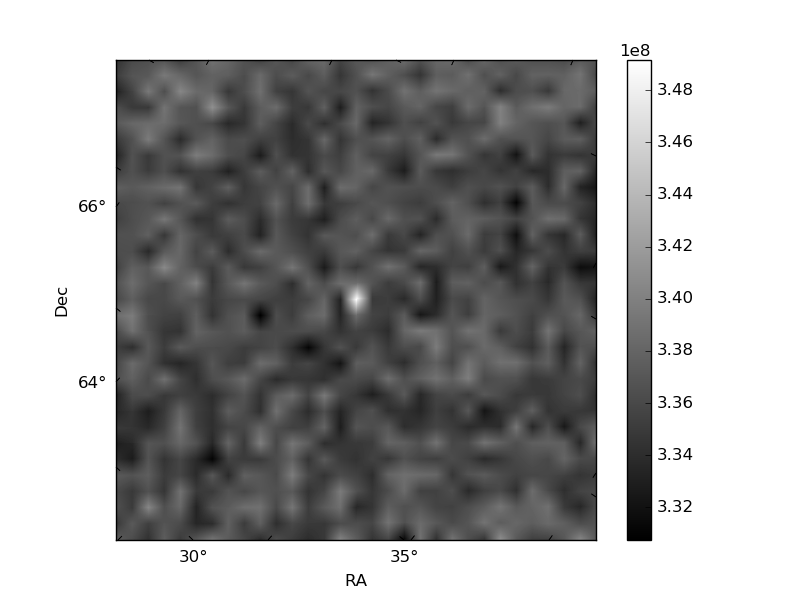
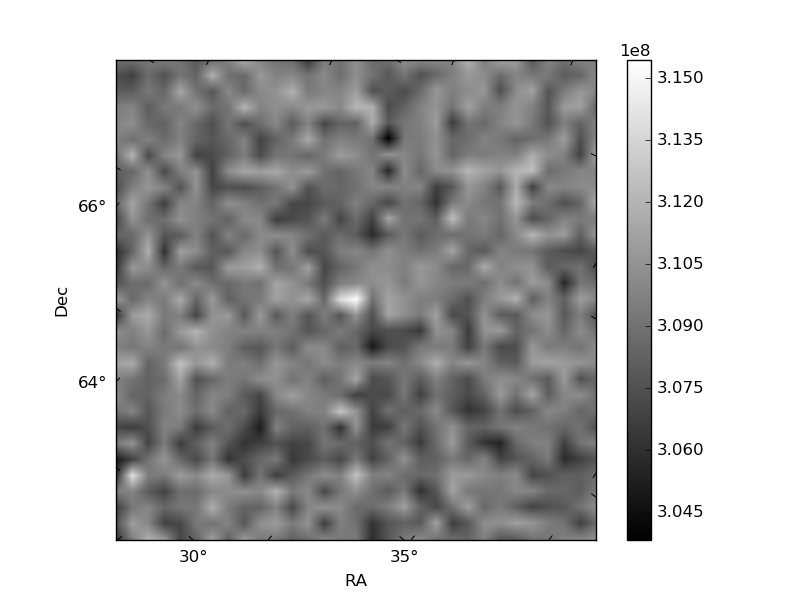
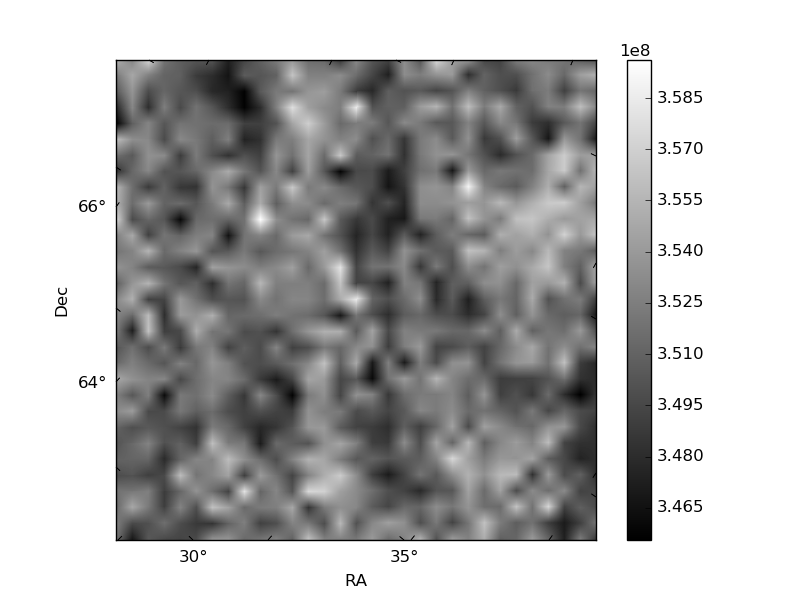
Histogram calculated using DETX and DETY for each event in the final _common_clean file
| Quadrant A | 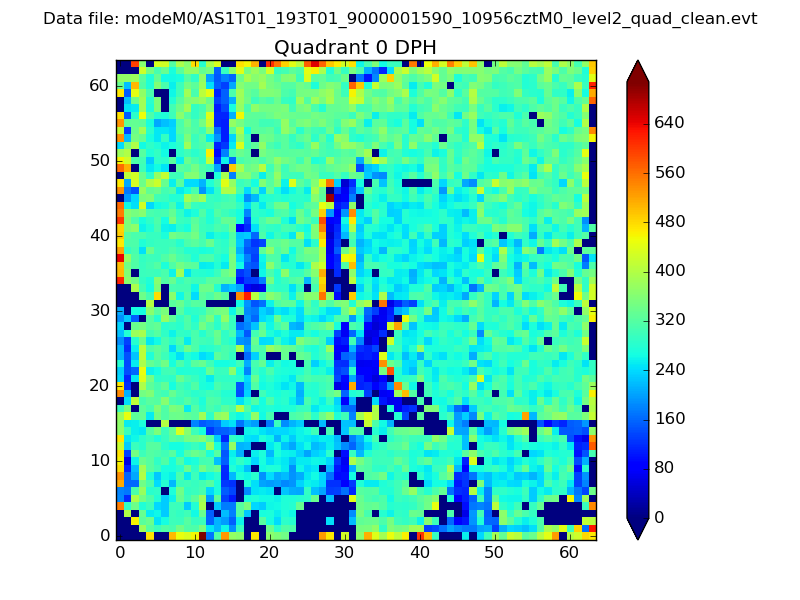 |
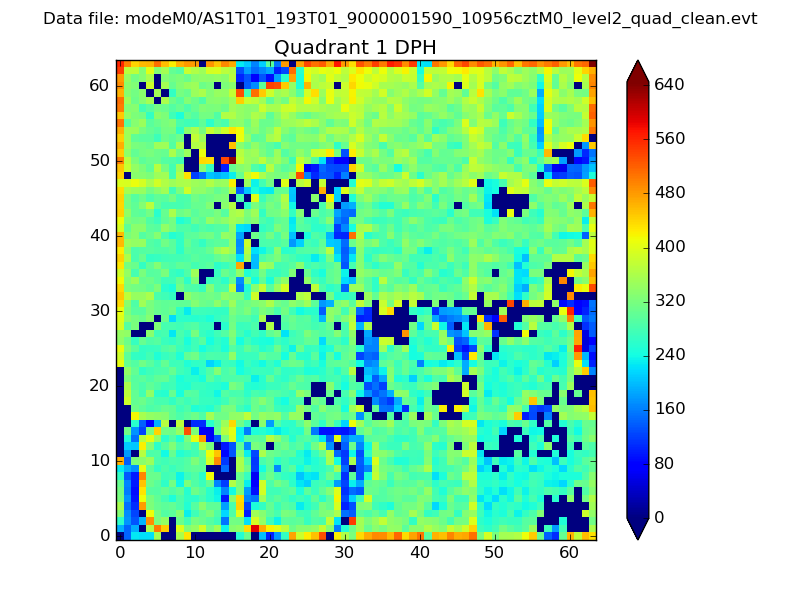 |
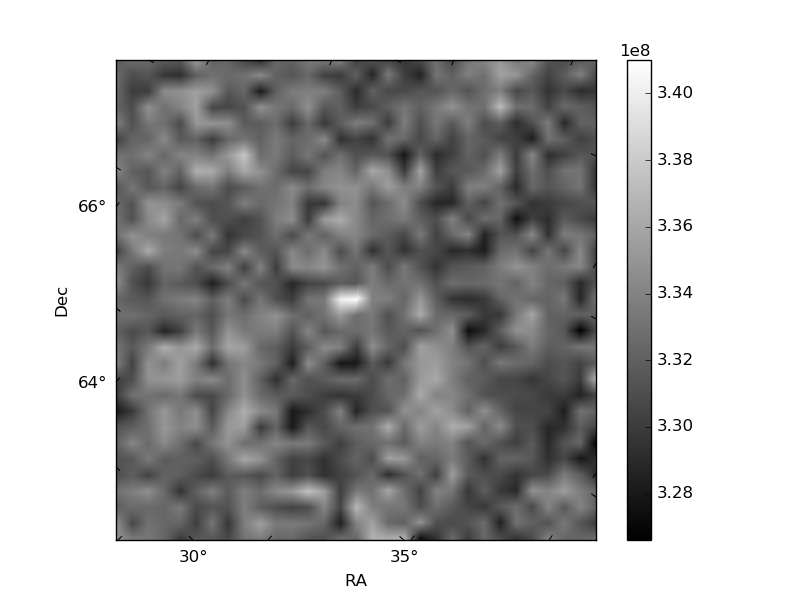
Quadrant B |
|---|---|---|---|
| Quadrant D | 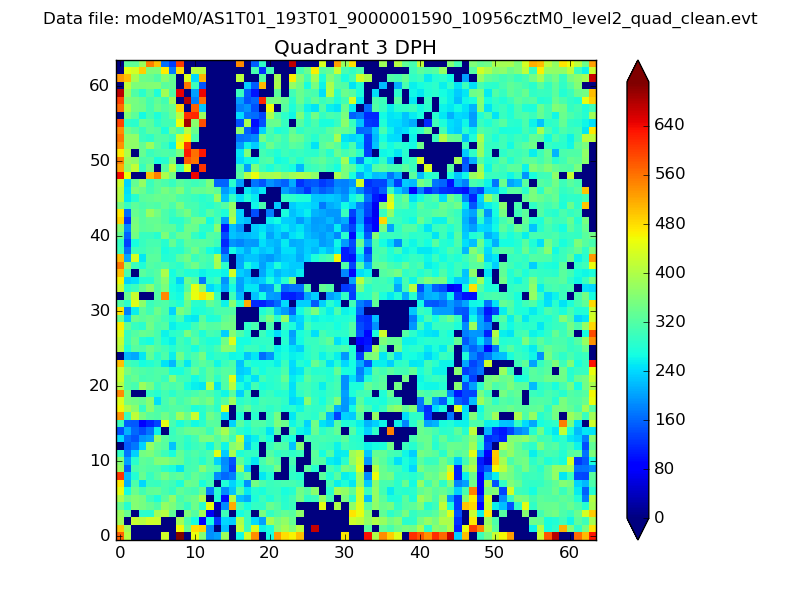 |
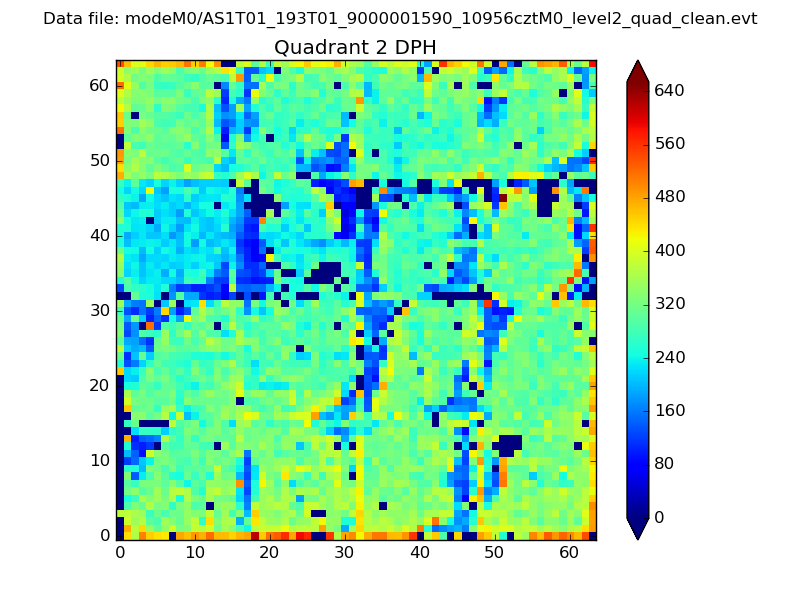 |
Quadrant C |
| Plot type | Count rate plots | Images |
|---|---|---|
| Comparison with Poisson distribution Blue bars denote a histogram of data divided into 1 sec bins. Red curve is a Poisson curve with rate = median count rate of data. |
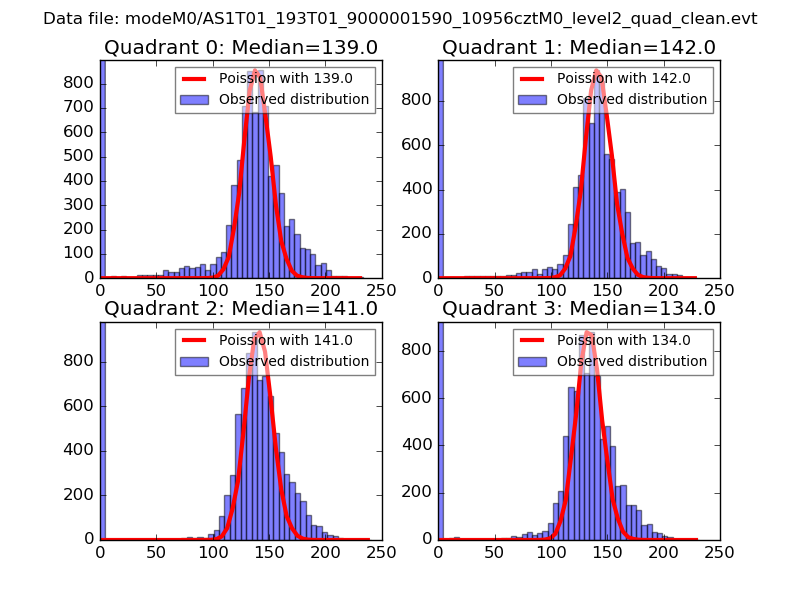 |
 |
| Quadrant-wise count rates Data is divided into 100 sec bins |
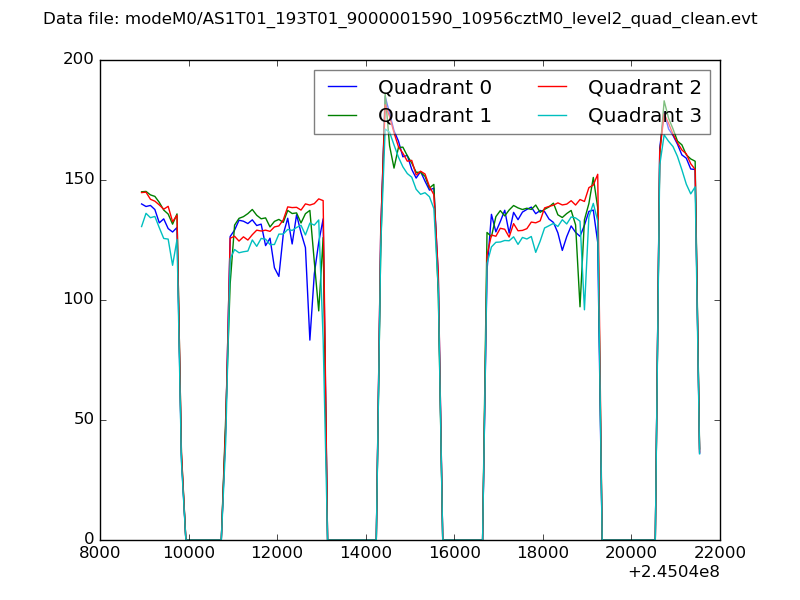 |
|
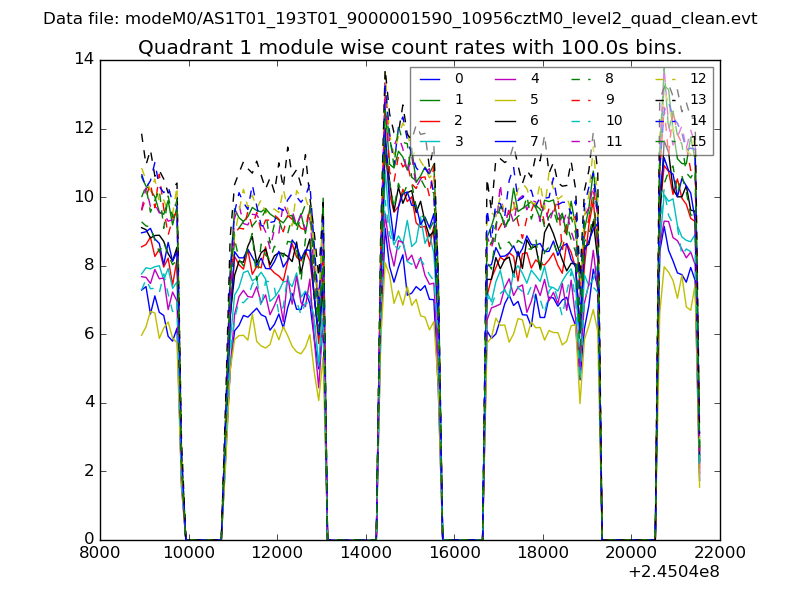
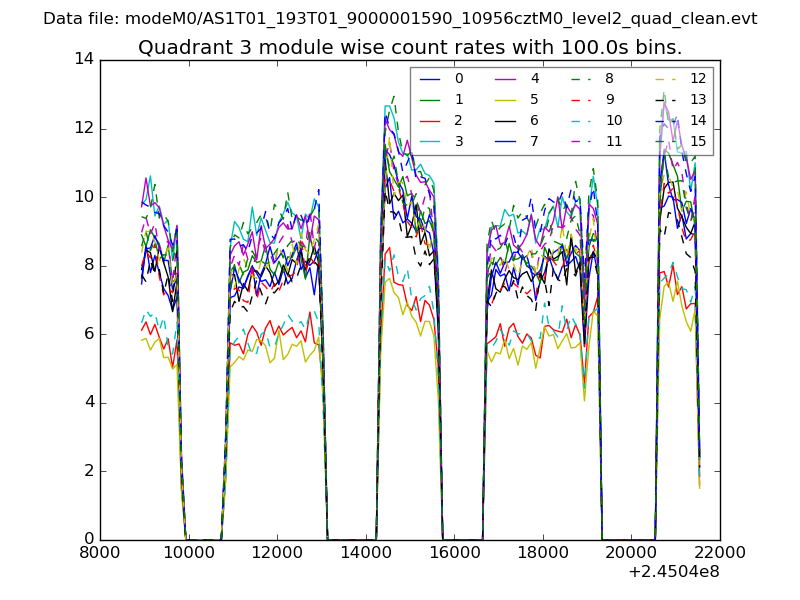
| Module-wise count rates for Quadrant A Data is divided into 100 sec bins |
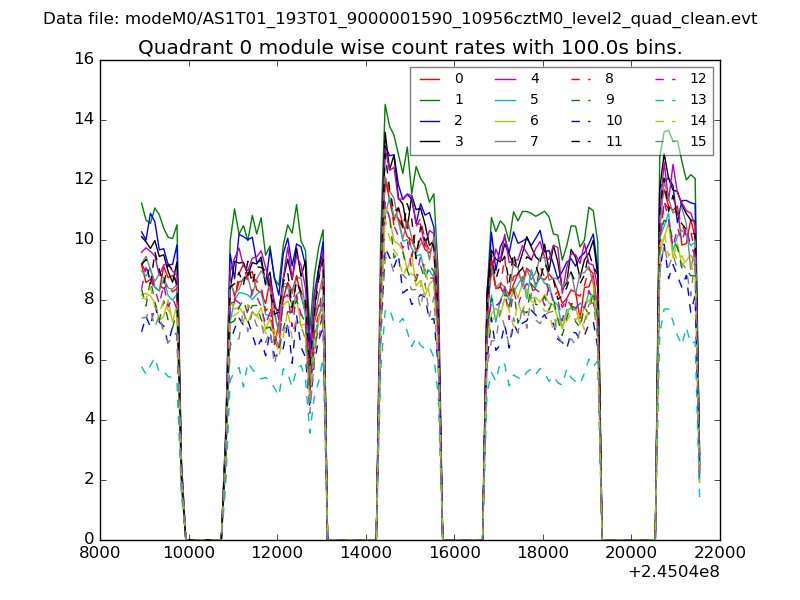 |
 |
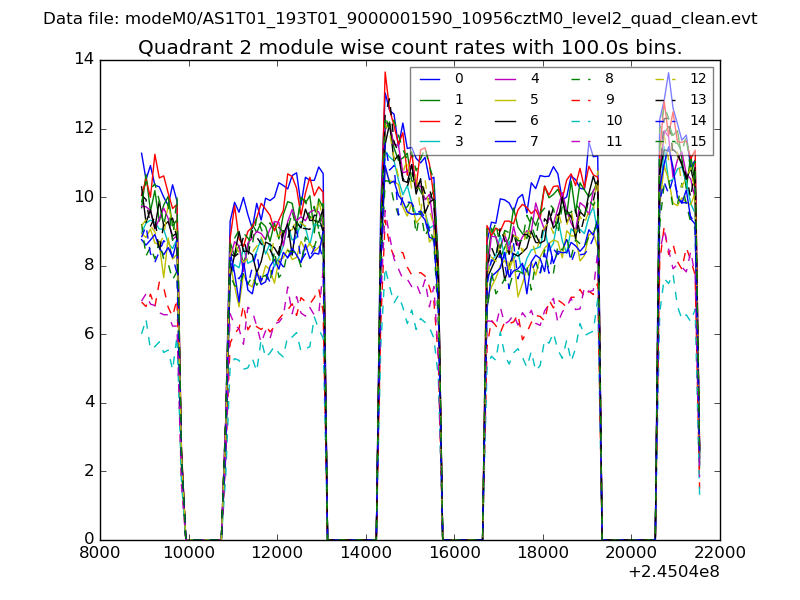
| Module-wise count rates for Quadrant B Data is divided into 100 sec bins |
 |
 |
| Module-wise count rates for Quadrant C Data is divided into 100 sec bins |
 |
 |
| Module-wise count rates for Quadrant D Data is divided into 100 sec bins |
 |
 |
| Parameter | Plot |
|---|---|
| CZT HV Monitor | 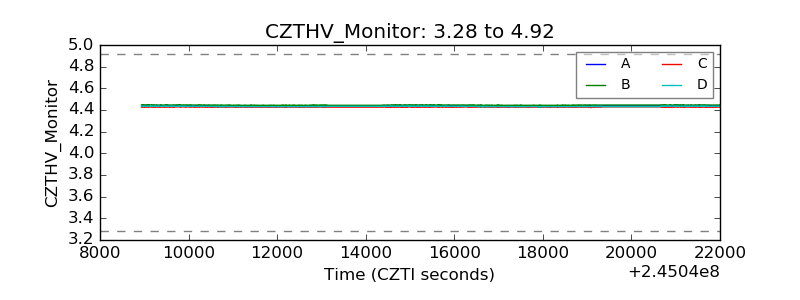 |
| D_VDD | 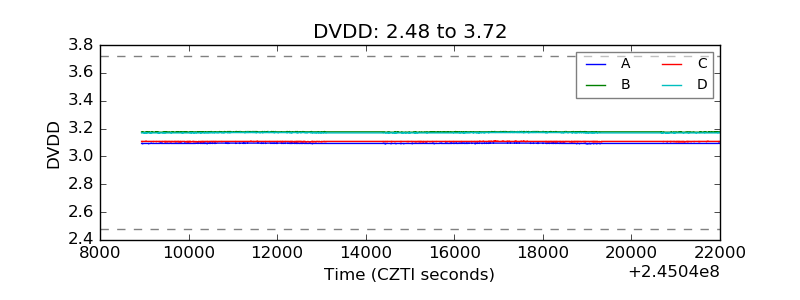 |
| Temperature 1 | 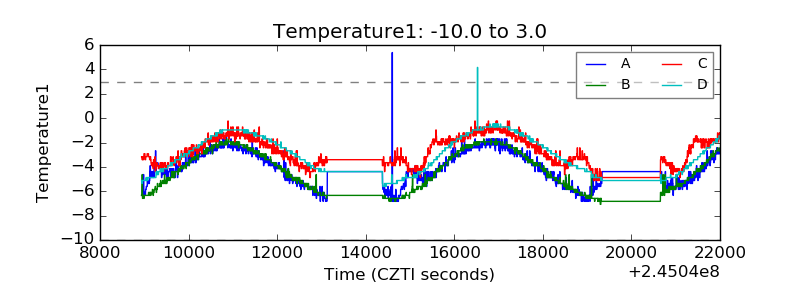 |
| Veto HV Monitor | 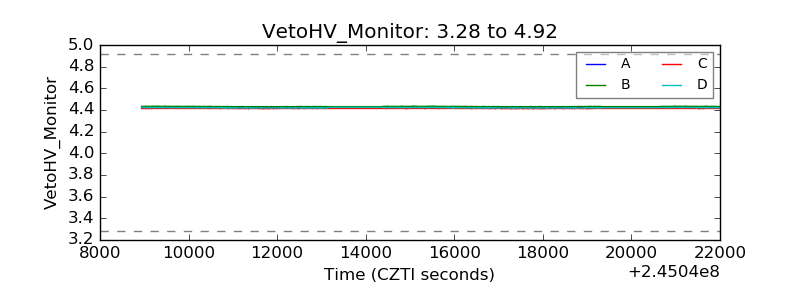 |
| Veto LLD | 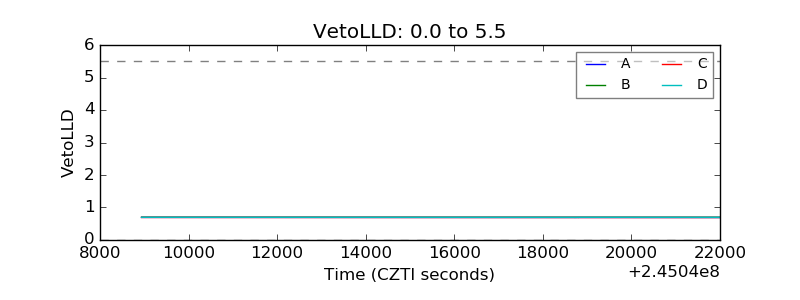 |
| Alpha Counter | 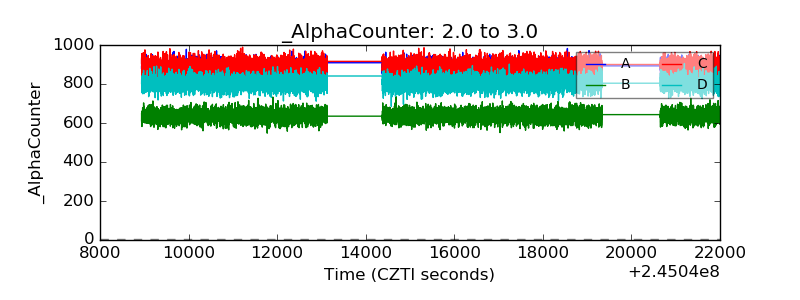 |
| _CPM_Rate | 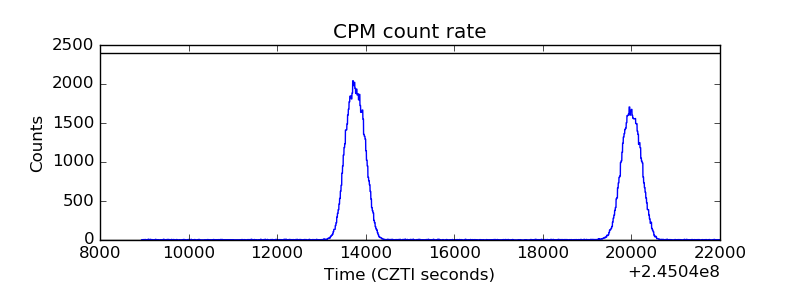 |
| CZT Counter | 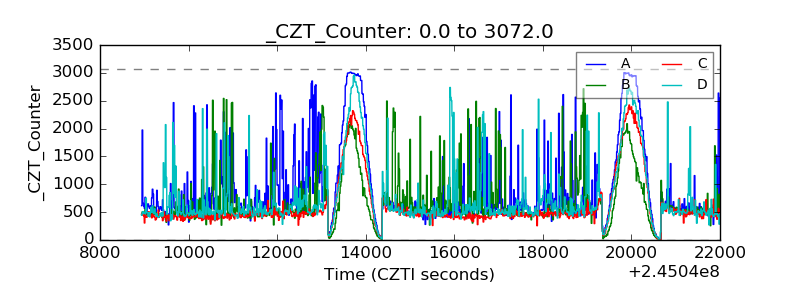 |
| +2.5 Volts monitor | 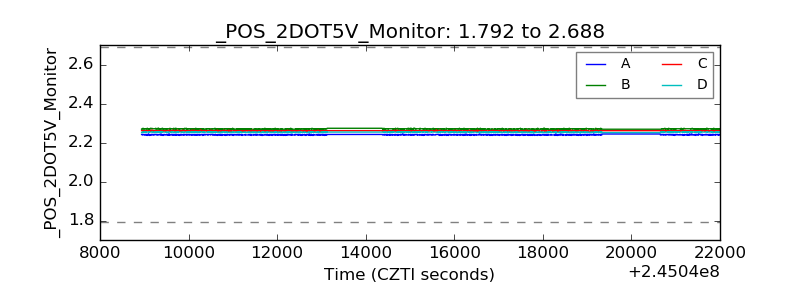 |
| +5 Volts monitor | 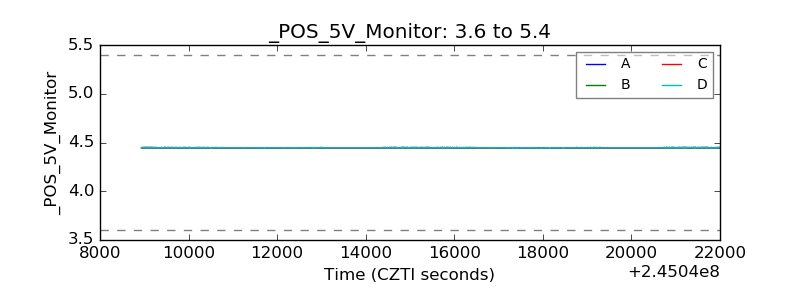 |
| _ROLL_ROT | 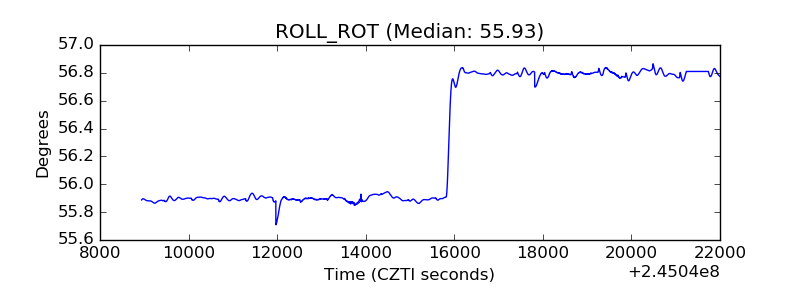 |
| _Roll_DEC | 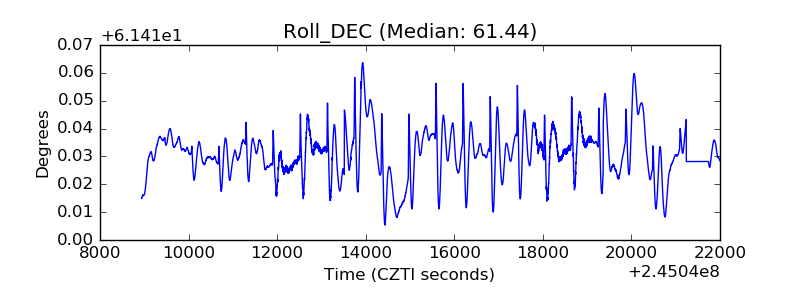 |
| _Roll_RA | 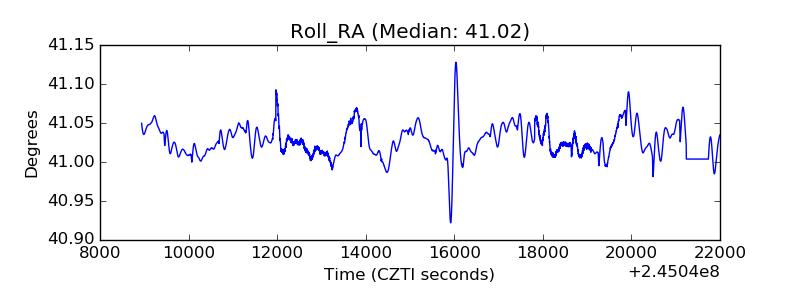 |
| Veto Counter | 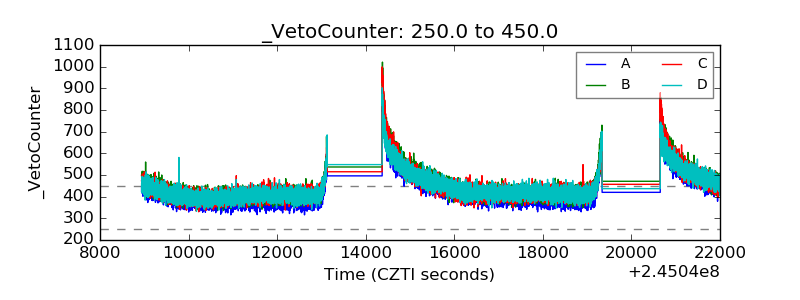 |