| Param | Original file | Final file |
|---|---|---|
| Filename | modeM0/AS1T01_193T01_9000001590_10957cztM0_level2.evt | modeM0/AS1T01_193T01_9000001590_10957cztM0_level2_quad_clean.evt |
| Size (bytes) | 547,623,360 | 99,167,040 |
| Size | 522.3 MB | 94.6 MB |
| Events in quadrant A | 4,546,196 | 640,082 |
| Events in quadrant B | 4,266,216 | 650,962 |
| Events in quadrant C | 3,100,611 | 653,379 |
| Events in quadrant D | 4,232,000 | 606,261 |
| Mode SS | |||
|---|---|---|---|
| Quadrant | BADHDUFLAG | Total packets | Discarded packets |
| A | 0 | 132 | 0 |
| B | 0 | 132 | 0 |
| C | 0 | 132 | 0 |
| D | 0 | 132 | 0 |
| Mode M0 | |||
|---|---|---|---|
| Quadrant | BADHDUFLAG | Total packets | Discarded packets |
| A | 0 | 17563 | 3 |
| B | 0 | 16657 | 2 |
| C | 0 | 13319 | 2 |
| D | 0 | 16547 | 2 |
| Mode M9 | |||
|---|---|---|---|
| Quadrant | BADHDUFLAG | Total packets | Discarded packets |
| A | 0 | 17 | 0 |
| B | 0 | 17 | 0 |
| C | 0 | 17 | 0 |
| D | 0 | 18 | 0 |
| Quadrant | Total seconds | Saturated seconds | Saturation percentage |
|---|---|---|---|
| A | 6485 | 350 | 5.397070% |
| B | 6485 | 371 | 5.720894% |
| C | 6485 | 49 | 0.755590% |
| D | 6485 | 341 | 5.258288% |
Noise dominated data is calculated using 1-second bins in cleaned event files. If a bin has >2000 counts, and if more than 50% of those come from <1% of pixels, then it is considered to be noise-dominated and hence unusable.
| Quadrant | # 1 sec bins | Bins with >0 counts | Bins with >2000 counts | High rate bins dominated by noise | Noise dominated (total time) | Noise dominated (detector-on time) | Marked lightcurve |
|---|---|---|---|---|---|---|---|
| A | 7775 | 6486 | 203 | 203 | 2.61% | 3.13% | 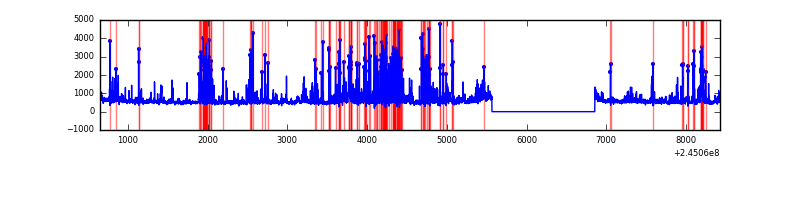 |
| B | 7775 | 6486 | 204 | 204 | 2.62% | 3.15% | 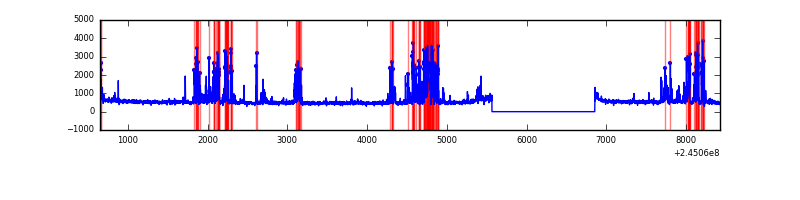 |
| C | 7775 | 6486 | 0 | 0 | 0.00% | 0.00% | 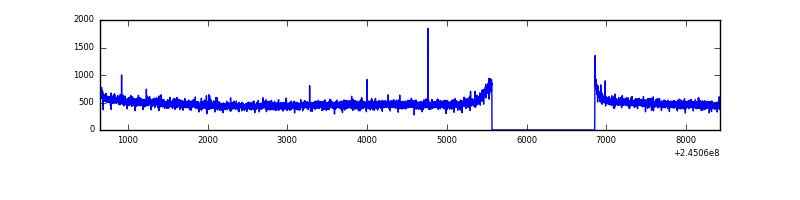 |
| D | 7775 | 6486 | 255 | 255 | 3.28% | 3.93% | 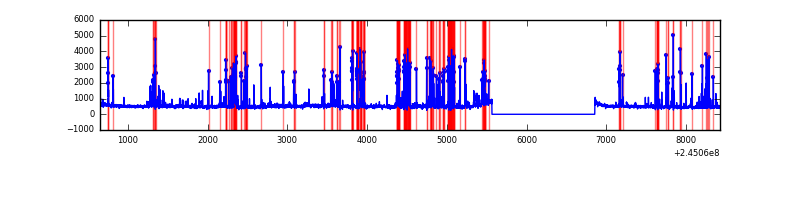 |
Top three noisy pixels from each quadrant. If the there are fewer than three noisy pixels in the level2.evt file, extra rows are filled as -1
| Pixel properties | Quadrant properties | ||||||
|---|---|---|---|---|---|---|---|
| Quadrant | DetID | PixID | Counts | Sigma | Mean | Median | Sigma |
| A | 8 | 5 | 1306434 | 7960.72 | 816 | 801 | 164.0 |
| A | 8 | 15 | 67768 | 408.31 | 816 | 801 | 164.0 |
| A | 4 | 2 | 12636 | 72.16 | 816 | 801 | 164.0 |
| B | 4 | 239 | 933733 | 6250.12 | 810 | 795 | 149.3 |
| B | 0 | 231 | 66247 | 438.49 | 810 | 795 | 149.3 |
| B | 0 | 214 | 39925 | 262.15 | 810 | 795 | 149.3 |
| C | 13 | 61 | 6013 | 28.85 | 793 | 797 | 180.8 |
| C | 5 | 207 | 3428 | 14.55 | 793 | 797 | 180.8 |
| C | 12 | 4 | 3162 | 13.08 | 793 | 797 | 180.8 |
| D | 10 | 253 | 741763 | 4044.34 | 780 | 762 | 183.2 |
| D | 5 | 97 | 94496 | 511.6 | 780 | 762 | 183.2 |
| D | 5 | 222 | 83812 | 453.28 | 780 | 762 | 183.2 |
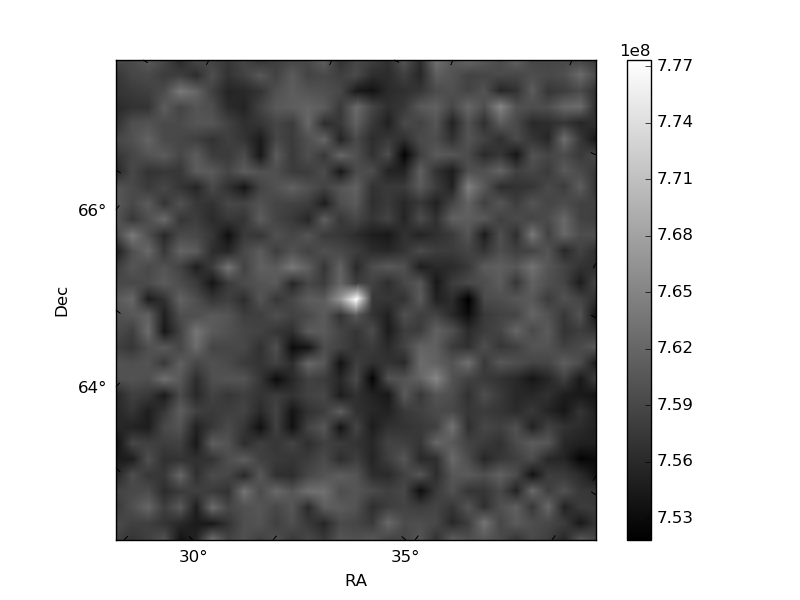
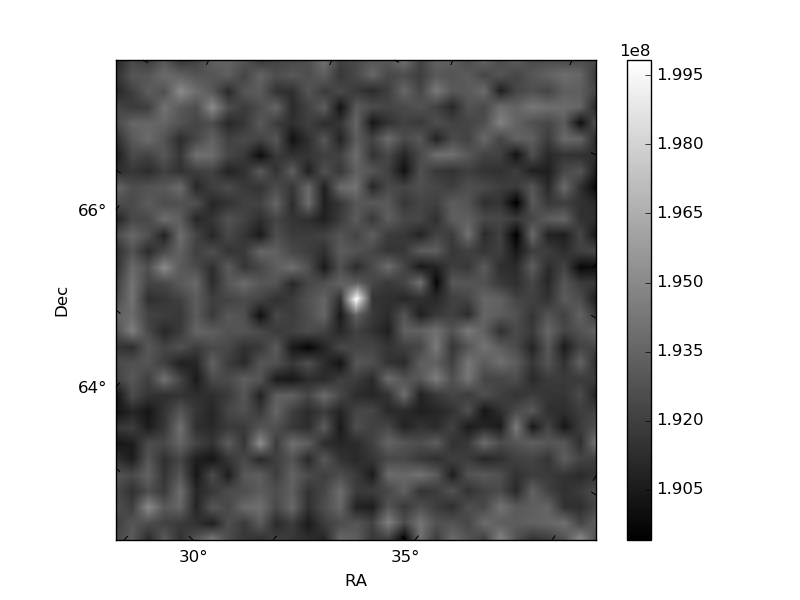
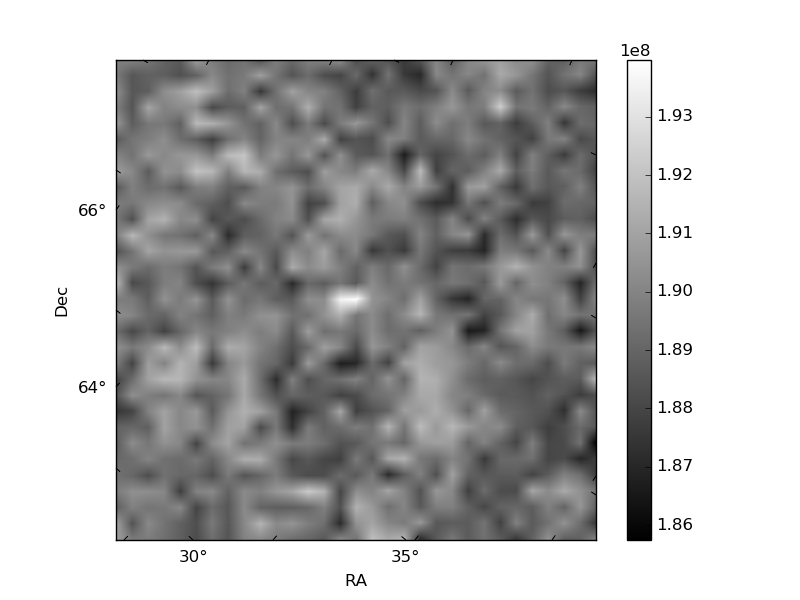
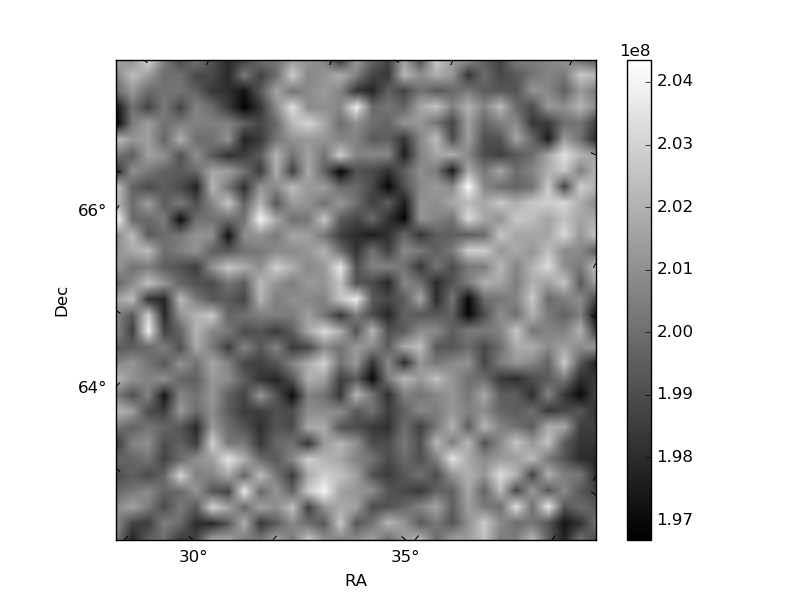
Histogram calculated using DETX and DETY for each event in the final _common_clean file
| Quadrant A | 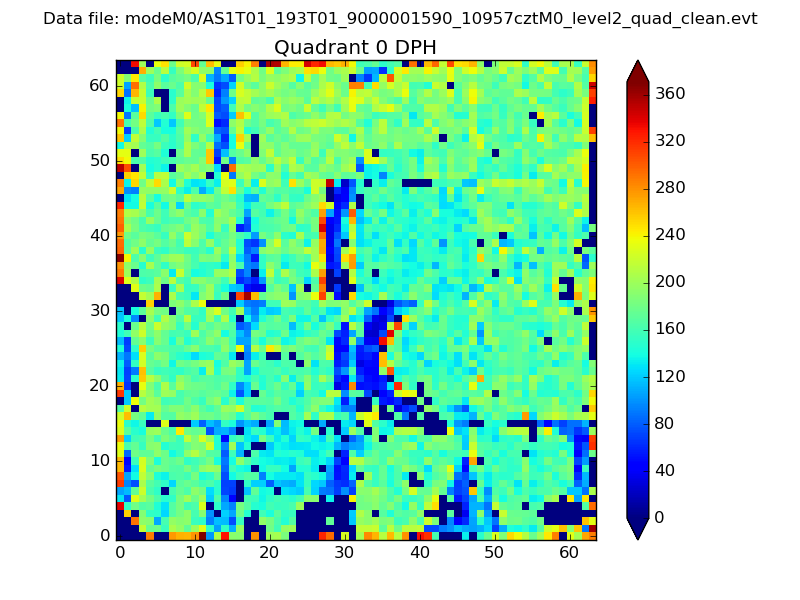 |
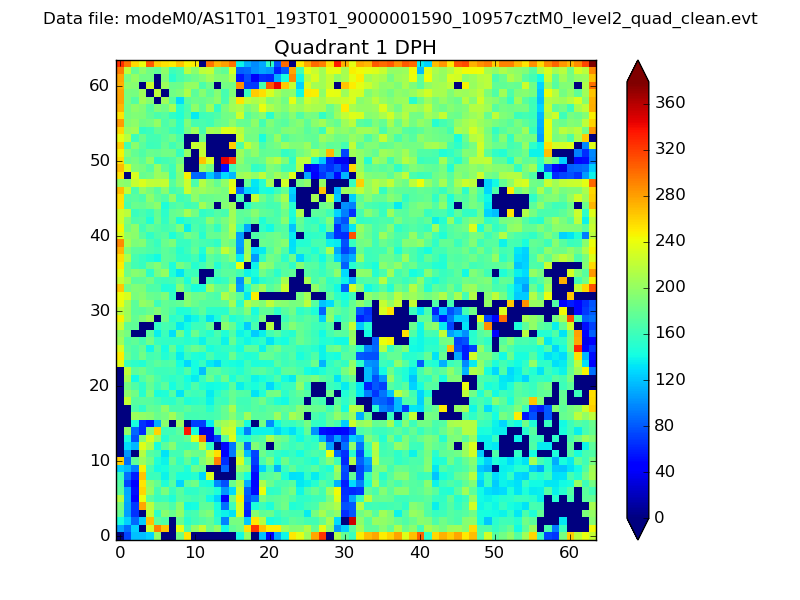 |
Quadrant B |
|---|---|---|---|
| Quadrant D | 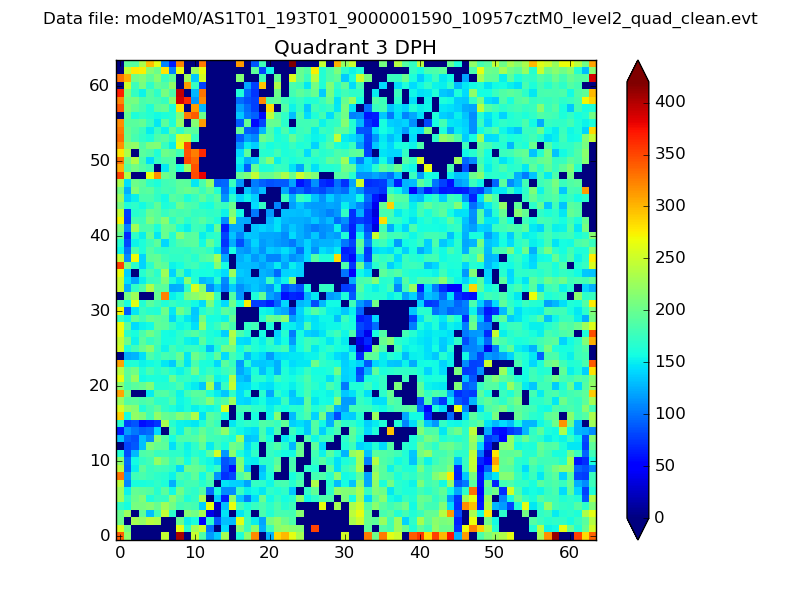 |
 |
Quadrant C |
| Plot type | Count rate plots | Images |
|---|---|---|
| Comparison with Poisson distribution Blue bars denote a histogram of data divided into 1 sec bins. Red curve is a Poisson curve with rate = median count rate of data. |
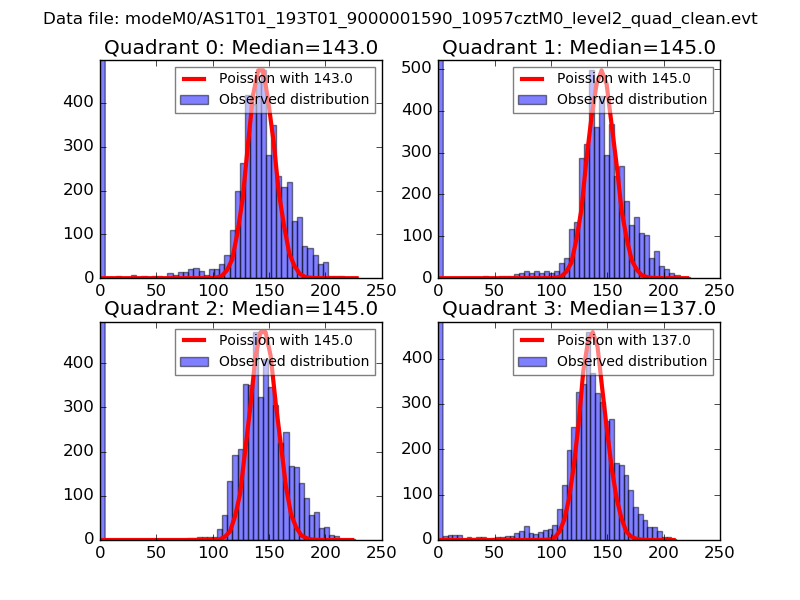 |
 |
| Quadrant-wise count rates Data is divided into 100 sec bins |
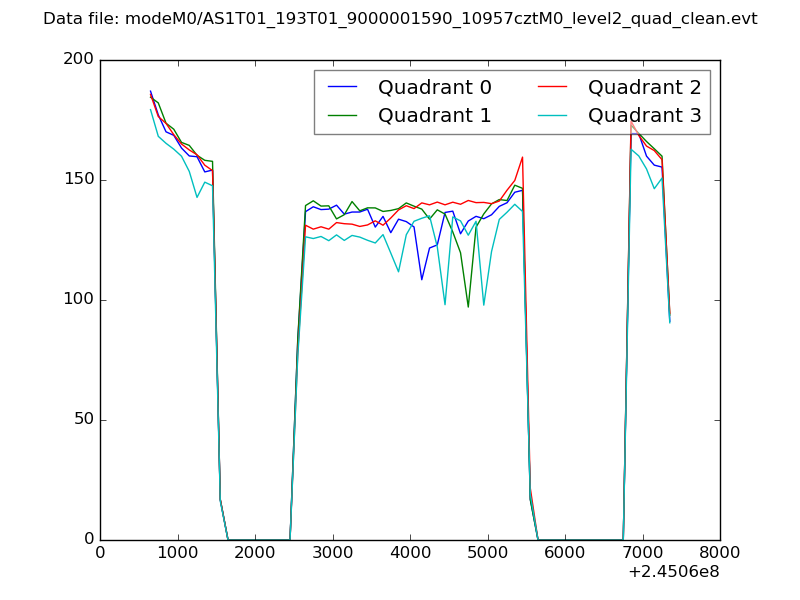 |
|
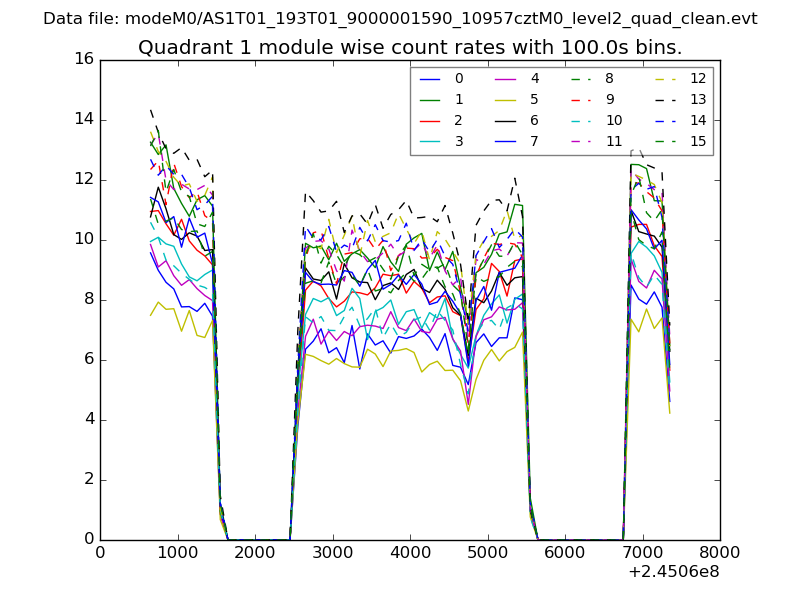
| Module-wise count rates for Quadrant A Data is divided into 100 sec bins |
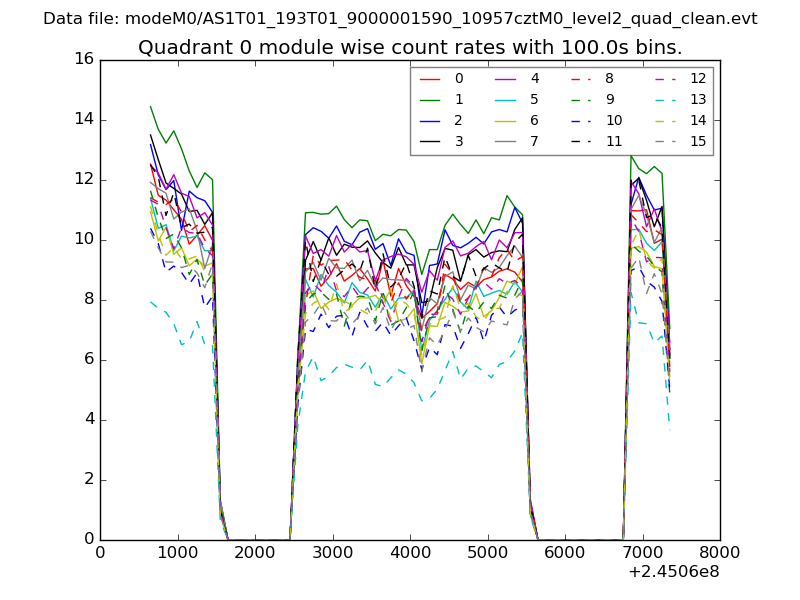 |
 |
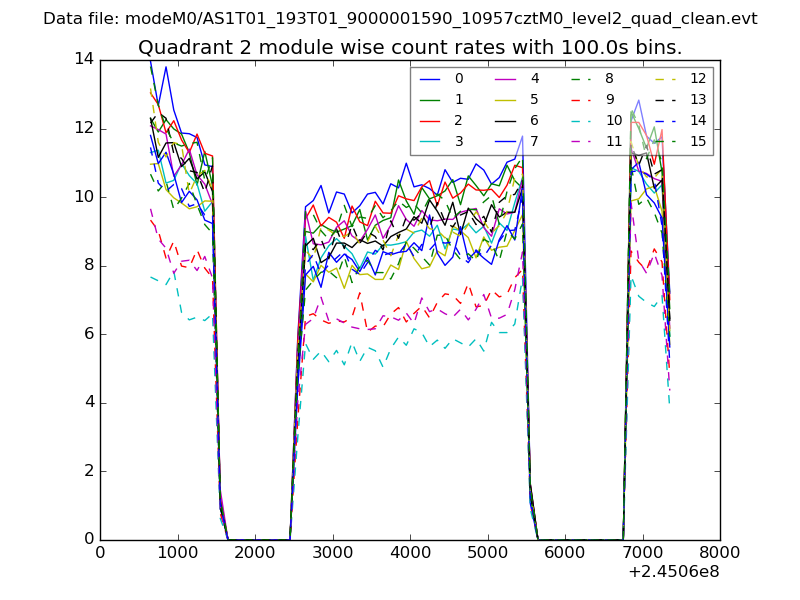
| Module-wise count rates for Quadrant B Data is divided into 100 sec bins |
 |
 |
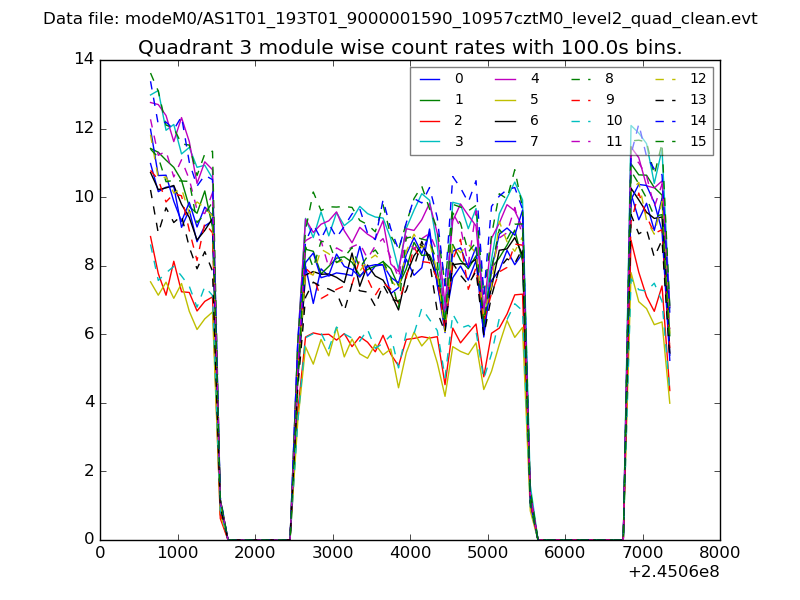
| Module-wise count rates for Quadrant C Data is divided into 100 sec bins |
 |
 |
| Module-wise count rates for Quadrant D Data is divided into 100 sec bins |
 |
 |
| Parameter | Plot |
|---|---|
| CZT HV Monitor | 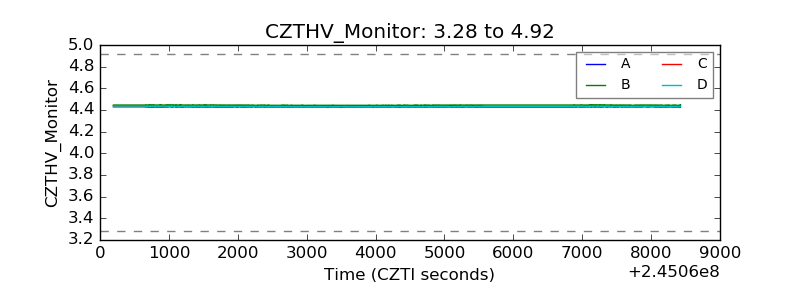 |
| D_VDD |  |
| Temperature 1 | 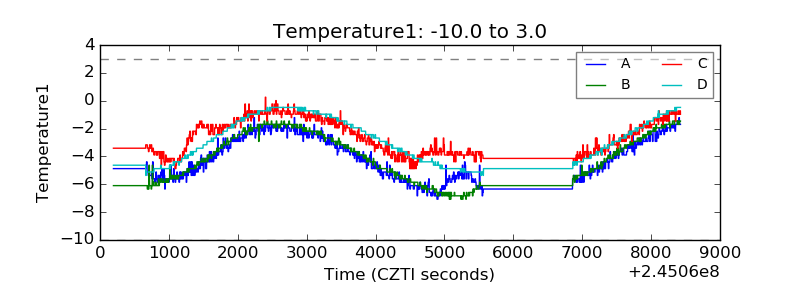 |
| Veto HV Monitor | 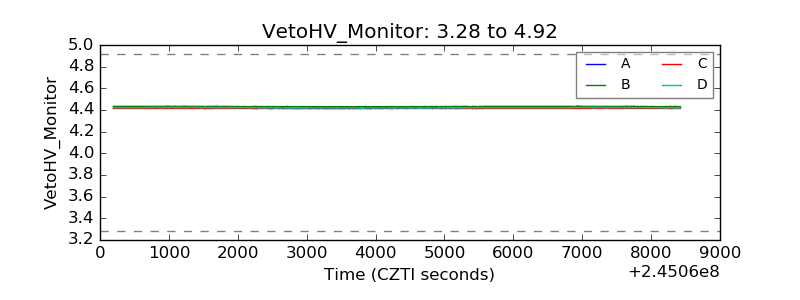 |
| Veto LLD | 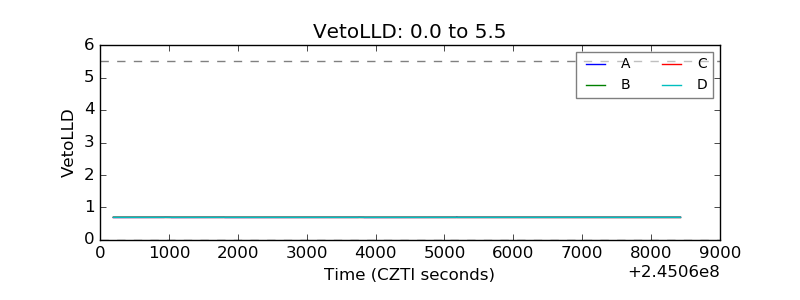 |
| Alpha Counter | 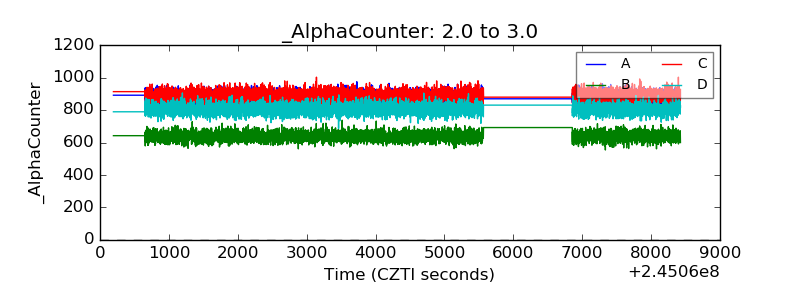 |
| _CPM_Rate | 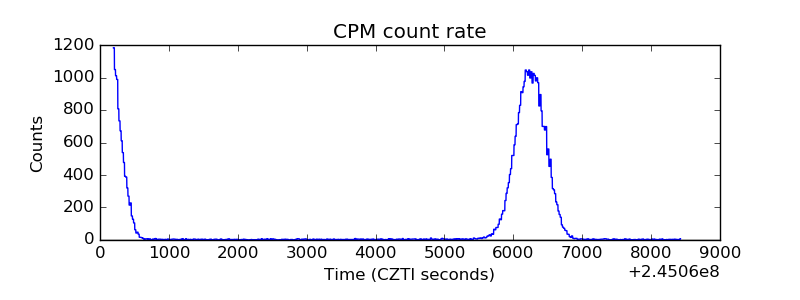 |
| CZT Counter |  |
| +2.5 Volts monitor |  |
| +5 Volts monitor |  |
| _ROLL_ROT | 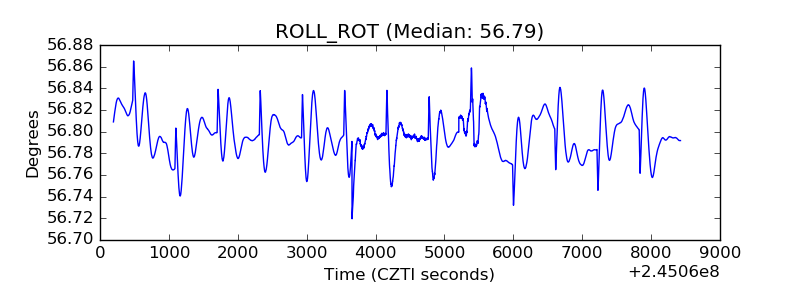 |
| _Roll_DEC | 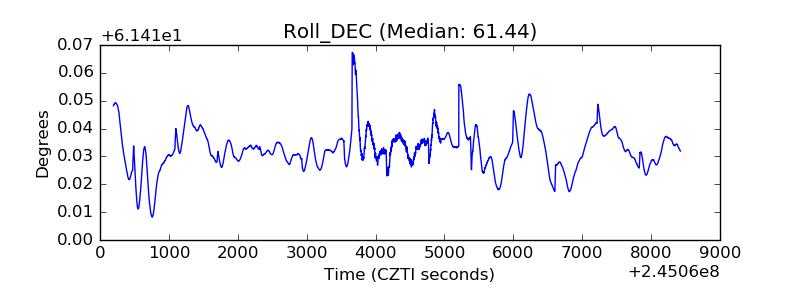 |
| _Roll_RA | 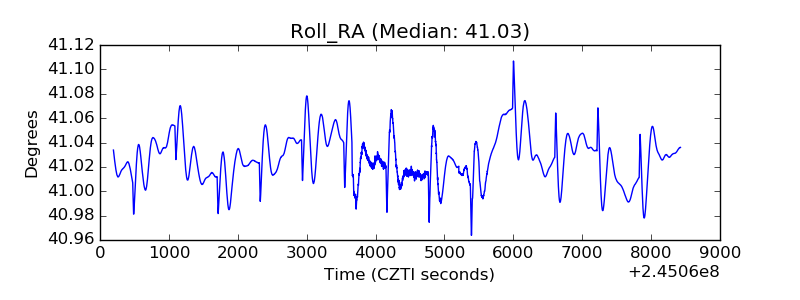 |
| Veto Counter | 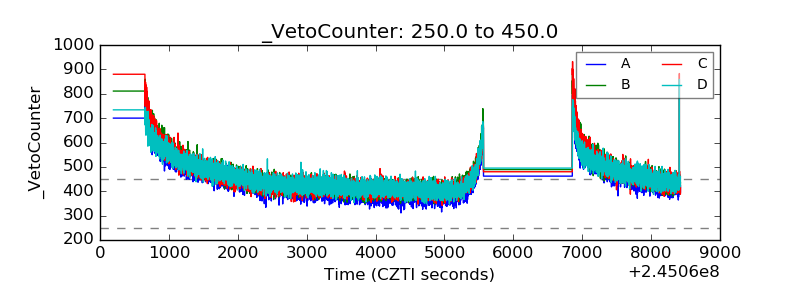 |