| Param | Original file | Final file |
|---|---|---|
| Filename | modeM0/AS1T01_193T01_9000001590_10958cztM0_level2.evt | modeM0/AS1T01_193T01_9000001590_10958cztM0_level2_quad_clean.evt |
| Size (bytes) | 575,182,080 | 97,018,560 |
| Size | 548.5 MB | 92.5 MB |
| Events in quadrant A | 4,788,672 | 617,605 |
| Events in quadrant B | 4,330,271 | 638,762 |
| Events in quadrant C | 3,149,031 | 642,904 |
| Events in quadrant D | 4,699,226 | 573,482 |
| Mode SS | |||
|---|---|---|---|
| Quadrant | BADHDUFLAG | Total packets | Discarded packets |
| A | 0 | 134 | 0 |
| B | 0 | 134 | 0 |
| C | 0 | 134 | 0 |
| D | 0 | 134 | 0 |
| Mode M0 | |||
|---|---|---|---|
| Quadrant | BADHDUFLAG | Total packets | Discarded packets |
| A | 0 | 18439 | 2 |
| B | 0 | 16985 | 1 |
| C | 0 | 13702 | 1 |
| D | 0 | 18287 | 1 |
| Mode M9 | |||
|---|---|---|---|
| Quadrant | BADHDUFLAG | Total packets | Discarded packets |
| A | 0 | 11 | 0 |
| B | 0 | 11 | 0 |
| C | 0 | 11 | 0 |
| D | 0 | 11 | 0 |
| Quadrant | Total seconds | Saturated seconds | Saturation percentage |
|---|---|---|---|
| A | 6673 | 505 | 7.567811% |
| B | 6673 | 407 | 6.099206% |
| C | 6673 | 102 | 1.528548% |
| D | 6673 | 600 | 8.991458% |
Noise dominated data is calculated using 1-second bins in cleaned event files. If a bin has >2000 counts, and if more than 50% of those come from <1% of pixels, then it is considered to be noise-dominated and hence unusable.
| Quadrant | # 1 sec bins | Bins with >0 counts | Bins with >2000 counts | High rate bins dominated by noise | Noise dominated (total time) | Noise dominated (detector-on time) | Marked lightcurve |
|---|---|---|---|---|---|---|---|
| A | 7798 | 6673 | 314 | 314 | 4.03% | 4.71% | 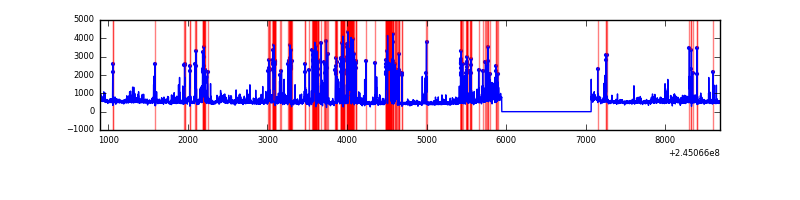 |
| B | 7798 | 6674 | 207 | 207 | 2.65% | 3.10% | 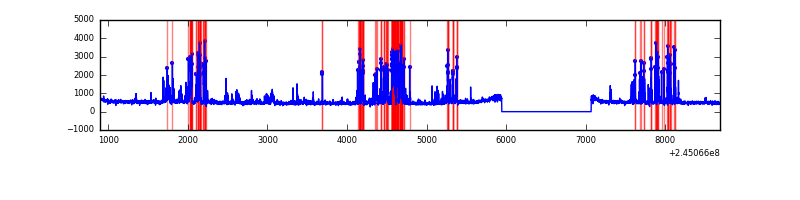 |
| C | 7798 | 6674 | 0 | 0 | 0.00% | 0.00% | 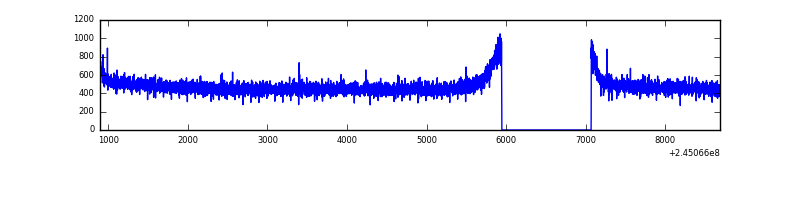 |
| D | 7798 | 6673 | 452 | 452 | 5.80% | 6.77% | 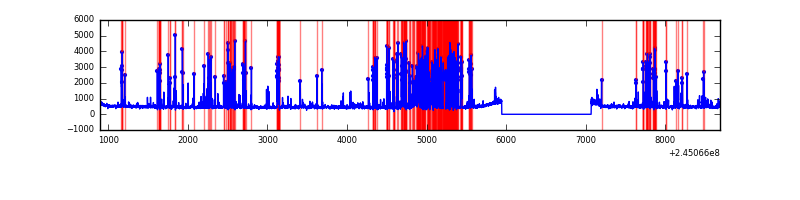 |
Top three noisy pixels from each quadrant. If the there are fewer than three noisy pixels in the level2.evt file, extra rows are filled as -1
| Pixel properties | Quadrant properties | ||||||
|---|---|---|---|---|---|---|---|
| Quadrant | DetID | PixID | Counts | Sigma | Mean | Median | Sigma |
| A | 8 | 5 | 1420193 | 8583.04 | 816 | 797 | 165.4 |
| A | 13 | 210 | 155099 | 933.06 | 816 | 797 | 165.4 |
| A | 8 | 15 | 29236 | 171.97 | 816 | 797 | 165.4 |
| B | 4 | 239 | 964565 | 6299.07 | 819 | 802 | 153.0 |
| B | 0 | 214 | 46167 | 296.5 | 819 | 802 | 153.0 |
| B | 15 | 85 | 35564 | 227.2 | 819 | 802 | 153.0 |
| C | 13 | 61 | 6028 | 28.46 | 806 | 812 | 183.3 |
| C | 14 | 67 | 2480 | 9.1 | 806 | 812 | 183.3 |
| C | 3 | 202 | 1962 | 6.27 | 806 | 812 | 183.3 |
| D | 10 | 253 | 1377520 | 7515.67 | 773 | 751 | 183.2 |
| D | 1 | 52 | 113682 | 616.48 | 773 | 751 | 183.2 |
| D | 13 | 104 | 74231 | 401.12 | 773 | 751 | 183.2 |
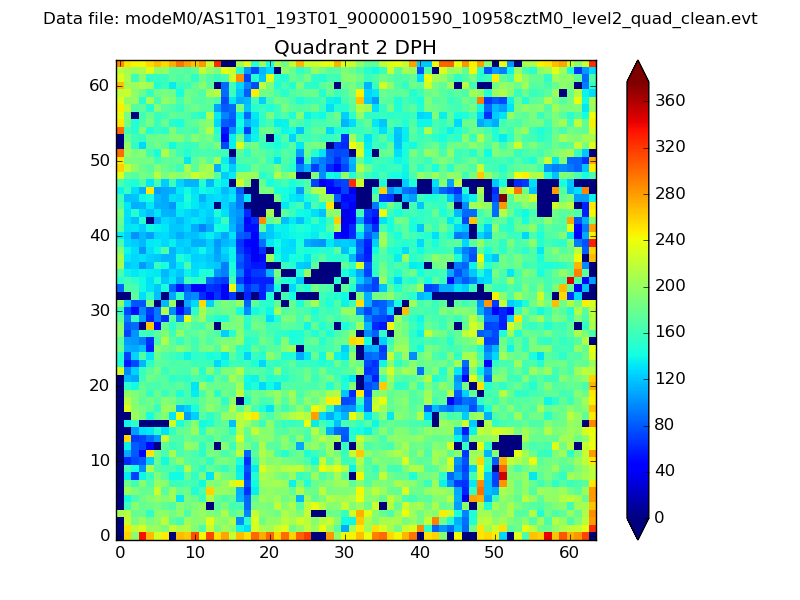
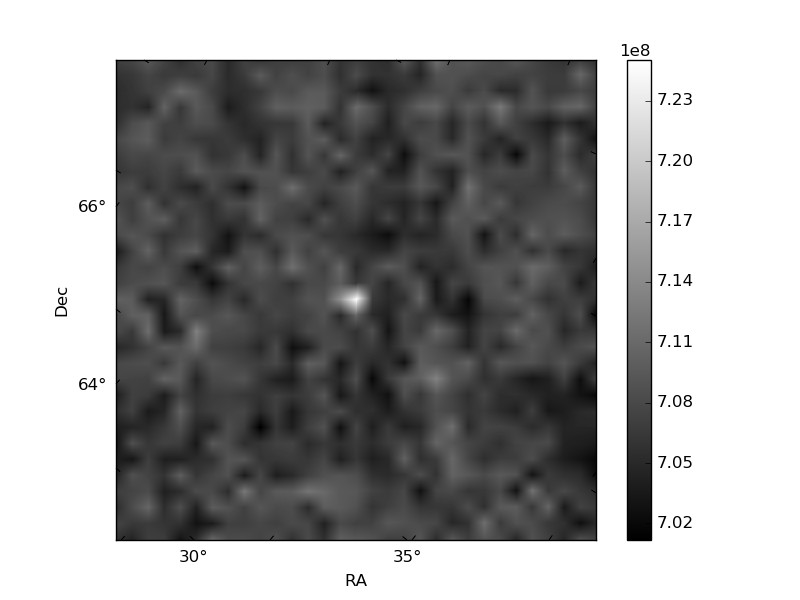
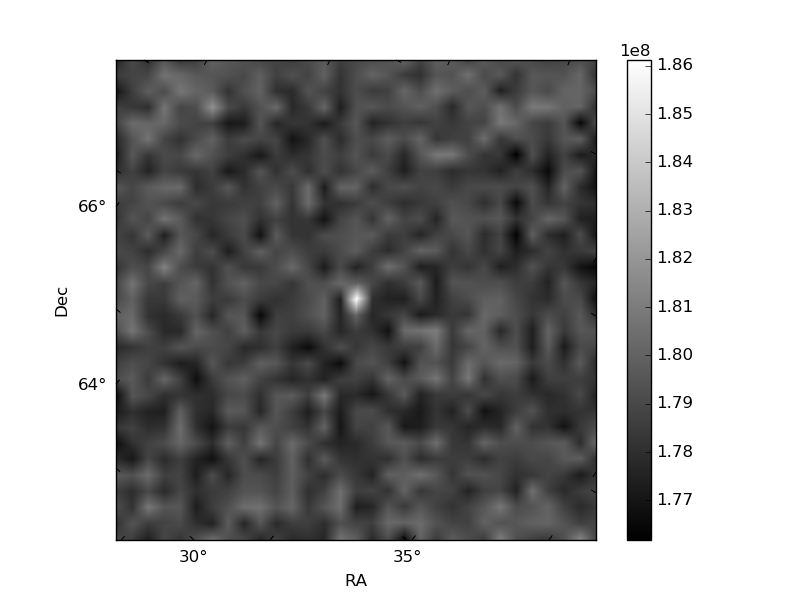
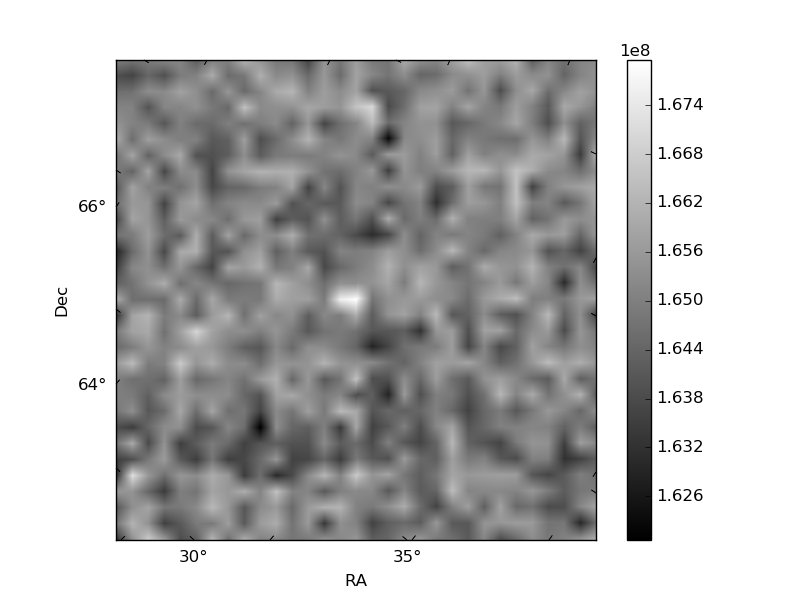
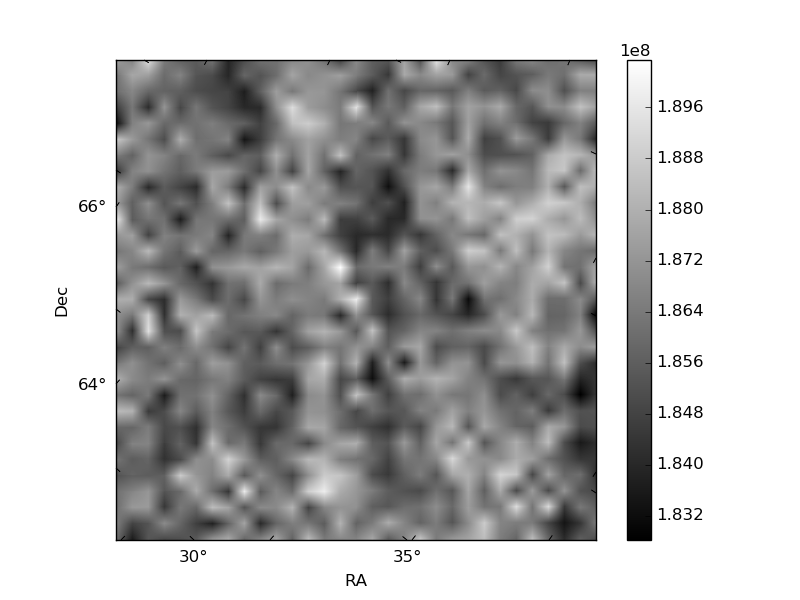
Histogram calculated using DETX and DETY for each event in the final _common_clean file
| Quadrant A | 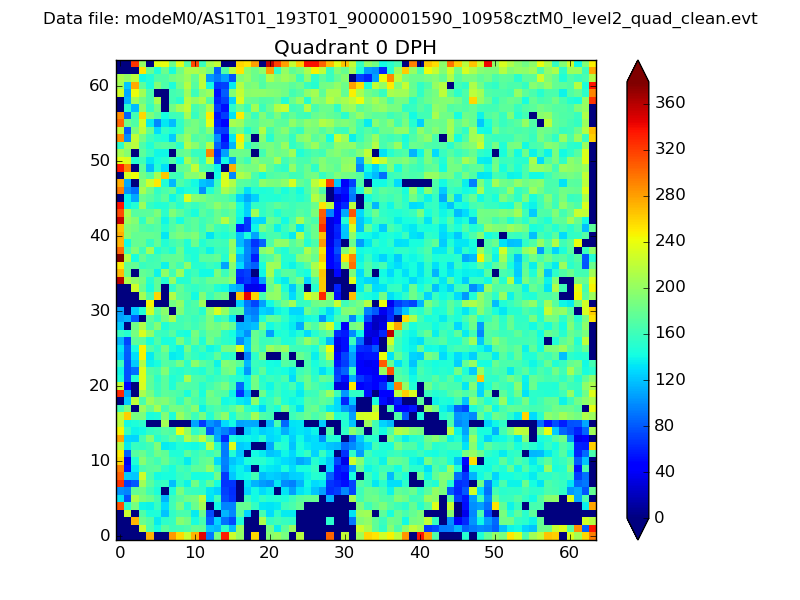 |
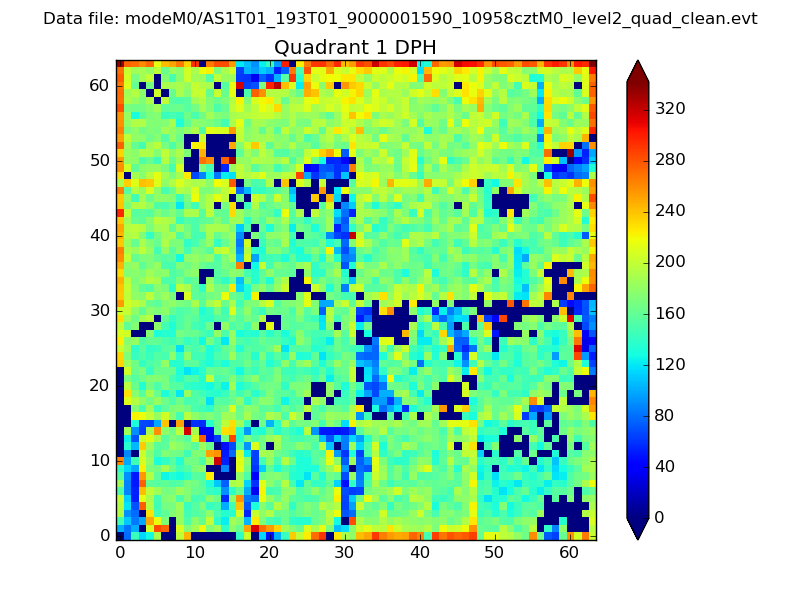 |
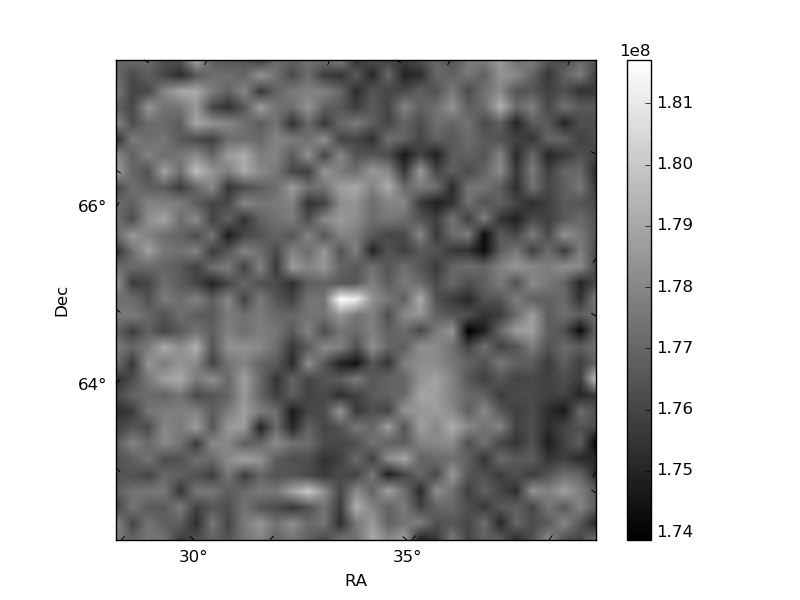
Quadrant B |
|---|---|---|---|
| Quadrant D | 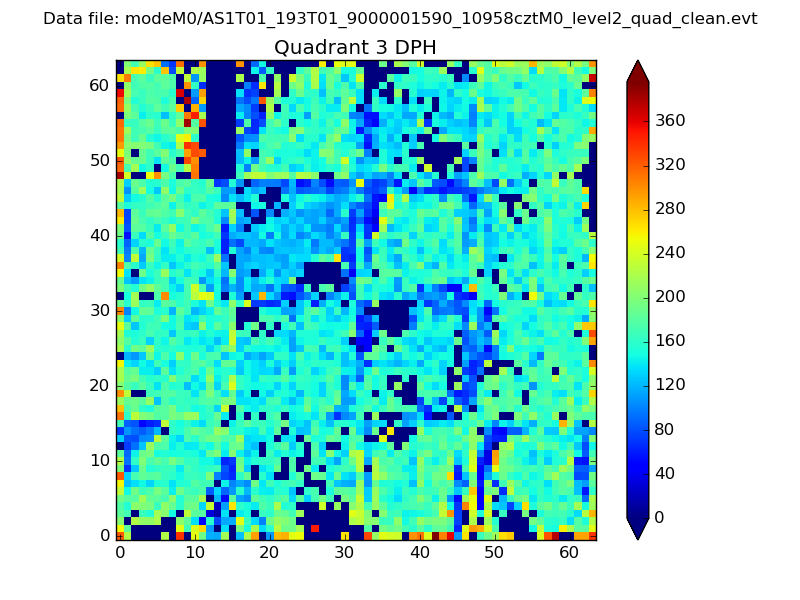 |
 |
Quadrant C |
| Plot type | Count rate plots | Images |
|---|---|---|
| Comparison with Poisson distribution Blue bars denote a histogram of data divided into 1 sec bins. Red curve is a Poisson curve with rate = median count rate of data. |
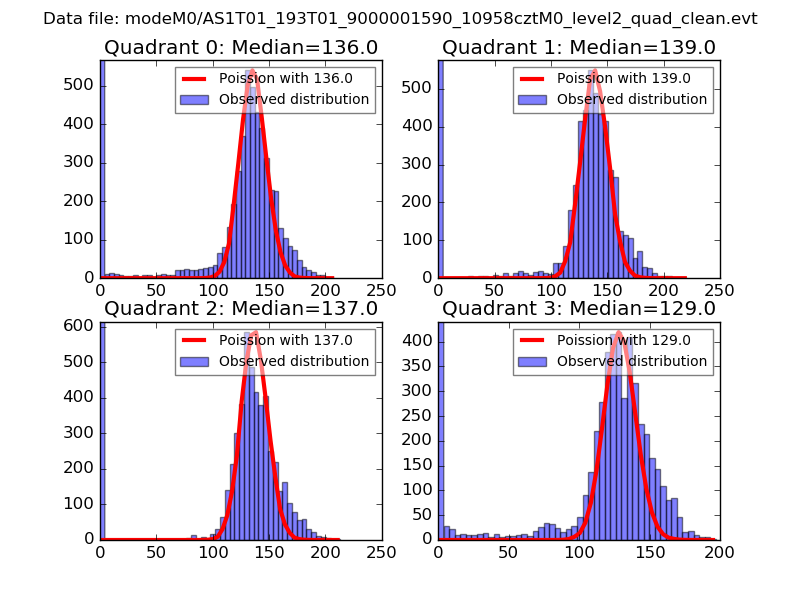 |
 |
| Quadrant-wise count rates Data is divided into 100 sec bins |
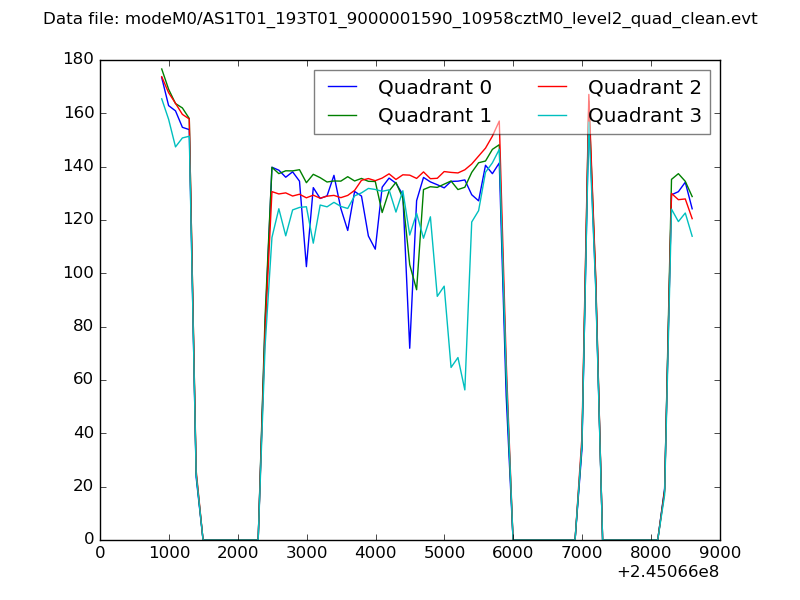 |
|
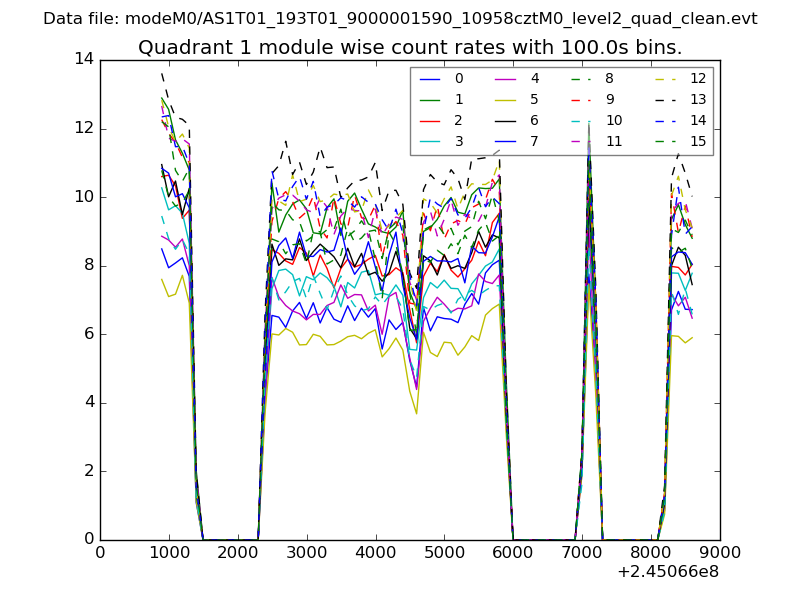
| Module-wise count rates for Quadrant A Data is divided into 100 sec bins |
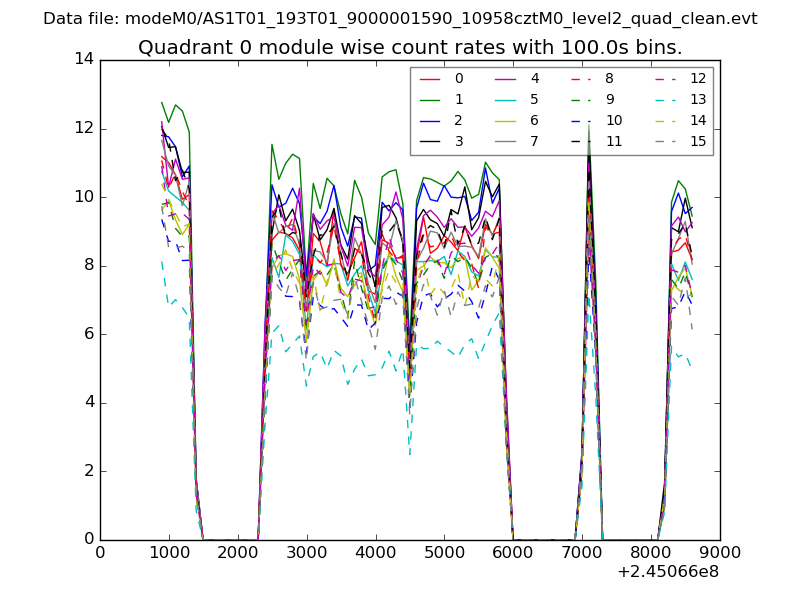 |
 |
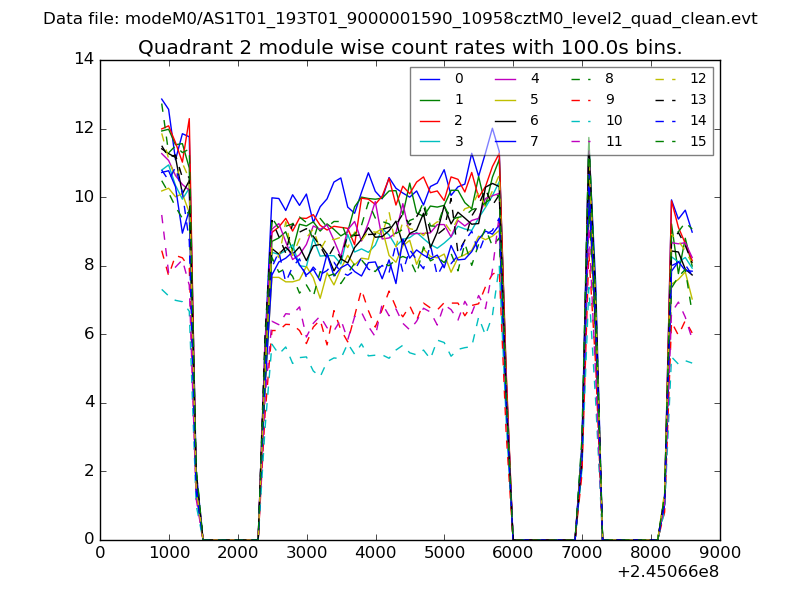
| Module-wise count rates for Quadrant B Data is divided into 100 sec bins |
 |
 |
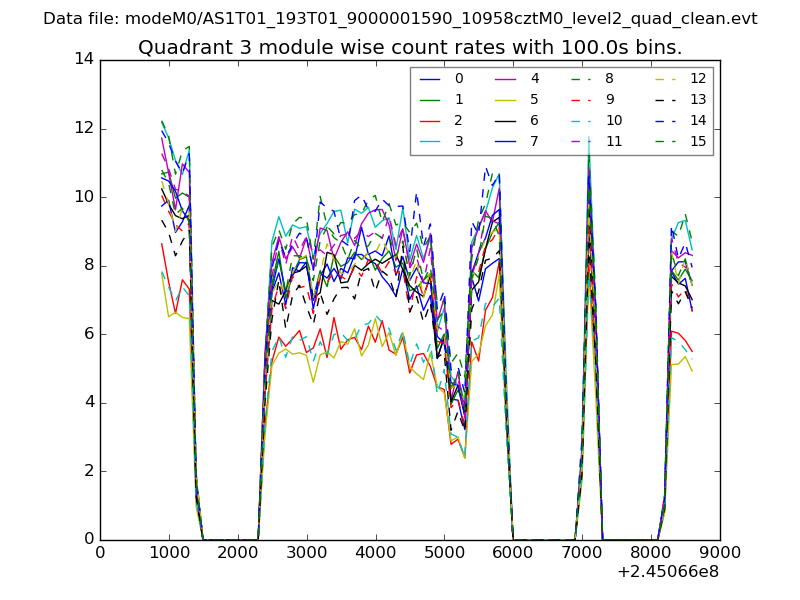
| Module-wise count rates for Quadrant C Data is divided into 100 sec bins |
 |
 |
| Module-wise count rates for Quadrant D Data is divided into 100 sec bins |
 |
 |
| Parameter | Plot |
|---|---|
| CZT HV Monitor | 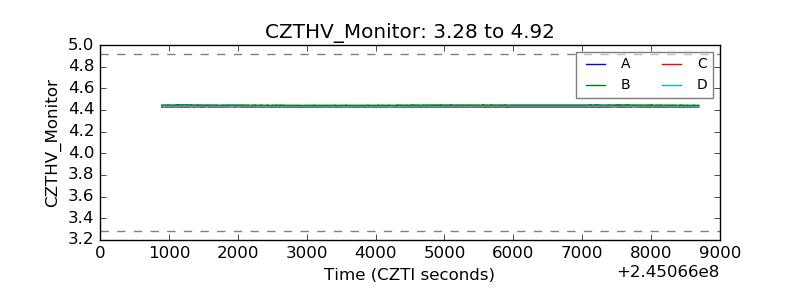 |
| D_VDD | 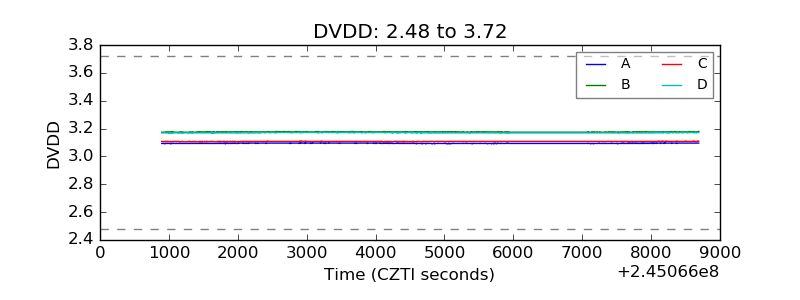 |
| Temperature 1 | 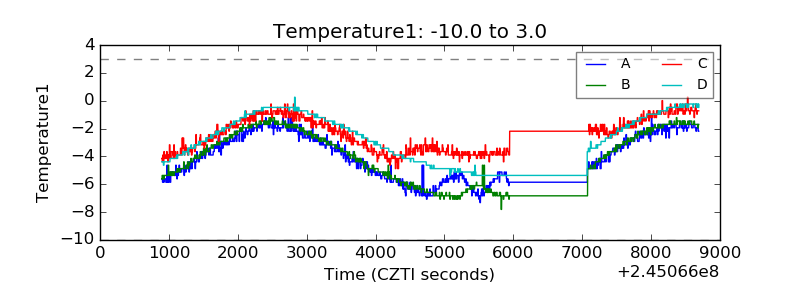 |
| Veto HV Monitor | 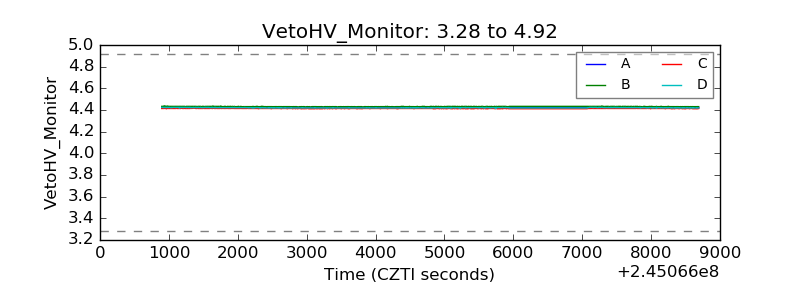 |
| Veto LLD | 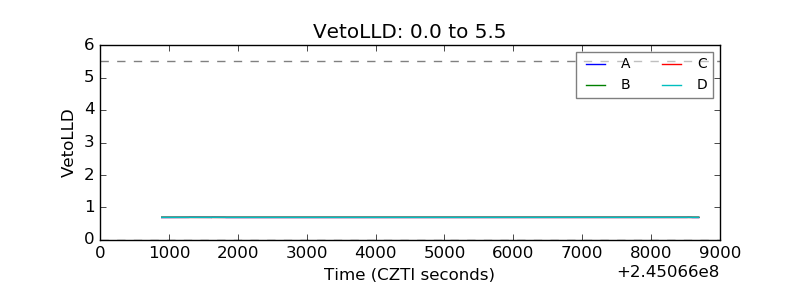 |
| Alpha Counter | 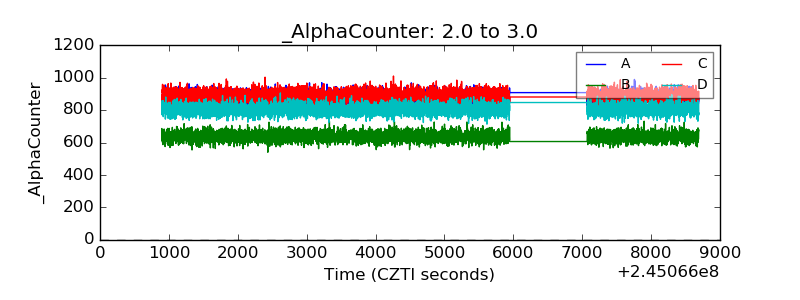 |
| _CPM_Rate | 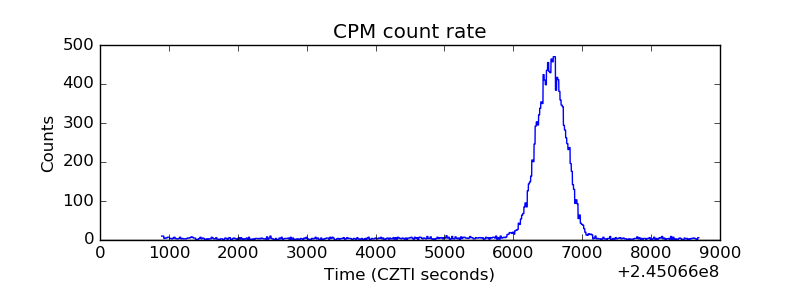 |
| CZT Counter | 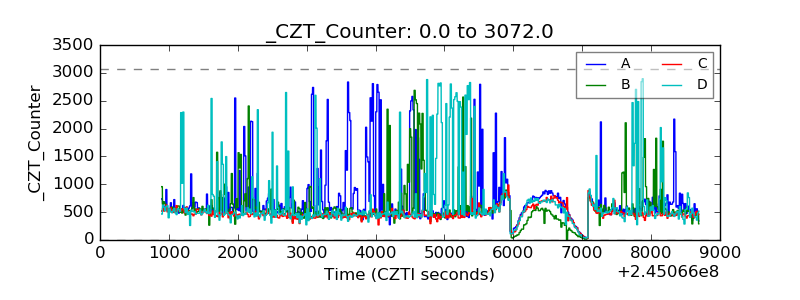 |
| +2.5 Volts monitor | 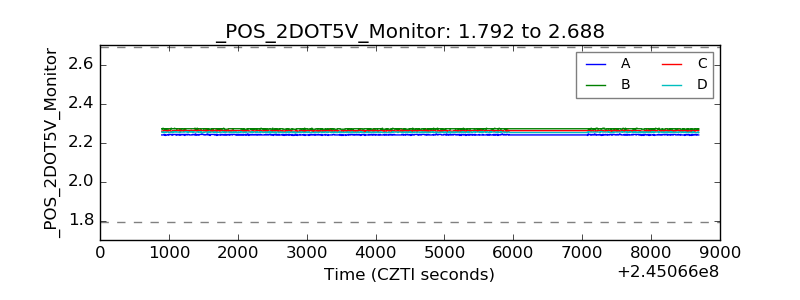 |
| +5 Volts monitor | 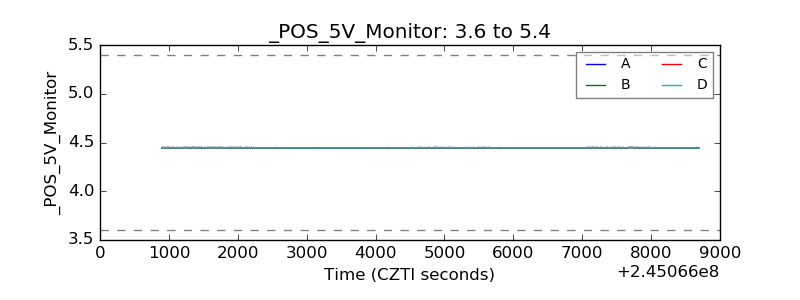 |
| _ROLL_ROT | 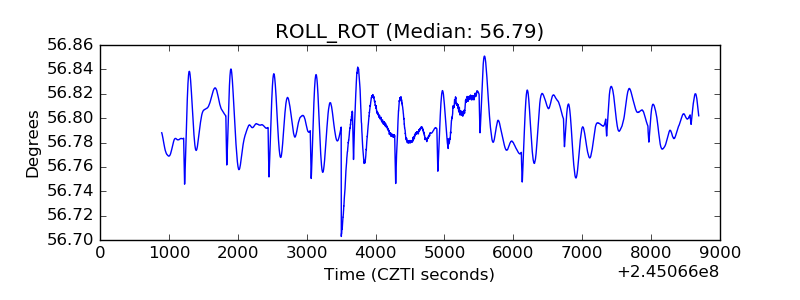 |
| _Roll_DEC | 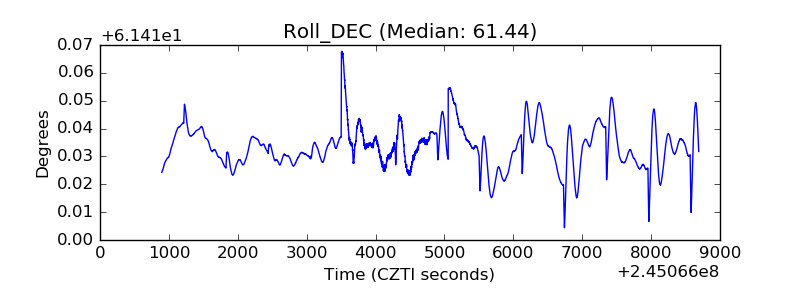 |
| _Roll_RA | 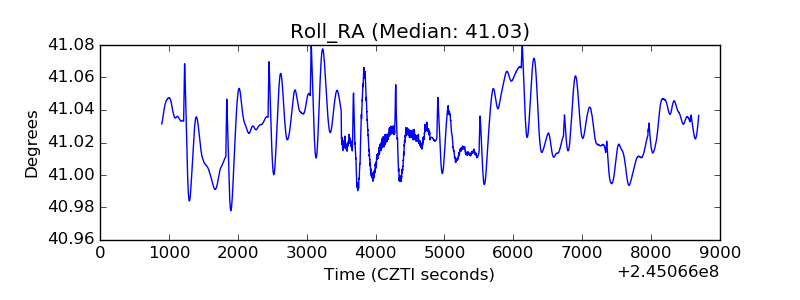 |
| Veto Counter | 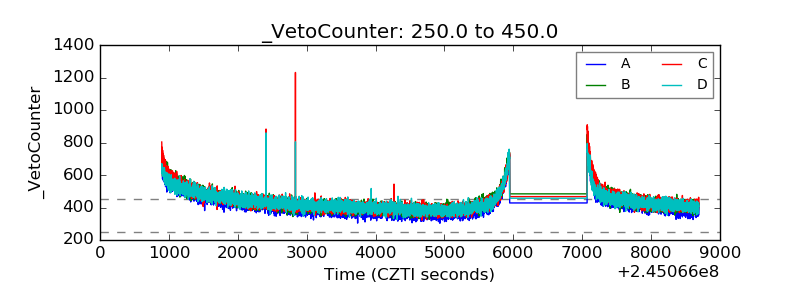 |