| Param | Original file | Final file |
|---|---|---|
| Filename | modeM0/AS1T01_193T01_9000001590_10959cztM0_level2.evt | modeM0/AS1T01_193T01_9000001590_10959cztM0_level2_quad_clean.evt |
| Size (bytes) | 570,911,040 | 97,534,080 |
| Size | 544.5 MB | 93.0 MB |
| Events in quadrant A | 4,800,838 | 623,069 |
| Events in quadrant B | 4,028,256 | 640,702 |
| Events in quadrant C | 3,032,969 | 641,783 |
| Events in quadrant D | 4,973,183 | 580,319 |
| Mode SS | |||
|---|---|---|---|
| Quadrant | BADHDUFLAG | Total packets | Discarded packets |
| A | 0 | 136 | 0 |
| B | 0 | 136 | 0 |
| C | 0 | 136 | 0 |
| D | 0 | 136 | 0 |
| Mode M0 | |||
|---|---|---|---|
| Quadrant | BADHDUFLAG | Total packets | Discarded packets |
| A | 0 | 18604 | 2 |
| B | 0 | 16285 | 1 |
| C | 0 | 13622 | 1 |
| D | 0 | 19361 | 1 |
| Mode M9 | |||
|---|---|---|---|
| Quadrant | BADHDUFLAG | Total packets | Discarded packets |
| A | 0 | 9 | 0 |
| B | 0 | 9 | 0 |
| C | 0 | 9 | 0 |
| D | 0 | 9 | 0 |
| Quadrant | Total seconds | Saturated seconds | Saturation percentage |
|---|---|---|---|
| A | 6705 | 437 | 6.517524% |
| B | 6705 | 309 | 4.608501% |
| C | 6705 | 77 | 1.148397% |
| D | 6705 | 767 | 11.439224% |
Noise dominated data is calculated using 1-second bins in cleaned event files. If a bin has >2000 counts, and if more than 50% of those come from <1% of pixels, then it is considered to be noise-dominated and hence unusable.
| Quadrant | # 1 sec bins | Bins with >0 counts | Bins with >2000 counts | High rate bins dominated by noise | Noise dominated (total time) | Noise dominated (detector-on time) | Marked lightcurve |
|---|---|---|---|---|---|---|---|
| A | 7590 | 6705 | 290 | 290 | 3.82% | 4.33% | 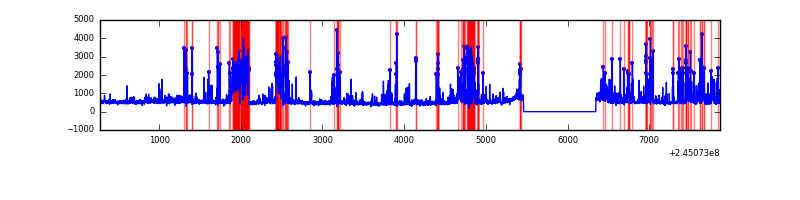 |
| B | 7590 | 6705 | 144 | 144 | 1.90% | 2.15% | 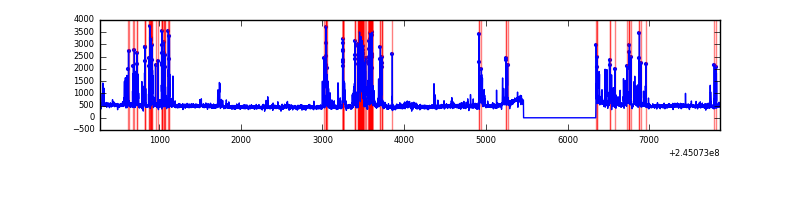 |
| C | 7590 | 6706 | 0 | 0 | 0.00% | 0.00% | 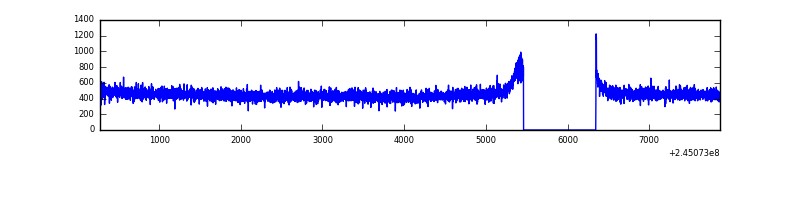 |
| D | 7590 | 6706 | 608 | 608 | 8.01% | 9.07% | 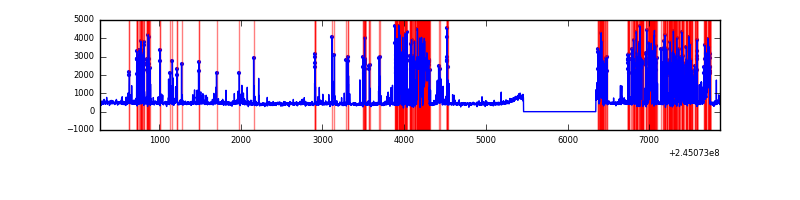 |
Top three noisy pixels from each quadrant. If the there are fewer than three noisy pixels in the level2.evt file, extra rows are filled as -1
| Pixel properties | Quadrant properties | ||||||
|---|---|---|---|---|---|---|---|
| Quadrant | DetID | PixID | Counts | Sigma | Mean | Median | Sigma |
| A | 8 | 5 | 1607654 | 10116.29 | 787 | 771 | 158.8 |
| A | 8 | 15 | 98626 | 616.06 | 787 | 771 | 158.8 |
| A | 13 | 210 | 40449 | 249.8 | 787 | 771 | 158.8 |
| B | 4 | 239 | 838071 | 5587.49 | 791 | 774 | 149.9 |
| B | 0 | 214 | 44363 | 290.88 | 791 | 774 | 149.9 |
| B | 0 | 187 | 22753 | 146.67 | 791 | 774 | 149.9 |
| C | 13 | 61 | 5860 | 28.59 | 776 | 780 | 177.7 |
| C | 5 | 207 | 3649 | 16.15 | 776 | 780 | 177.7 |
| C | 8 | 222 | 2744 | 11.05 | 776 | 780 | 177.7 |
| D | 10 | 253 | 1646162 | 9402.35 | 728 | 707 | 175.0 |
| D | 1 | 52 | 215034 | 1224.69 | 728 | 707 | 175.0 |
| D | 14 | 34 | 129604 | 736.54 | 728 | 707 | 175.0 |
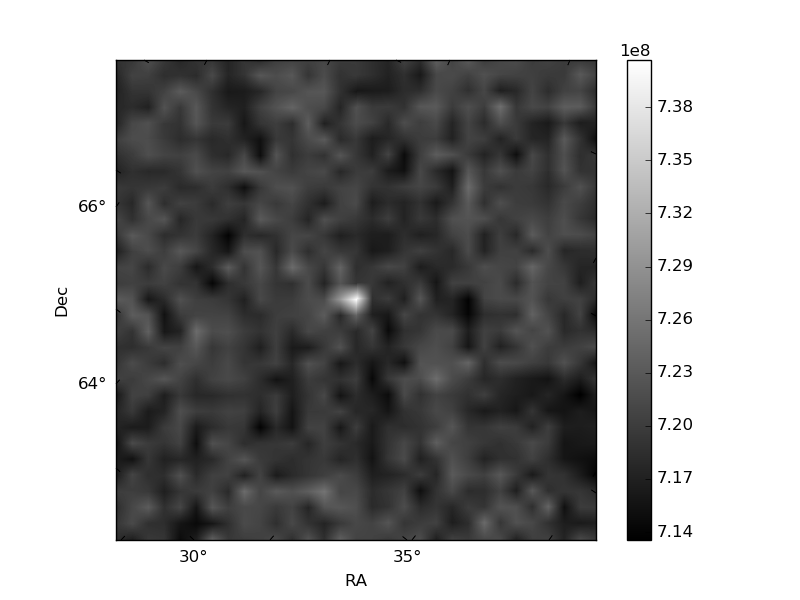
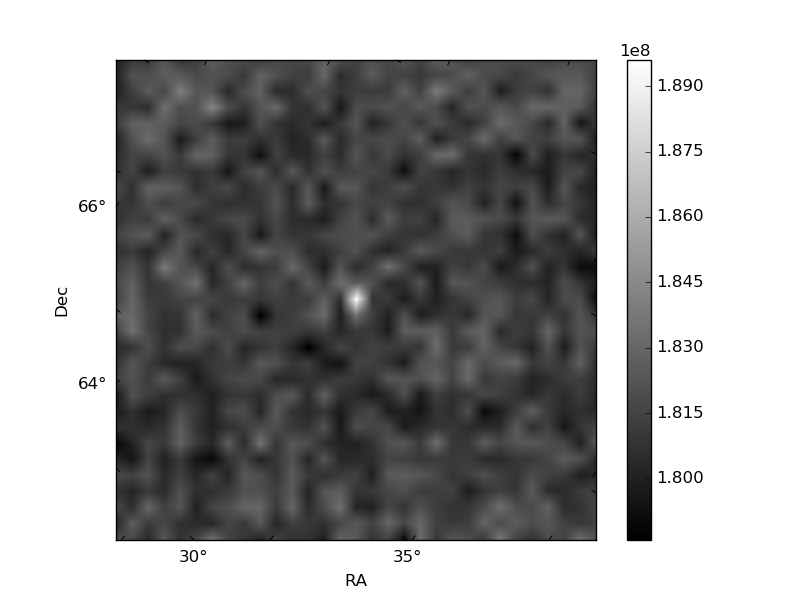
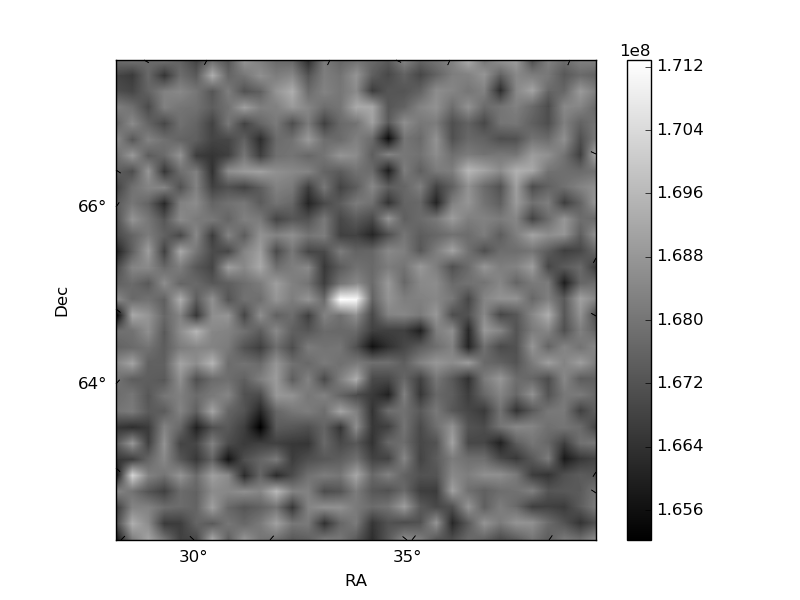
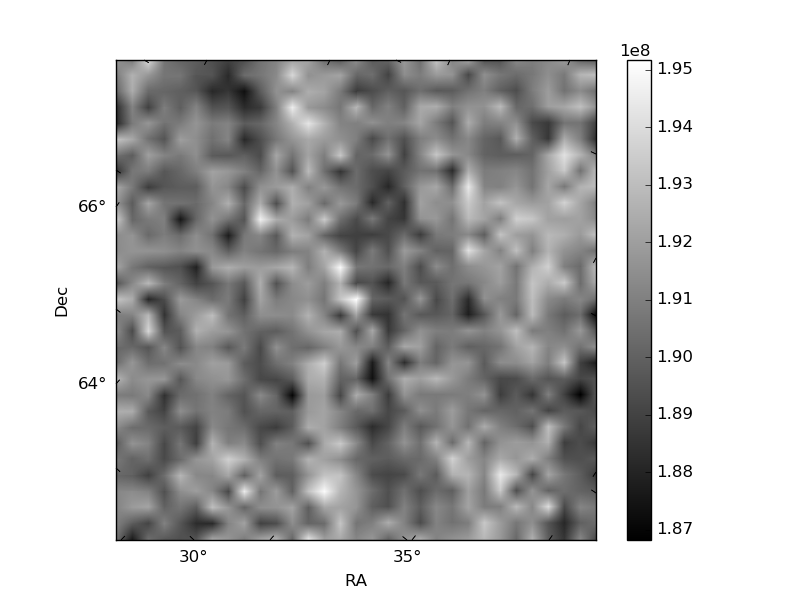
Histogram calculated using DETX and DETY for each event in the final _common_clean file
| Quadrant A | 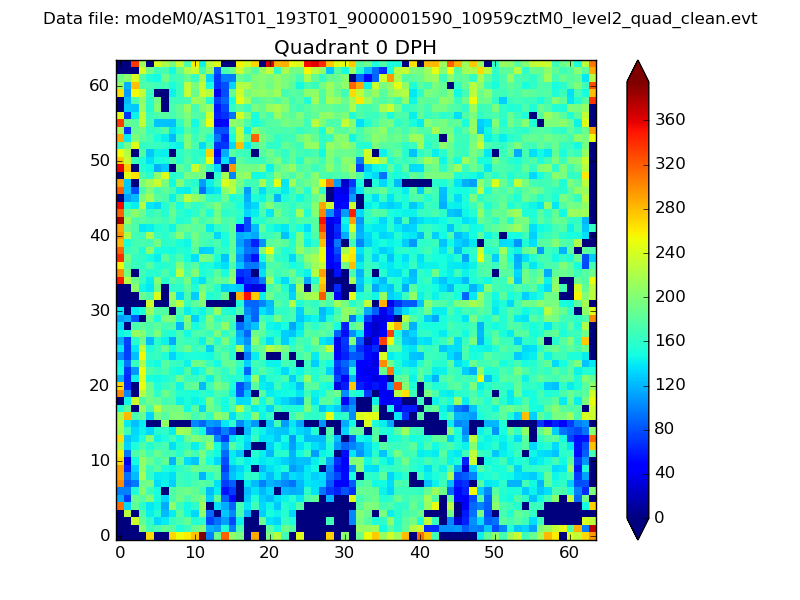 |
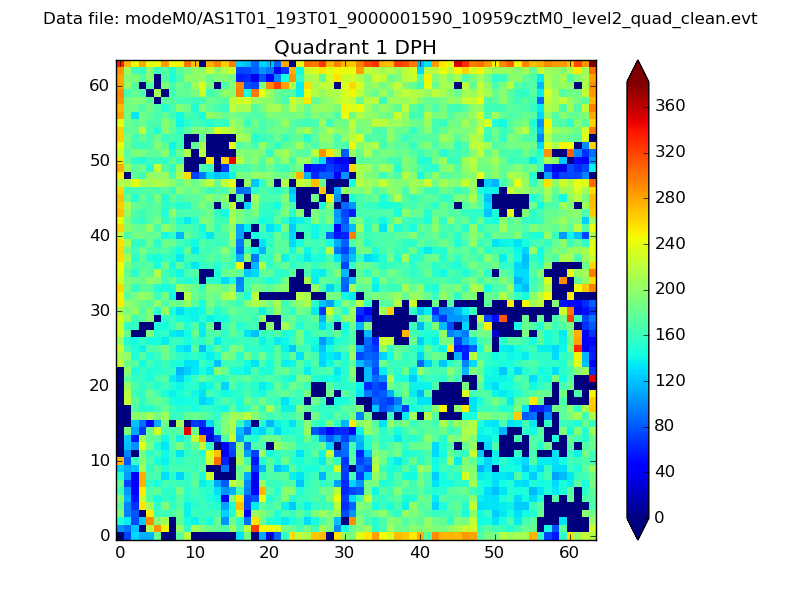 |
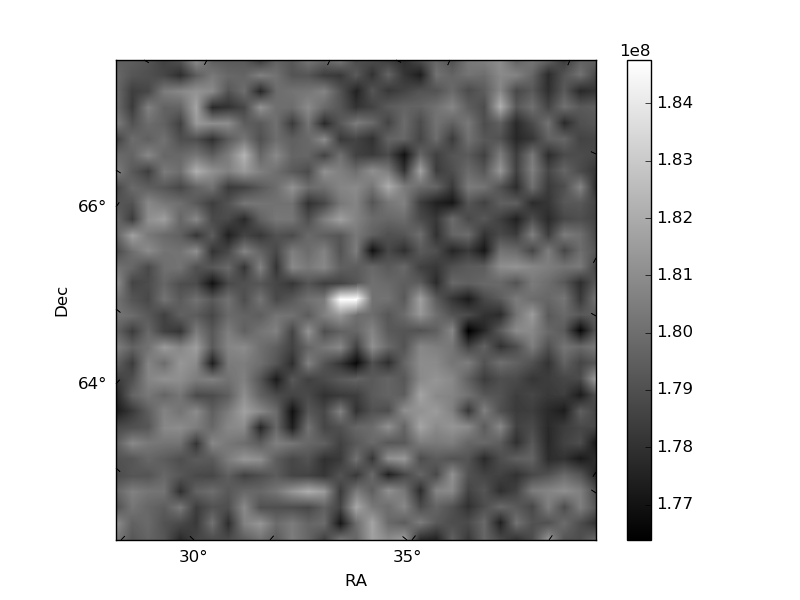
Quadrant B |
|---|---|---|---|
| Quadrant D | 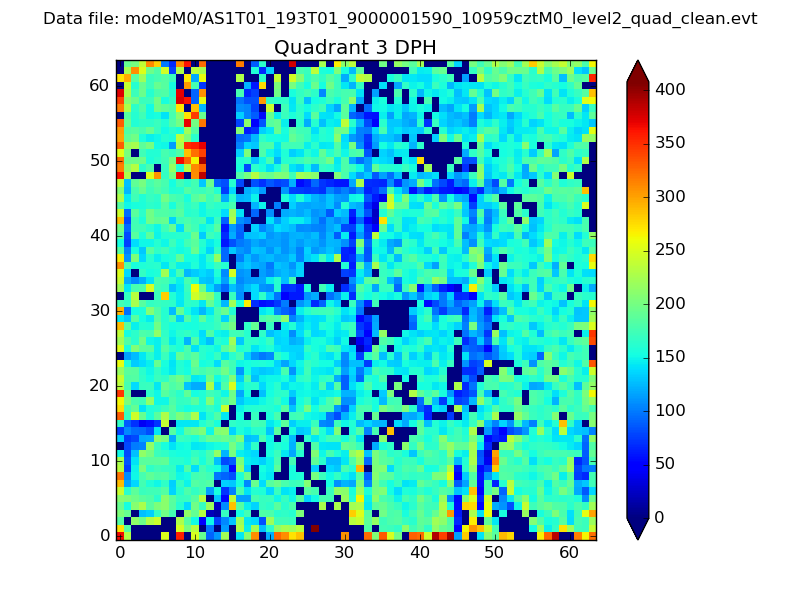 |
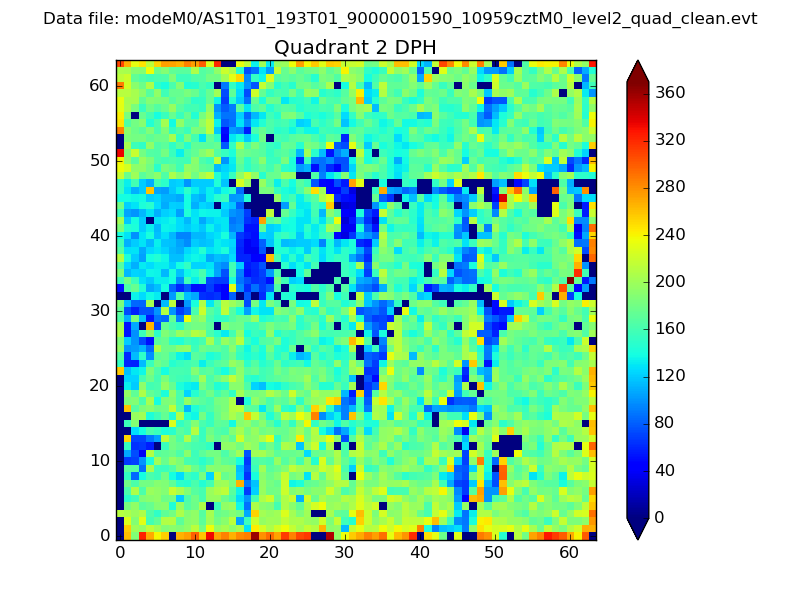 |
Quadrant C |
| Plot type | Count rate plots | Images |
|---|---|---|
| Comparison with Poisson distribution Blue bars denote a histogram of data divided into 1 sec bins. Red curve is a Poisson curve with rate = median count rate of data. |
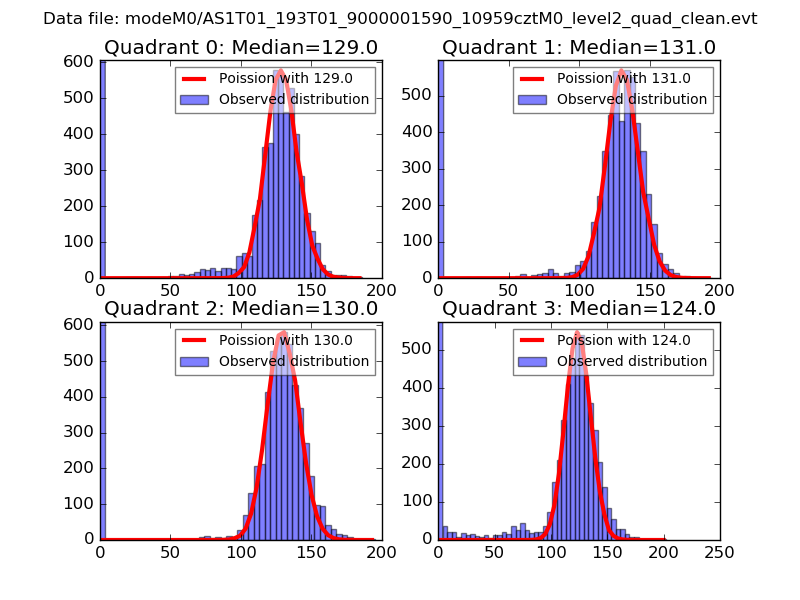 |
 |
| Quadrant-wise count rates Data is divided into 100 sec bins |
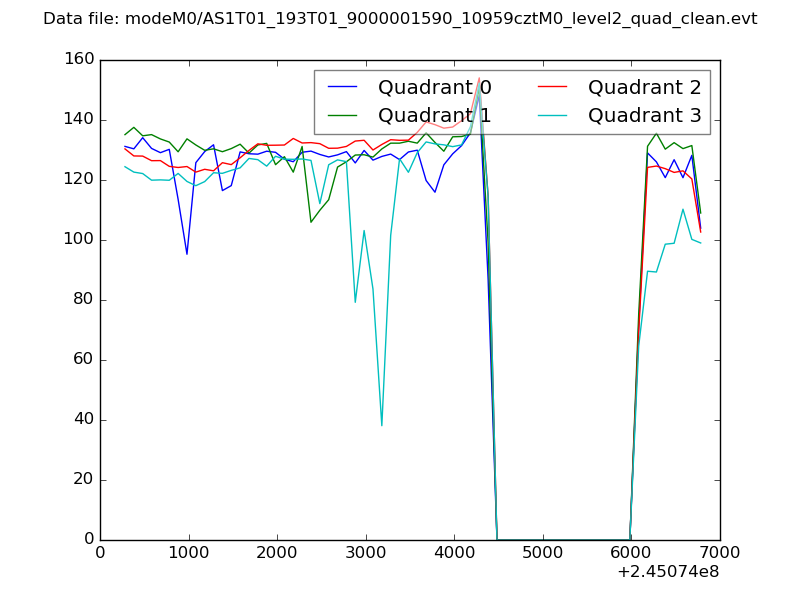 |
|
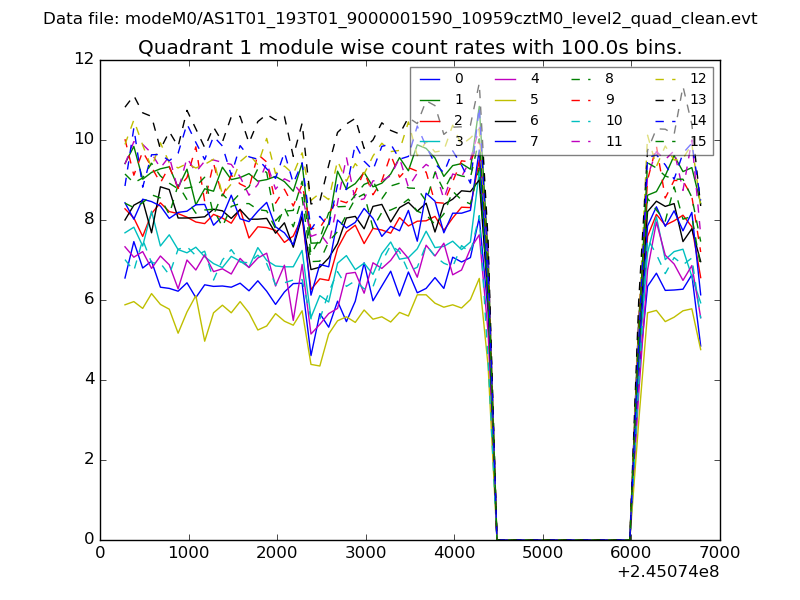
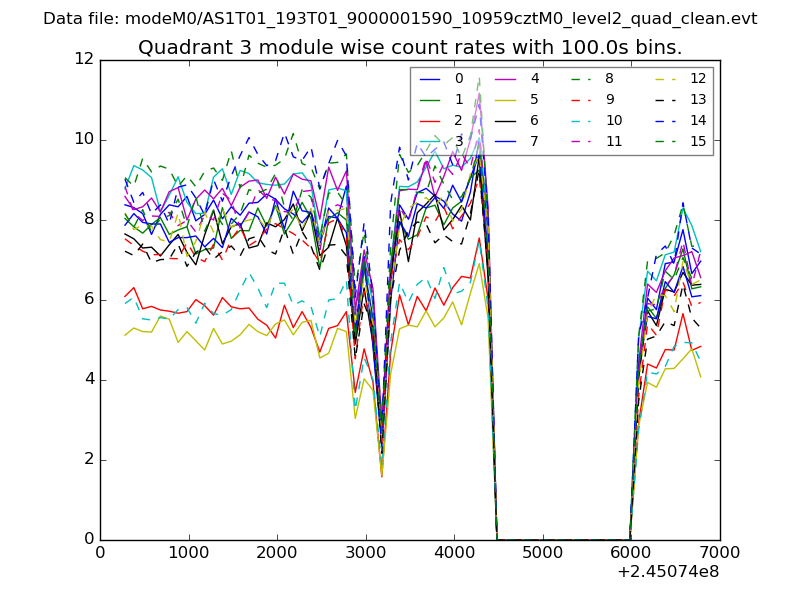
| Module-wise count rates for Quadrant A Data is divided into 100 sec bins |
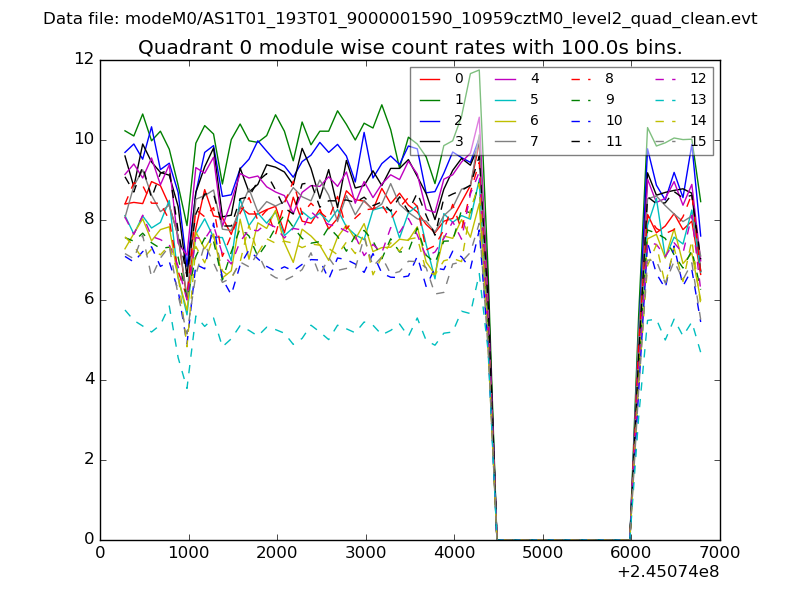 |
 |
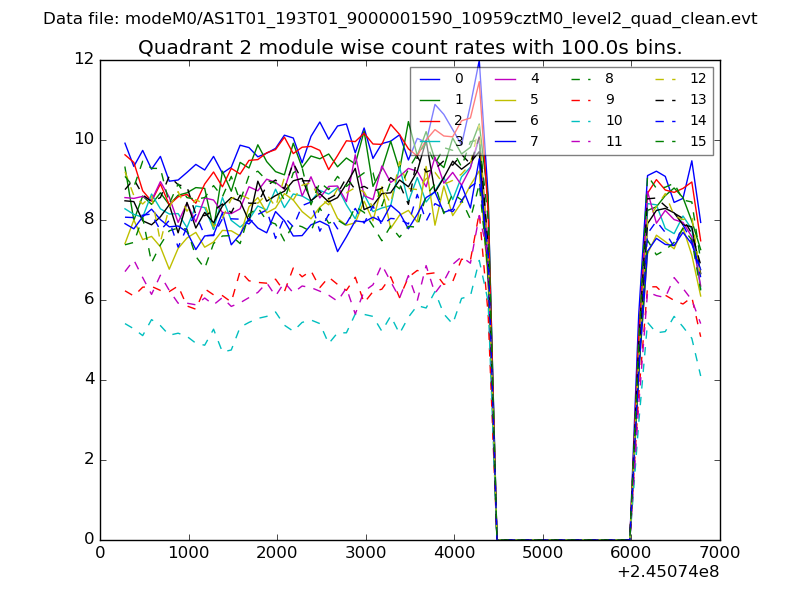
| Module-wise count rates for Quadrant B Data is divided into 100 sec bins |
 |
 |
| Module-wise count rates for Quadrant C Data is divided into 100 sec bins |
 |
 |
| Module-wise count rates for Quadrant D Data is divided into 100 sec bins |
 |
 |
| Parameter | Plot |
|---|---|
| CZT HV Monitor | 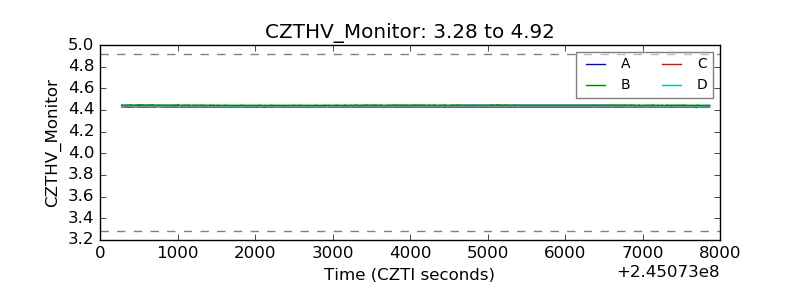 |
| D_VDD | 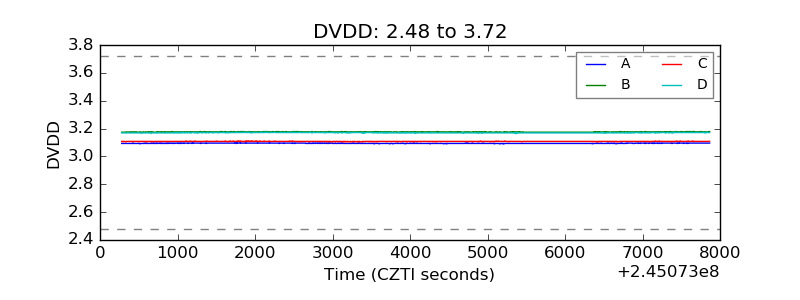 |
| Temperature 1 | 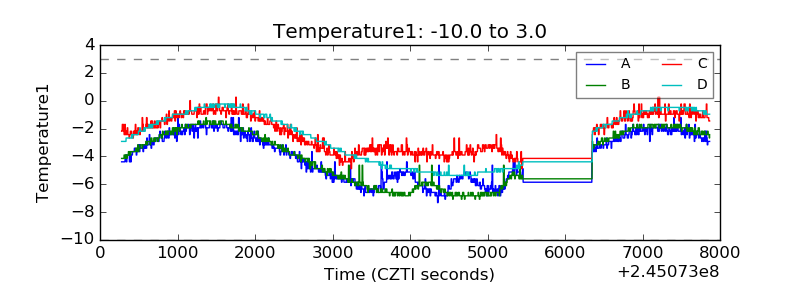 |
| Veto HV Monitor |  |
| Veto LLD | 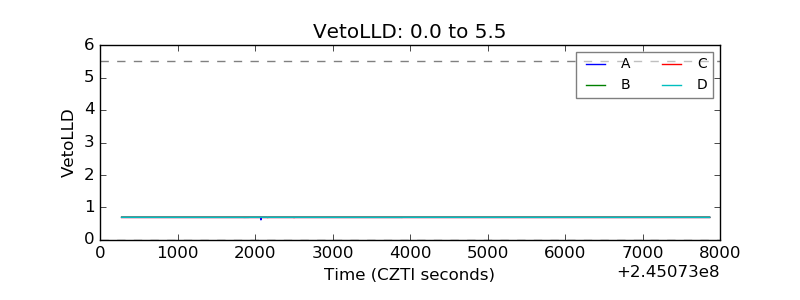 |
| Alpha Counter | 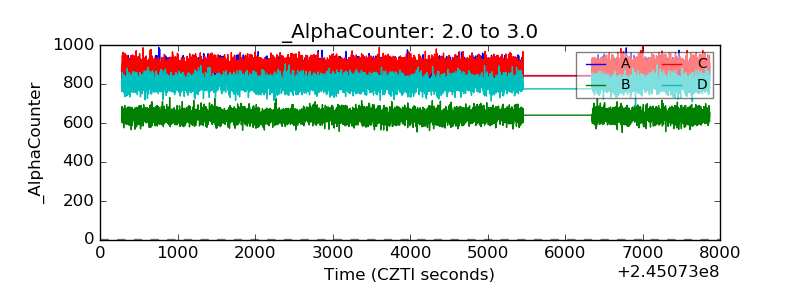 |
| _CPM_Rate | 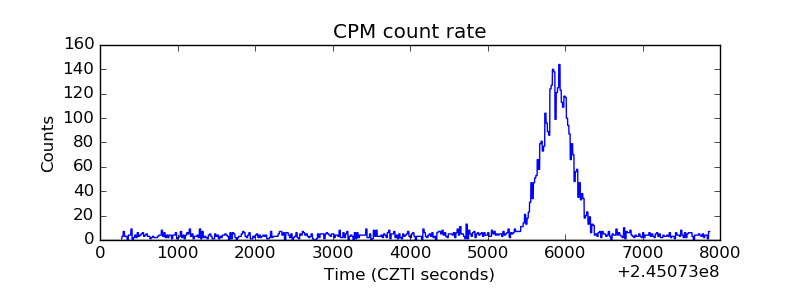 |
| CZT Counter | 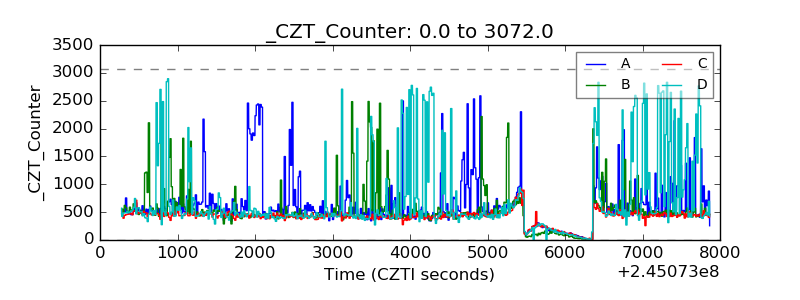 |
| +2.5 Volts monitor |  |
| +5 Volts monitor |  |
| _ROLL_ROT | 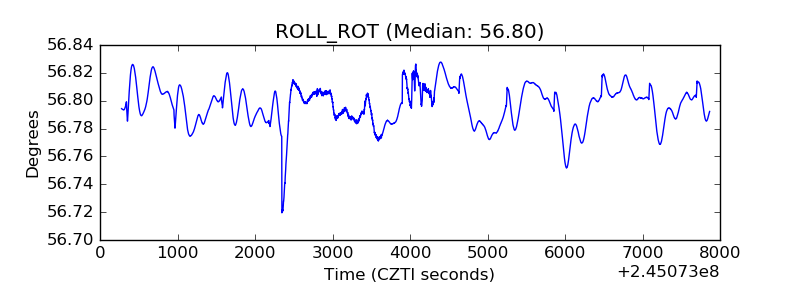 |
| _Roll_DEC | 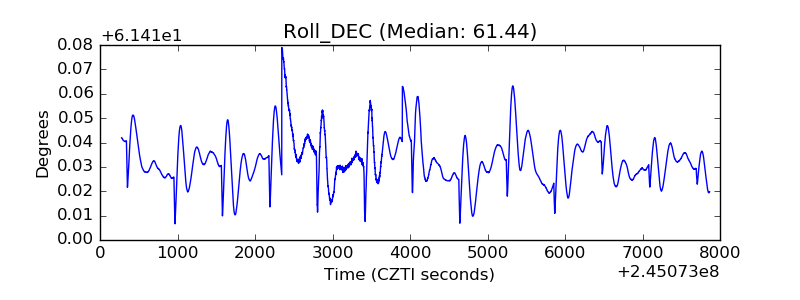 |
| _Roll_RA | 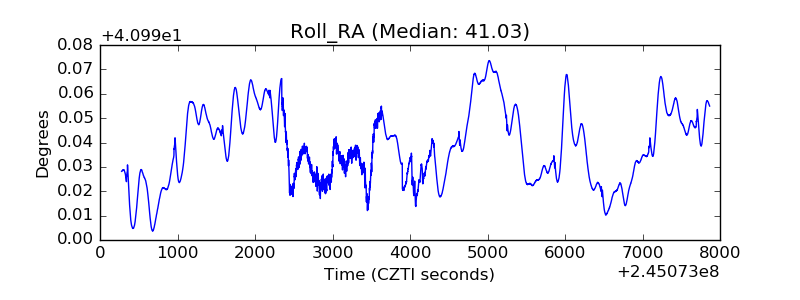 |
| Veto Counter | 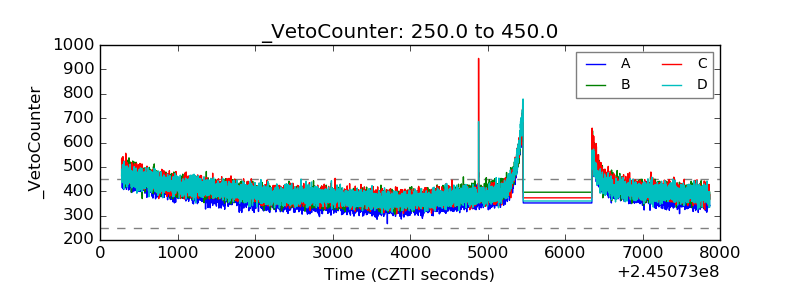 |