| Param | Original file | Final file |
|---|---|---|
| Filename | modeM0/AS1T01_193T01_9000001590_10960cztM0_level2.evt | modeM0/AS1T01_193T01_9000001590_10960cztM0_level2_quad_clean.evt |
| Size (bytes) | 523,074,240 | 98,919,360 |
| Size | 498.8 MB | 94.3 MB |
| Events in quadrant A | 4,409,589 | 645,303 |
| Events in quadrant B | 3,531,960 | 664,128 |
| Events in quadrant C | 2,734,193 | 669,077 |
| Events in quadrant D | 4,748,055 | 587,484 |
| Mode SS | |||
|---|---|---|---|
| Quadrant | BADHDUFLAG | Total packets | Discarded packets |
| A | 0 | 136 | 10 |
| B | 0 | 136 | 12 |
| C | 0 | 135 | 7 |
| D | 0 | 136 | 12 |
| Mode M0 | |||
|---|---|---|---|
| Quadrant | BADHDUFLAG | Total packets | Discarded packets |
| A | 0 | 18959 | 1678 |
| B | 0 | 16078 | 1572 |
| C | 0 | 13736 | 1176 |
| D | 0 | 20906 | 2533 |
| Mode M9 | |||
|---|---|---|---|
| Quadrant | BADHDUFLAG | Total packets | Discarded packets |
| A | 0 | 5 | 1 |
| B | 0 | 5 | 1 |
| C | 0 | 5 | 0 |
| D | 0 | 5 | 1 |
| Quadrant | Total seconds | Saturated seconds | Saturation percentage |
|---|---|---|---|
| A | 6137 | 289 | 4.709141% |
| B | 6152 | 190 | 3.088427% |
| C | 6208 | 22 | 0.354381% |
| D | 6081 | 803 | 13.205065% |
Noise dominated data is calculated using 1-second bins in cleaned event files. If a bin has >2000 counts, and if more than 50% of those come from <1% of pixels, then it is considered to be noise-dominated and hence unusable.
| Quadrant | # 1 sec bins | Bins with >0 counts | Bins with >2000 counts | High rate bins dominated by noise | Noise dominated (total time) | Noise dominated (detector-on time) | Marked lightcurve |
|---|---|---|---|---|---|---|---|
| A | 7240 | 6381 | 186 | 186 | 2.57% | 2.91% | 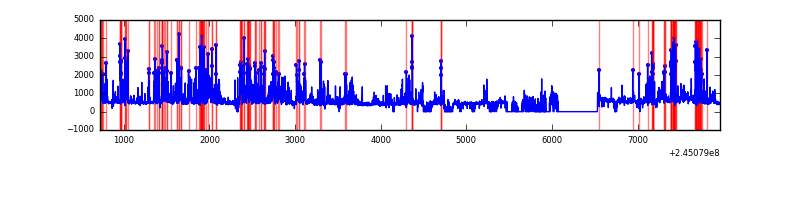 |
| B | 7240 | 6401 | 97 | 97 | 1.34% | 1.52% | 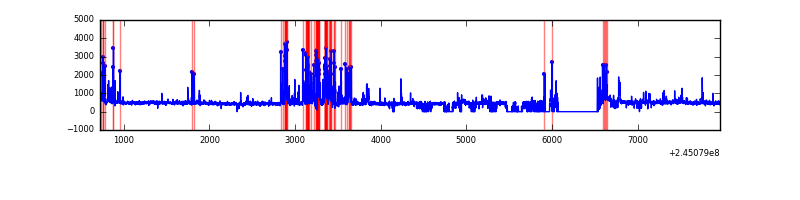 |
| C | 7240 | 6449 | 0 | 0 | 0.00% | 0.00% | 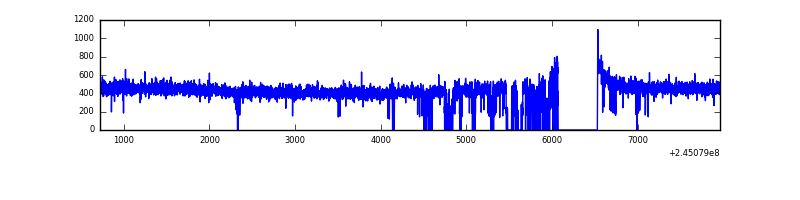 |
| D | 7240 | 6322 | 640 | 640 | 8.84% | 10.12% | 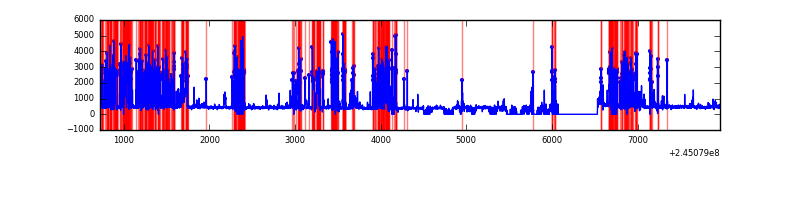 |
Top three noisy pixels from each quadrant. If the there are fewer than three noisy pixels in the level2.evt file, extra rows are filled as -1
| Pixel properties | Quadrant properties | ||||||
|---|---|---|---|---|---|---|---|
| Quadrant | DetID | PixID | Counts | Sigma | Mean | Median | Sigma |
| A | 8 | 5 | 1643547 | 11431.0 | 699 | 686 | 143.7 |
| A | 8 | 15 | 52559 | 360.93 | 699 | 686 | 143.7 |
| A | 11 | 29 | 11144 | 72.77 | 699 | 686 | 143.7 |
| B | 4 | 239 | 580611 | 4333.67 | 708 | 690 | 133.8 |
| B | 4 | 173 | 67159 | 496.71 | 708 | 690 | 133.8 |
| B | 0 | 214 | 41630 | 305.94 | 708 | 690 | 133.8 |
| C | 13 | 61 | 5194 | 27.71 | 700 | 703 | 162.1 |
| C | 8 | 222 | 2213 | 9.32 | 700 | 703 | 162.1 |
| C | 5 | 207 | 1890 | 7.32 | 700 | 703 | 162.1 |
| D | 10 | 253 | 1653862 | 10899.49 | 628 | 610 | 151.7 |
| D | 1 | 52 | 403086 | 2653.43 | 628 | 610 | 151.7 |
| D | 14 | 34 | 111376 | 730.25 | 628 | 610 | 151.7 |
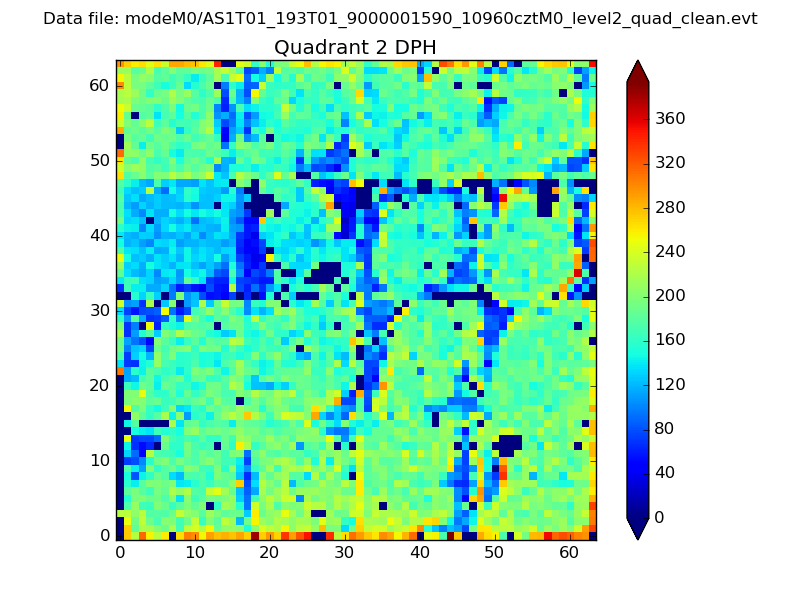
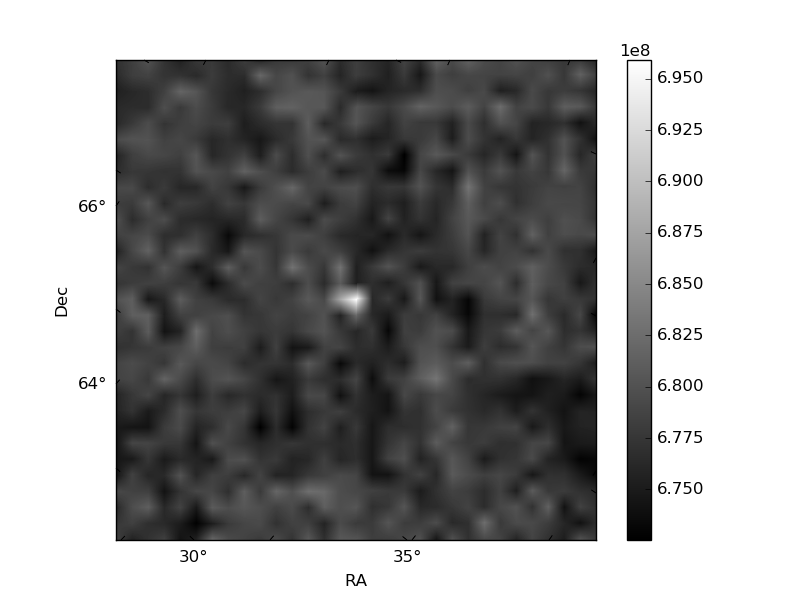
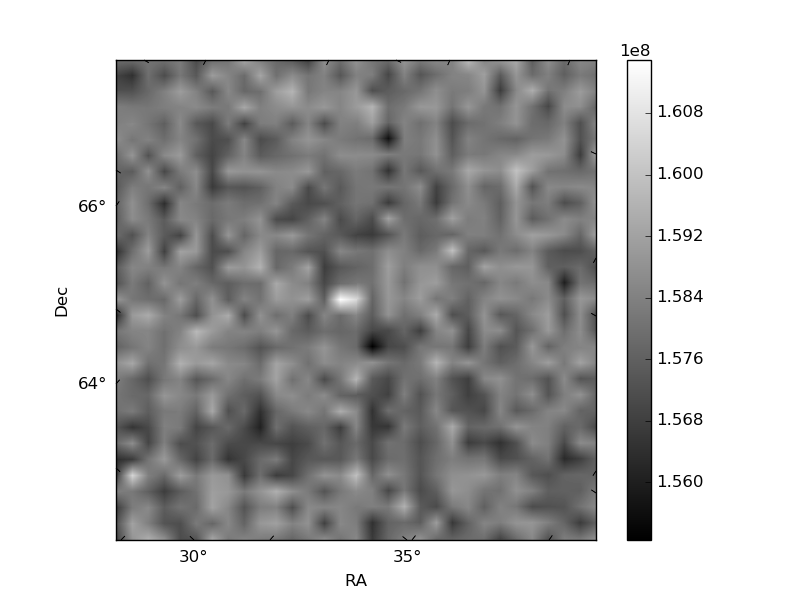
Histogram calculated using DETX and DETY for each event in the final _common_clean file
| Quadrant A | 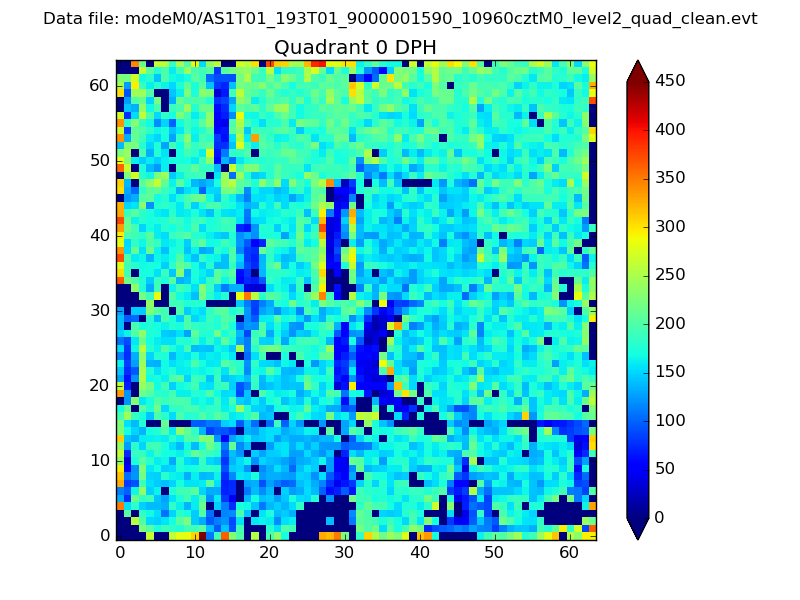 |
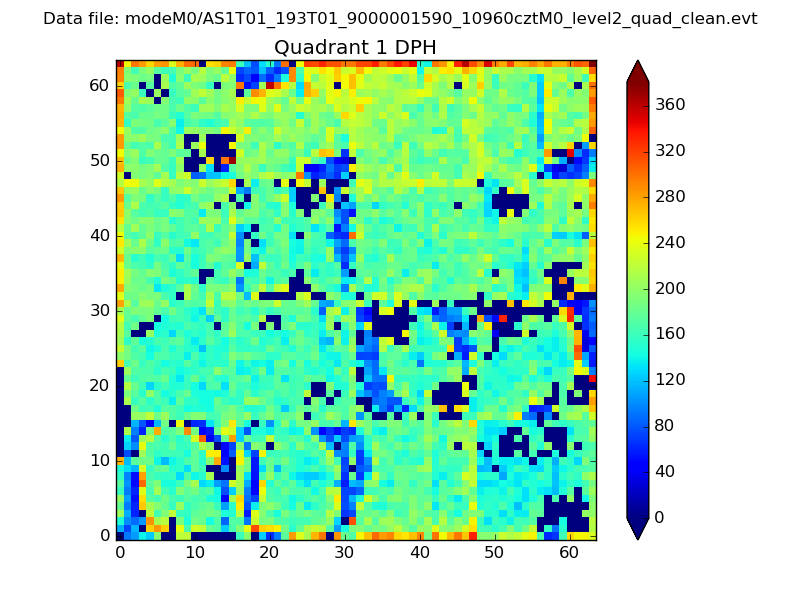 |
Quadrant B |
|---|---|---|---|
| Quadrant D | 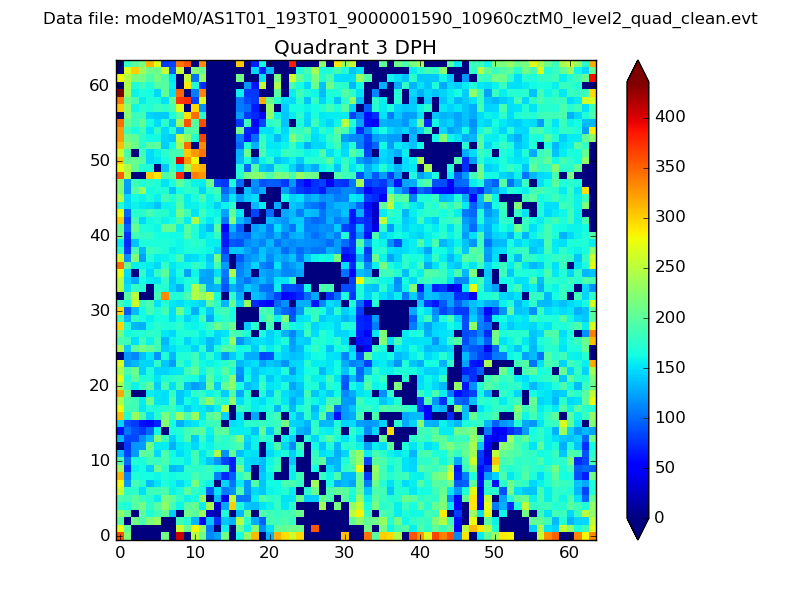 |
 |
Quadrant C |
| Plot type | Count rate plots | Images |
|---|---|---|
| Comparison with Poisson distribution Blue bars denote a histogram of data divided into 1 sec bins. Red curve is a Poisson curve with rate = median count rate of data. |
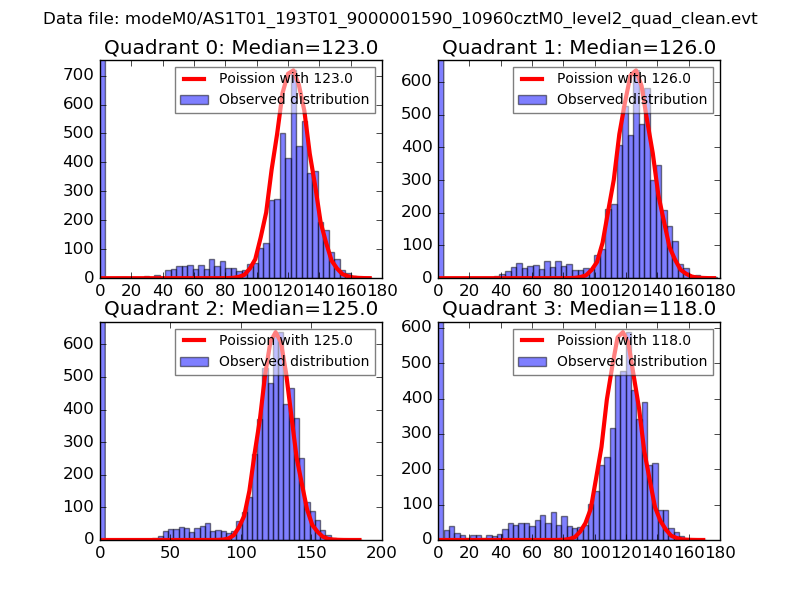 |
 |
| Quadrant-wise count rates Data is divided into 100 sec bins |
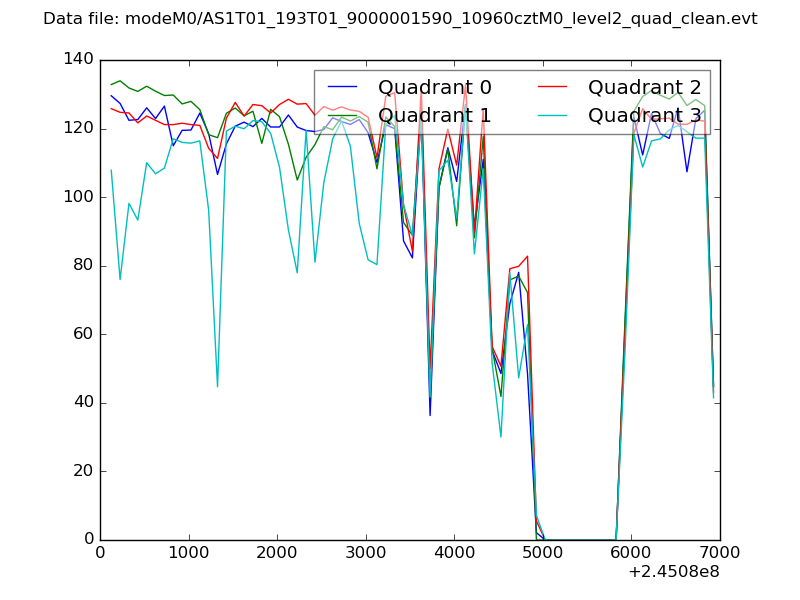 |
|
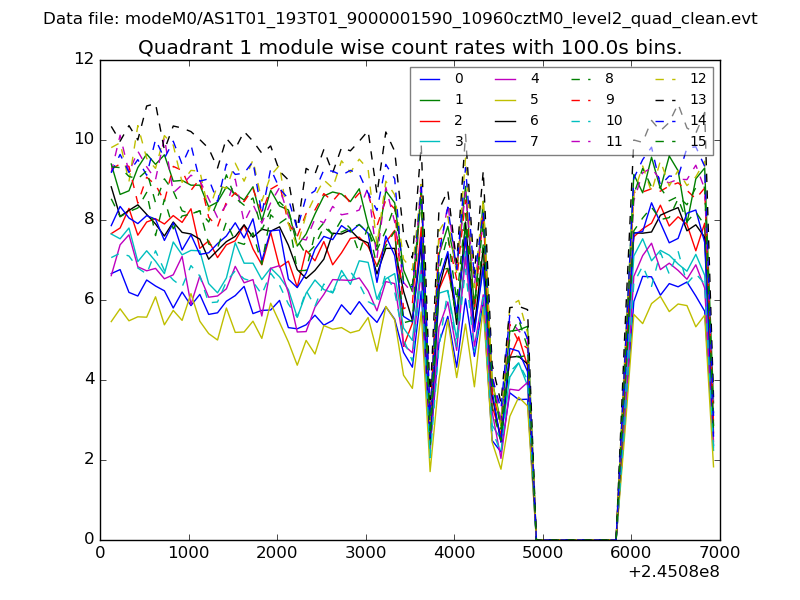
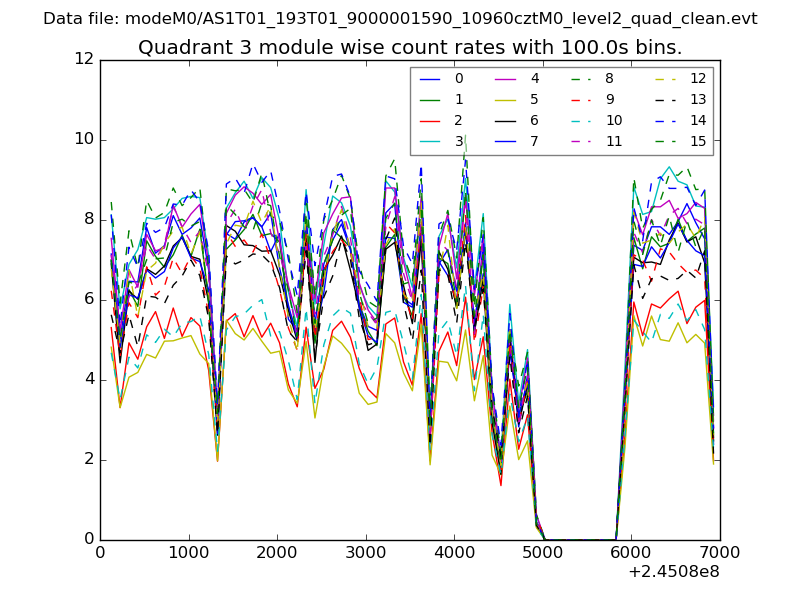
| Module-wise count rates for Quadrant A Data is divided into 100 sec bins |
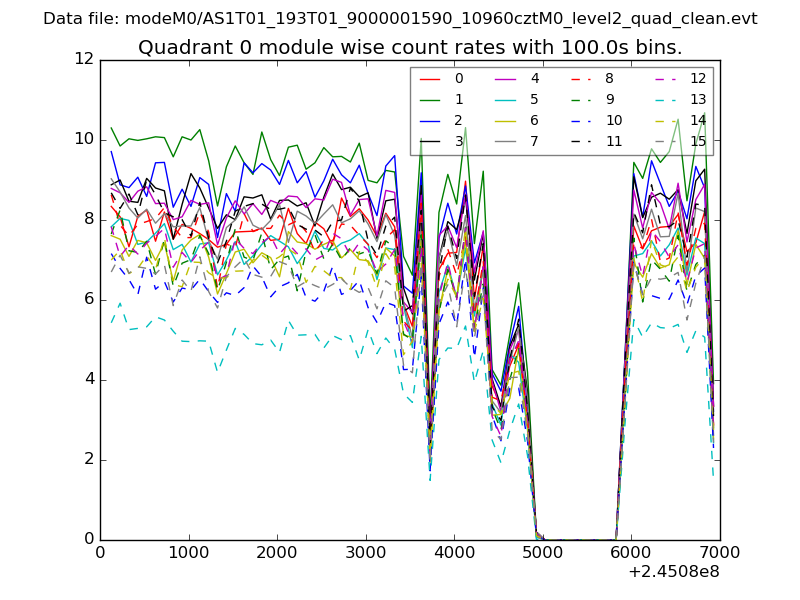 |
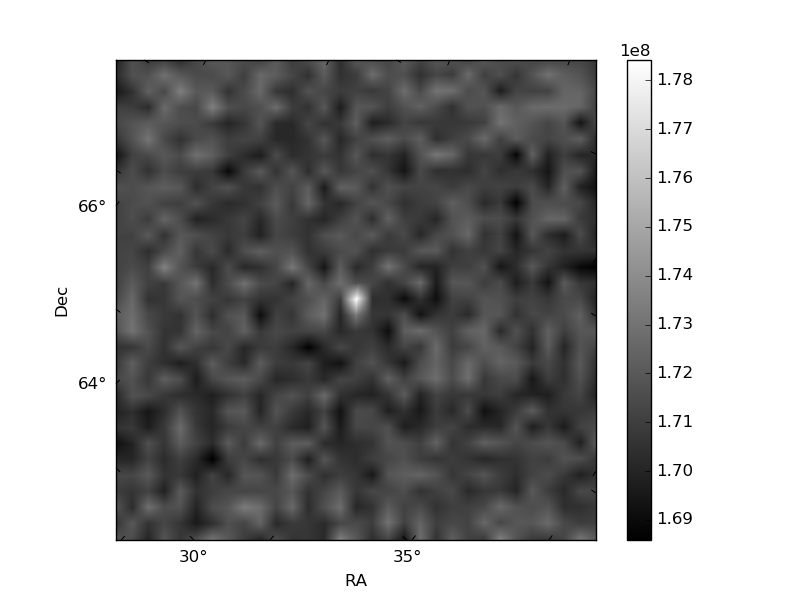 |
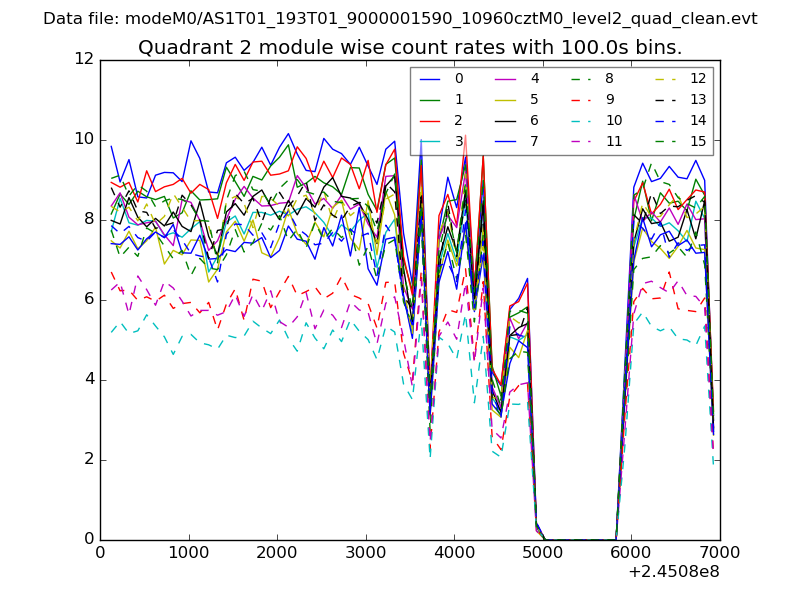
| Module-wise count rates for Quadrant B Data is divided into 100 sec bins |
 |
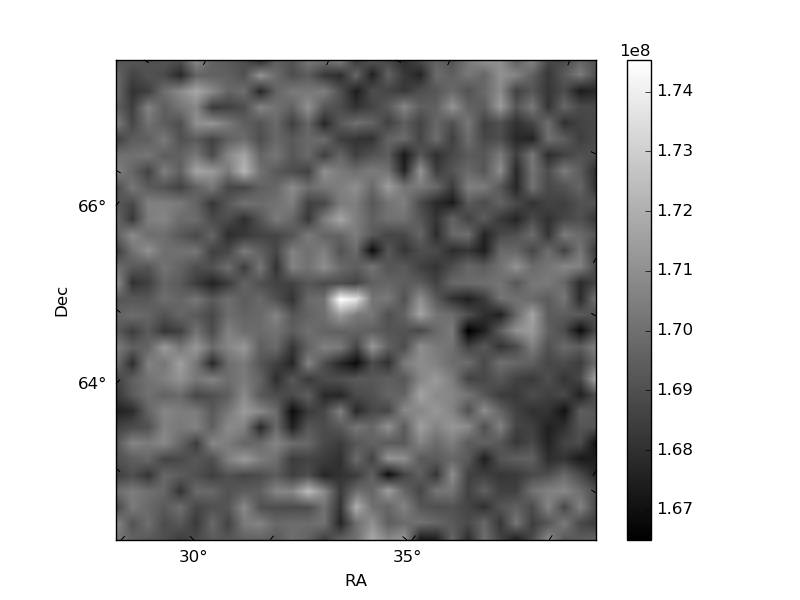 |
| Module-wise count rates for Quadrant C Data is divided into 100 sec bins |
 |
 |
| Module-wise count rates for Quadrant D Data is divided into 100 sec bins |
 |
 |
| Parameter | Plot |
|---|---|
| CZT HV Monitor | 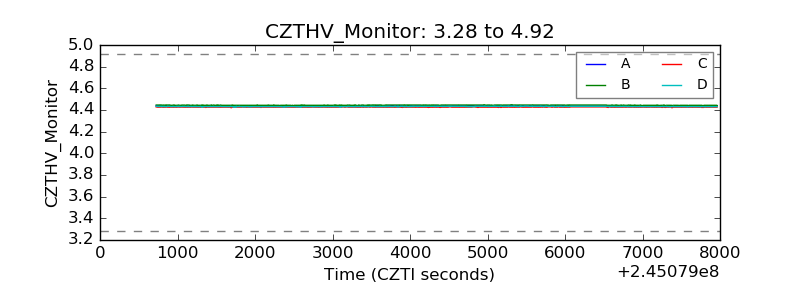 |
| D_VDD | 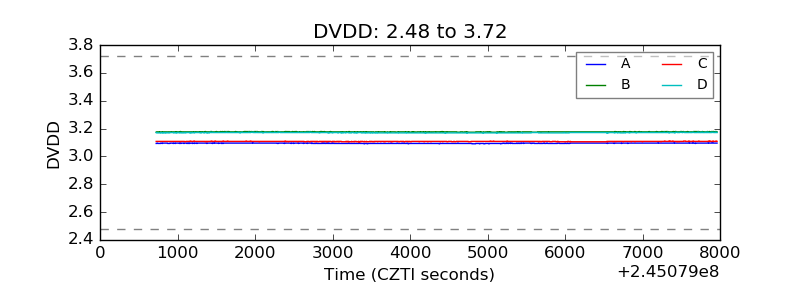 |
| Temperature 1 | 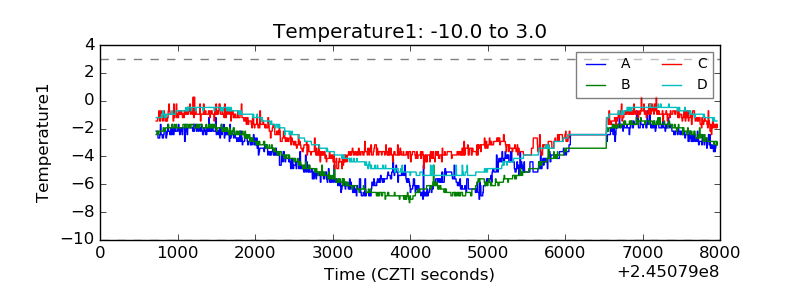 |
| Veto HV Monitor |  |
| Veto LLD | 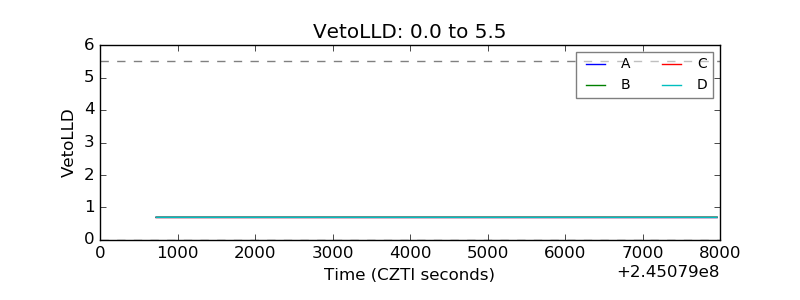 |
| Alpha Counter | 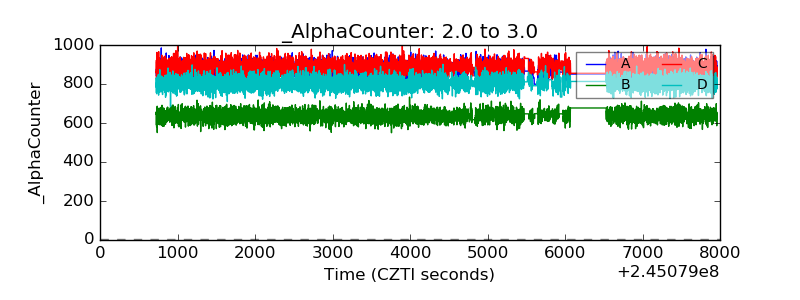 |
| _CPM_Rate | 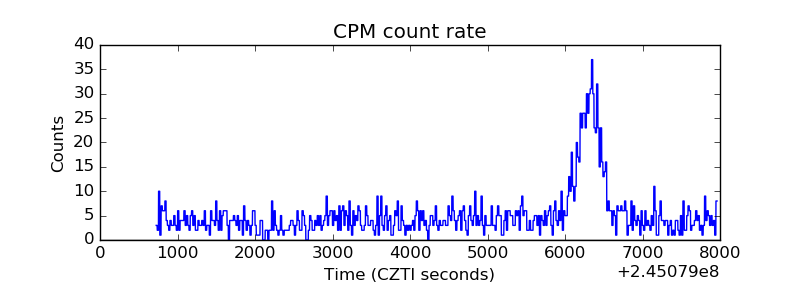 |
| CZT Counter | 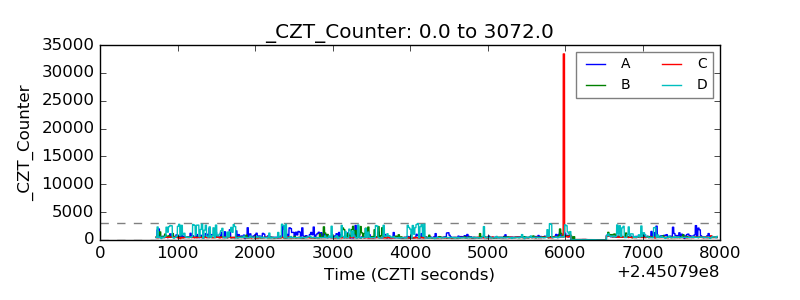 |
| +2.5 Volts monitor |  |
| +5 Volts monitor |  |
| _ROLL_ROT | 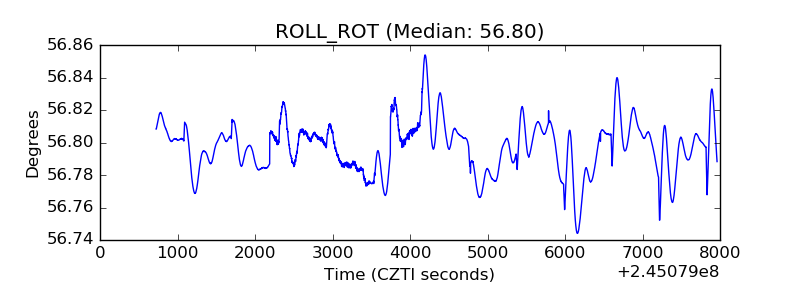 |
| _Roll_DEC | 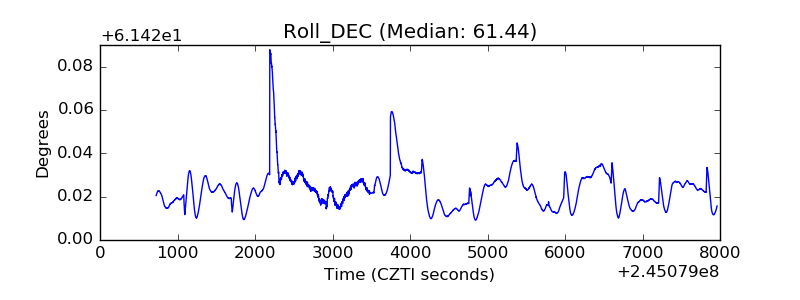 |
| _Roll_RA | 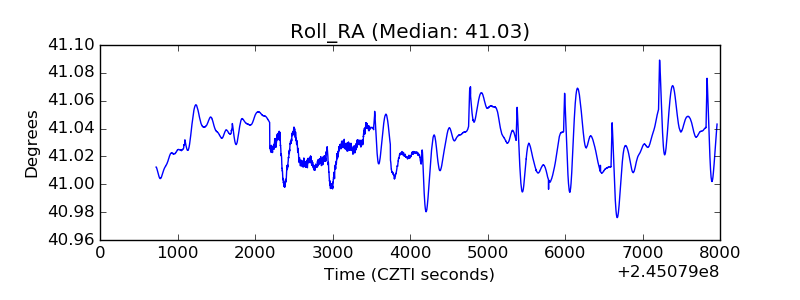 |
| Veto Counter | 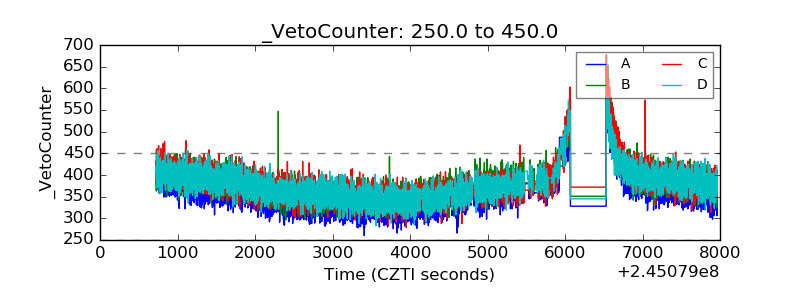 |