| Param | Original file | Final file |
|---|---|---|
| Filename | modeM0/AS1T01_193T01_9000001590_10962cztM0_level2.evt | modeM0/AS1T01_193T01_9000001590_10962cztM0_level2_quad_clean.evt |
| Size (bytes) | 593,792,640 | 114,491,520 |
| Size | 566.3 MB | 109.2 MB |
| Events in quadrant A | 4,801,979 | 737,507 |
| Events in quadrant B | 4,261,672 | 756,244 |
| Events in quadrant C | 3,194,521 | 772,143 |
| Events in quadrant D | 5,242,508 | 705,844 |
| Mode SS | |||
|---|---|---|---|
| Quadrant | BADHDUFLAG | Total packets | Discarded packets |
| A | 0 | 146 | 0 |
| B | 0 | 146 | 0 |
| C | 0 | 146 | 0 |
| D | 0 | 146 | 0 |
| Mode M0 | |||
|---|---|---|---|
| Quadrant | BADHDUFLAG | Total packets | Discarded packets |
| A | 0 | 19154 | 7 |
| B | 0 | 17471 | 13 |
| C | 0 | 14529 | 6 |
| D | 0 | 20679 | 4 |
| Mode M9 | |||
|---|---|---|---|
| Quadrant | BADHDUFLAG | Total packets | Discarded packets |
| A | 0 | 2 | 0 |
| B | 0 | 2 | 0 |
| C | 0 | 2 | 0 |
| D | 0 | 2 | 0 |
| Quadrant | Total seconds | Saturated seconds | Saturation percentage |
|---|---|---|---|
| A | 7110 | 306 | 4.303797% |
| B | 7109 | 265 | 3.727669% |
| C | 7110 | 42 | 0.590717% |
| D | 7111 | 657 | 9.239207% |
Noise dominated data is calculated using 1-second bins in cleaned event files. If a bin has >2000 counts, and if more than 50% of those come from <1% of pixels, then it is considered to be noise-dominated and hence unusable.
| Quadrant | # 1 sec bins | Bins with >0 counts | Bins with >2000 counts | High rate bins dominated by noise | Noise dominated (total time) | Noise dominated (detector-on time) | Marked lightcurve |
|---|---|---|---|---|---|---|---|
| A | 7347 | 7114 | 136 | 136 | 1.85% | 1.91% | 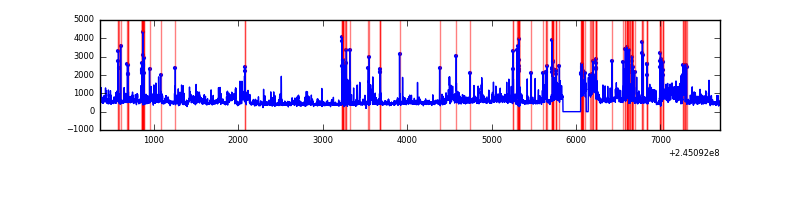 |
| B | 7347 | 7114 | 131 | 131 | 1.78% | 1.84% | 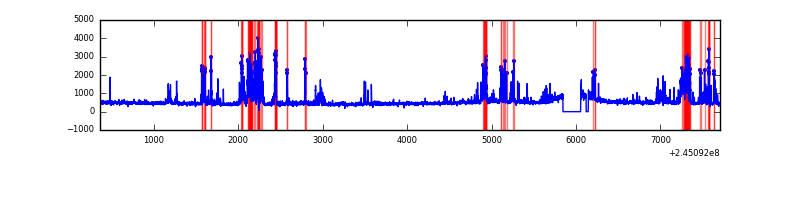 |
| C | 7347 | 7114 | 0 | 0 | 0.00% | 0.00% | 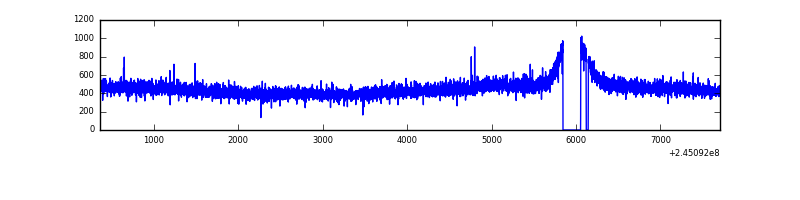 |
| D | 7346 | 7113 | 496 | 496 | 6.75% | 6.97% | 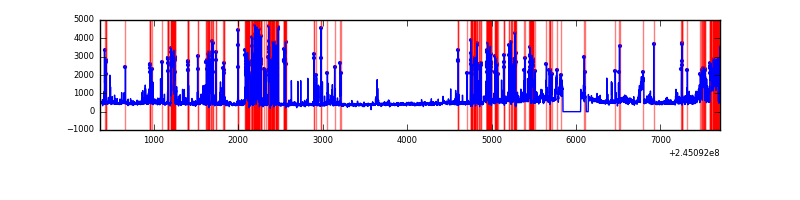 |
Top three noisy pixels from each quadrant. If the there are fewer than three noisy pixels in the level2.evt file, extra rows are filled as -1
| Pixel properties | Quadrant properties | ||||||
|---|---|---|---|---|---|---|---|
| Quadrant | DetID | PixID | Counts | Sigma | Mean | Median | Sigma |
| A | 8 | 5 | 1643094 | 9818.43 | 811 | 796 | 167.3 |
| A | 14 | 238 | 16352 | 93.0 | 811 | 796 | 167.3 |
| A | 8 | 6 | 8459 | 45.81 | 811 | 796 | 167.3 |
| B | 4 | 239 | 877861 | 5552.81 | 824 | 804 | 157.9 |
| B | 0 | 214 | 37652 | 233.29 | 824 | 804 | 157.9 |
| B | 0 | 228 | 29364 | 180.82 | 824 | 804 | 157.9 |
| C | 8 | 128 | 8840 | 42.51 | 814 | 818 | 188.7 |
| C | 13 | 61 | 6078 | 27.88 | 814 | 818 | 188.7 |
| C | 8 | 112 | 5908 | 26.98 | 814 | 818 | 188.7 |
| D | 10 | 253 | 1230048 | 6524.14 | 775 | 753 | 188.4 |
| D | 1 | 52 | 689273 | 3654.13 | 775 | 753 | 188.4 |
| D | 14 | 34 | 139415 | 735.91 | 775 | 753 | 188.4 |
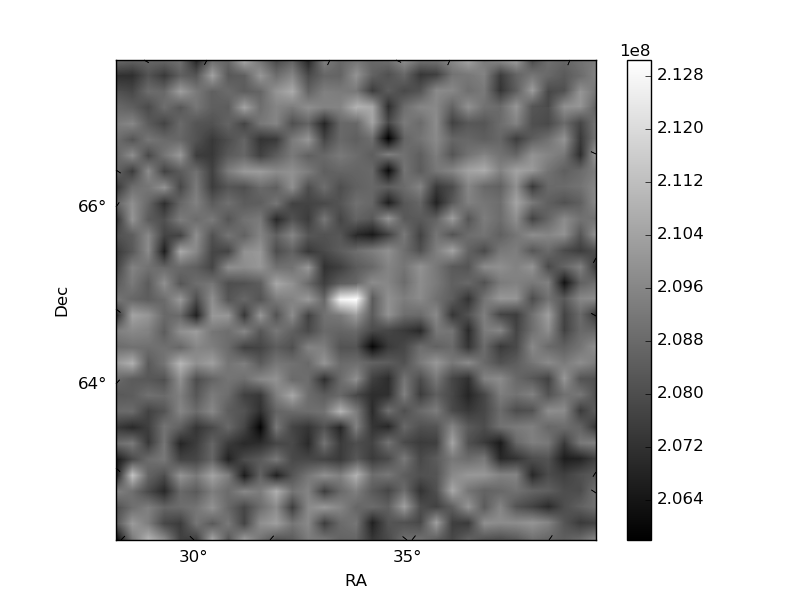
Histogram calculated using DETX and DETY for each event in the final _common_clean file
| Quadrant A | 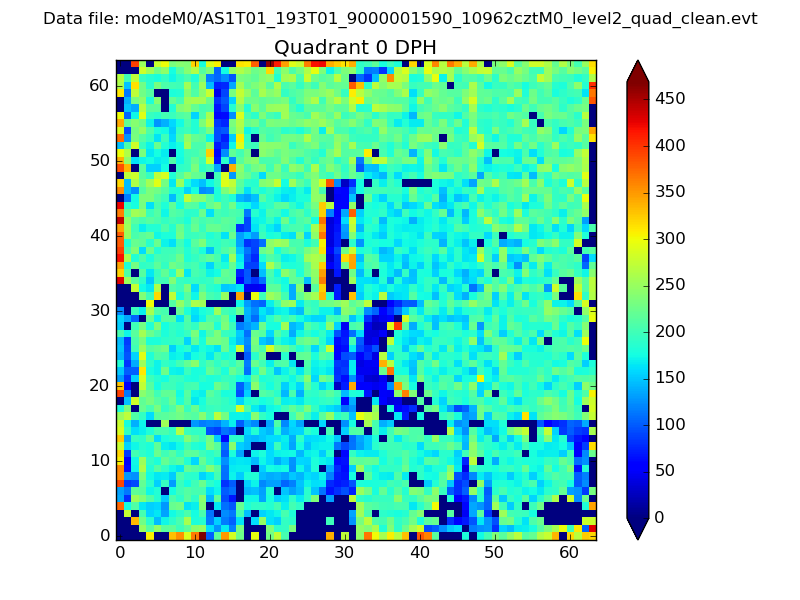 |
 |
Quadrant B |
|---|---|---|---|
| Quadrant D |  |
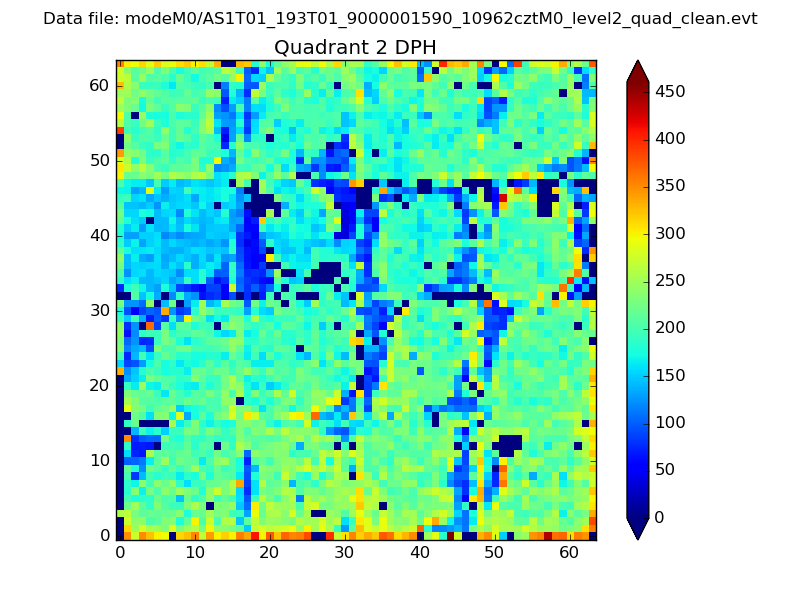 |
Quadrant C |
| Plot type | Count rate plots | Images |
|---|---|---|
| Comparison with Poisson distribution Blue bars denote a histogram of data divided into 1 sec bins. Red curve is a Poisson curve with rate = median count rate of data. |
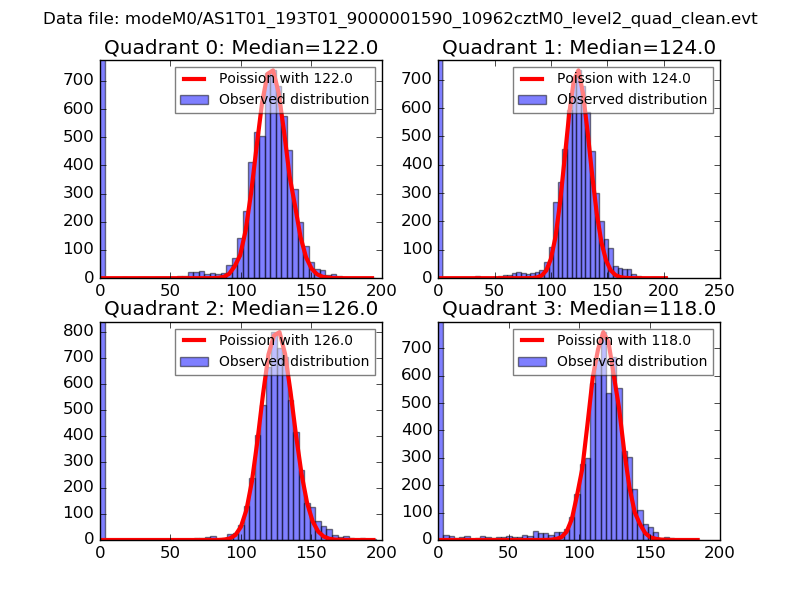 |
 |
| Quadrant-wise count rates Data is divided into 100 sec bins |
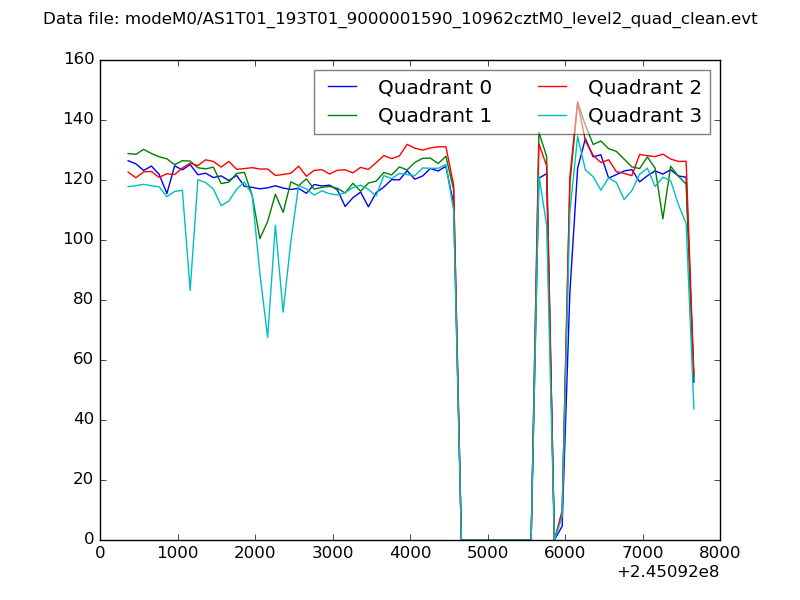 |
|
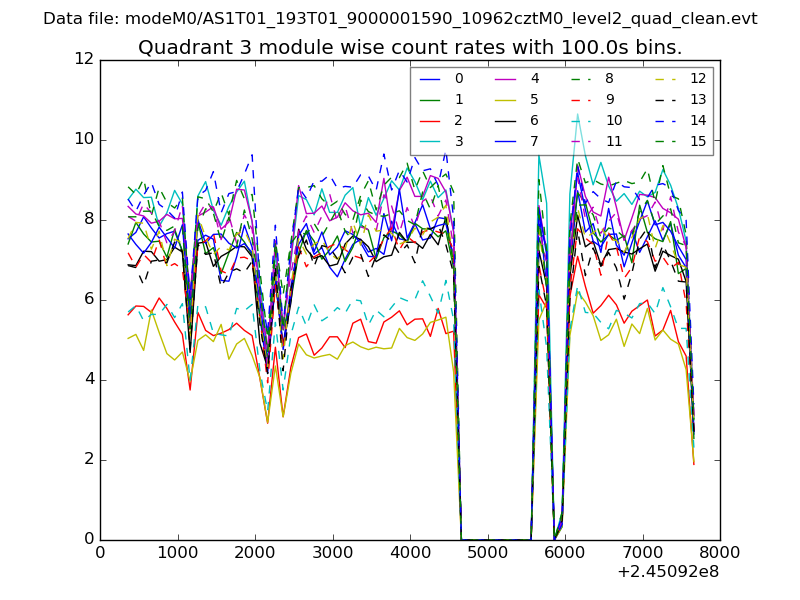
| Module-wise count rates for Quadrant A Data is divided into 100 sec bins |
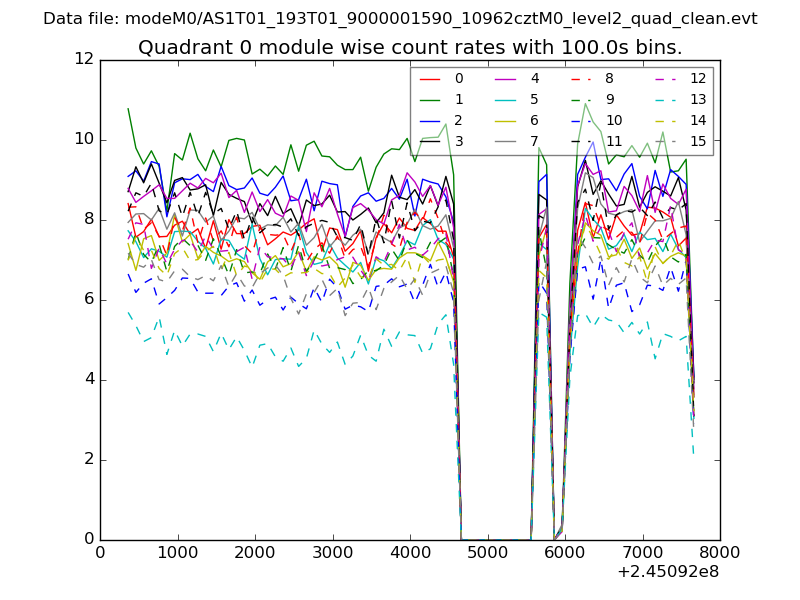 |
 |
| Module-wise count rates for Quadrant B Data is divided into 100 sec bins |
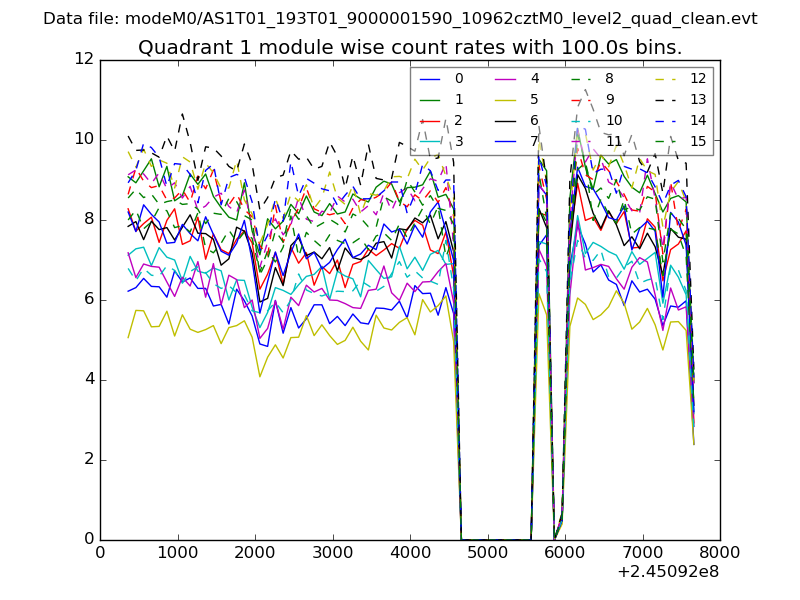 |
 |
| Module-wise count rates for Quadrant C Data is divided into 100 sec bins |
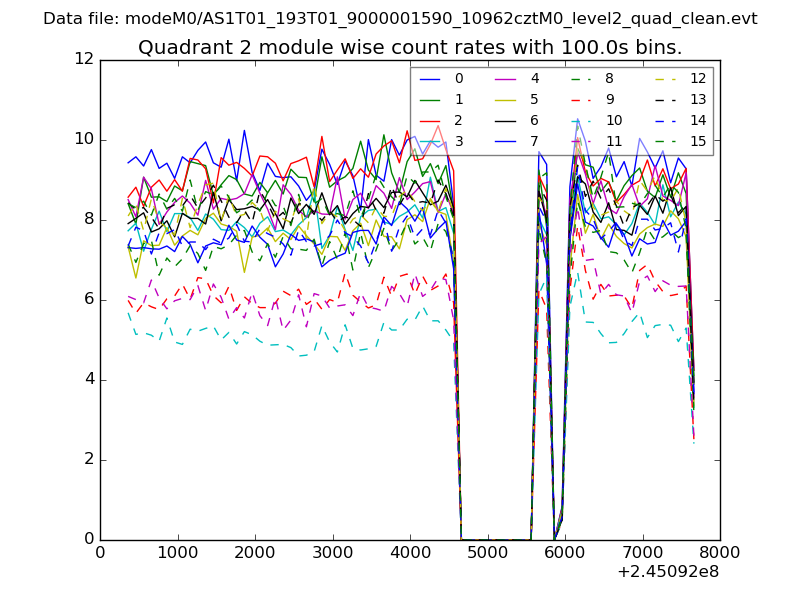 |
 |
| Module-wise count rates for Quadrant D Data is divided into 100 sec bins |
 |
 |
| Parameter | Plot |
|---|---|
| CZT HV Monitor |  |
| D_VDD |  |
| Temperature 1 | 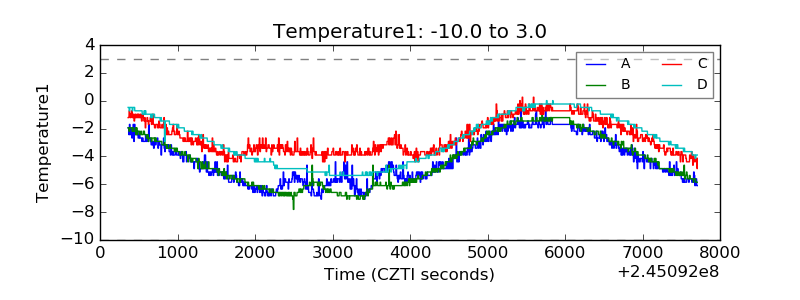 |
| Veto HV Monitor | 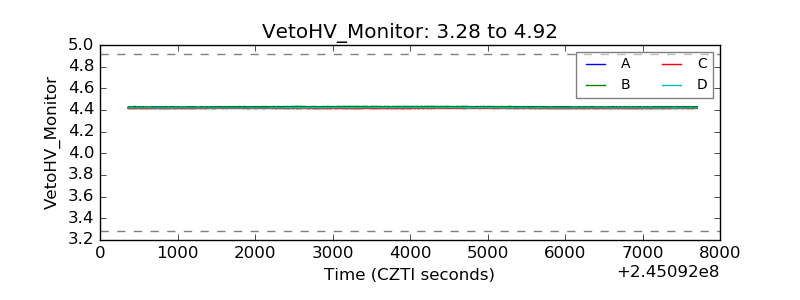 |
| Veto LLD | 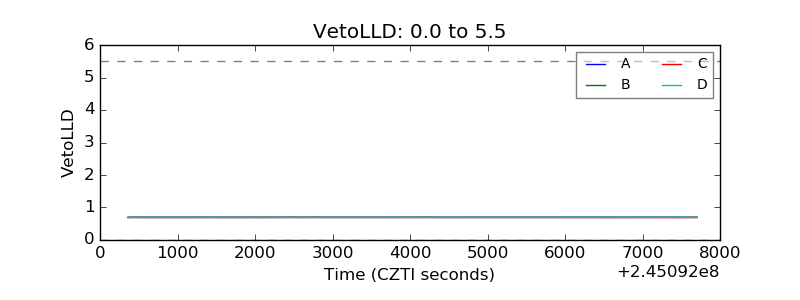 |
| Alpha Counter | 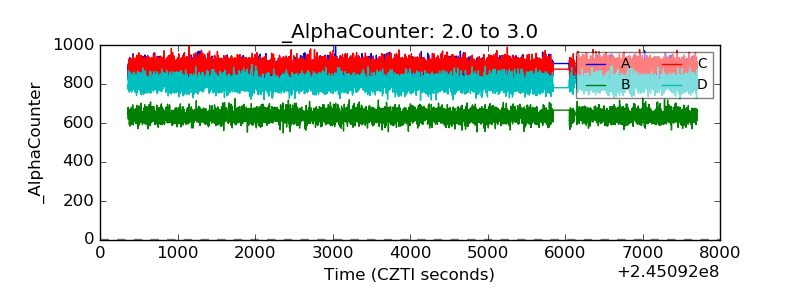 |
| _CPM_Rate | 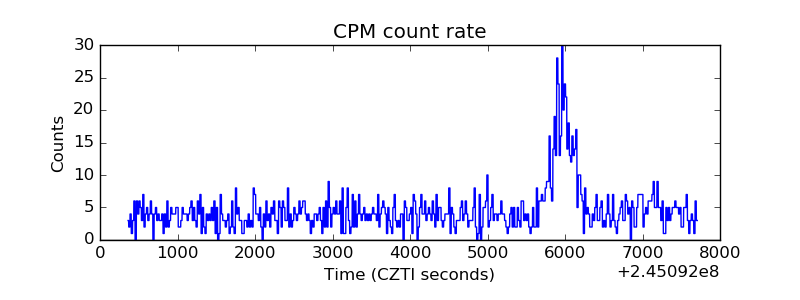 |
| CZT Counter | 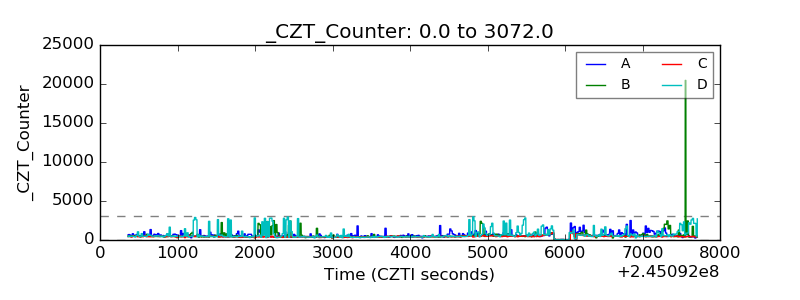 |
| +2.5 Volts monitor |  |
| +5 Volts monitor | 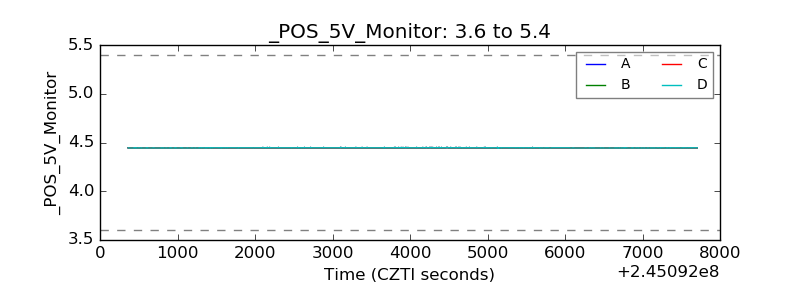 |
| _ROLL_ROT | 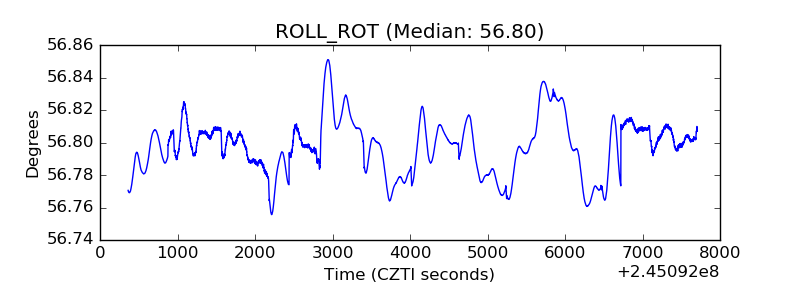 |
| _Roll_DEC | 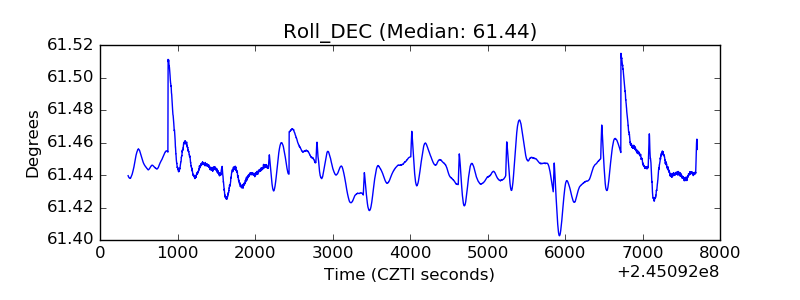 |
| _Roll_RA |  |
| Veto Counter | 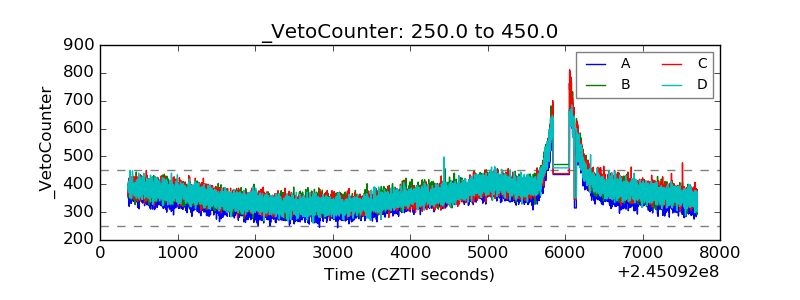 |