| Param | Original file | Final file |
|---|---|---|
| Filename | modeM0/AS1T01_193T01_9000001590_10965cztM0_level2.evt | modeM0/AS1T01_193T01_9000001590_10965cztM0_level2_quad_clean.evt |
| Size (bytes) | 1,466,798,400 | 286,375,680 |
| Size | 1.4 GB | 273.1 MB |
| Events in quadrant A | 12,002,775 | 1,816,318 |
| Events in quadrant B | 11,042,225 | 1,874,075 |
| Events in quadrant C | 8,000,071 | 1,931,565 |
| Events in quadrant D | 12,141,836 | 1,790,708 |
| Mode SS | |||
|---|---|---|---|
| Quadrant | BADHDUFLAG | Total packets | Discarded packets |
| A | 0 | 372 | 0 |
| B | 0 | 372 | 0 |
| C | 0 | 372 | 2 |
| D | 0 | 372 | 0 |
| Mode M0 | |||
|---|---|---|---|
| Quadrant | BADHDUFLAG | Total packets | Discarded packets |
| A | 0 | 48191 | 55 |
| B | 0 | 45288 | 49 |
| C | 0 | 37103 | 31 |
| D | 0 | 49082 | 29 |
| Mode M9 | |||
|---|---|---|---|
| Quadrant | BADHDUFLAG | Total packets | Discarded packets |
| A | 0 | 20 | 0 |
| B | 0 | 20 | 0 |
| C | 0 | 20 | 0 |
| D | 0 | 20 | 0 |
| Quadrant | Total seconds | Saturated seconds | Saturation percentage |
|---|---|---|---|
| A | 18297 | 1005 | 5.492704% |
| B | 18297 | 722 | 3.946002% |
| C | 18298 | 48 | 0.262324% |
| D | 18302 | 824 | 4.502240% |
Noise dominated data is calculated using 1-second bins in cleaned event files. If a bin has >2000 counts, and if more than 50% of those come from <1% of pixels, then it is considered to be noise-dominated and hence unusable.
| Quadrant | # 1 sec bins | Bins with >0 counts | Bins with >2000 counts | High rate bins dominated by noise | Noise dominated (total time) | Noise dominated (detector-on time) | Marked lightcurve |
|---|---|---|---|---|---|---|---|
| A | 20296 | 18312 | 751 | 751 | 3.70% | 4.10% | 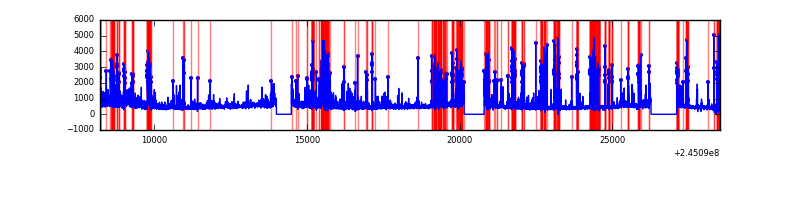 |
| B | 20297 | 18315 | 422 | 422 | 2.08% | 2.30% | 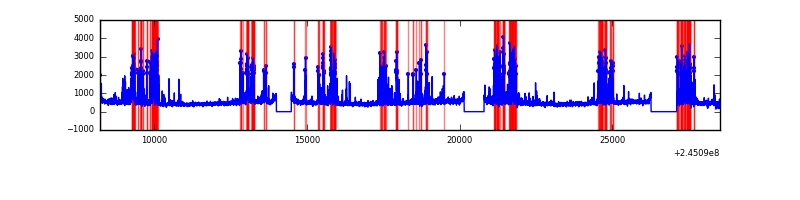 |
| C | 20297 | 18314 | 1 | 1 | 0.00% | 0.01% | 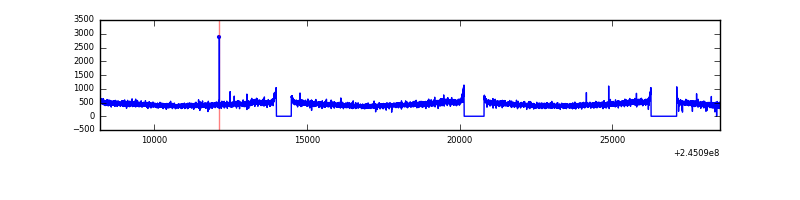 |
| D | 20297 | 18315 | 779 | 779 | 3.84% | 4.25% | 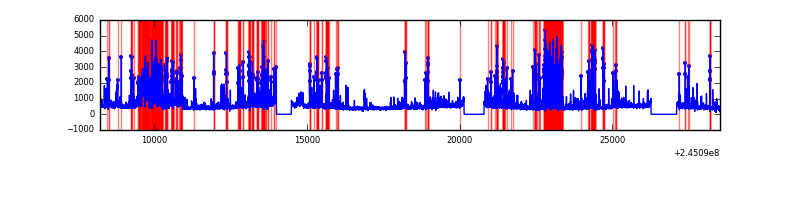 |
Top three noisy pixels from each quadrant. If the there are fewer than three noisy pixels in the level2.evt file, extra rows are filled as -1
| Pixel properties | Quadrant properties | ||||||
|---|---|---|---|---|---|---|---|
| Quadrant | DetID | PixID | Counts | Sigma | Mean | Median | Sigma |
| A | 8 | 5 | 4073270 | 9887.72 | 2032 | 1992 | 411.8 |
| A | 8 | 15 | 38960 | 89.78 | 2032 | 1992 | 411.8 |
| A | 8 | 6 | 19731 | 43.08 | 2032 | 1992 | 411.8 |
| B | 4 | 239 | 2464812 | 6239.29 | 2078 | 2027 | 394.7 |
| B | 0 | 214 | 148363 | 370.73 | 2078 | 2027 | 394.7 |
| B | 0 | 187 | 80052 | 197.67 | 2078 | 2027 | 394.7 |
| C | 13 | 61 | 15247 | 28.02 | 2050 | 2066 | 470.5 |
| C | 14 | 234 | 6241 | 8.87 | 2050 | 2066 | 470.5 |
| C | 8 | 222 | 5993 | 8.35 | 2050 | 2066 | 470.5 |
| D | 1 | 52 | 2921280 | 6044.39 | 2006 | 1952 | 483.0 |
| D | 5 | 222 | 622357 | 1284.53 | 2006 | 1952 | 483.0 |
| D | 10 | 253 | 298496 | 613.99 | 2006 | 1952 | 483.0 |
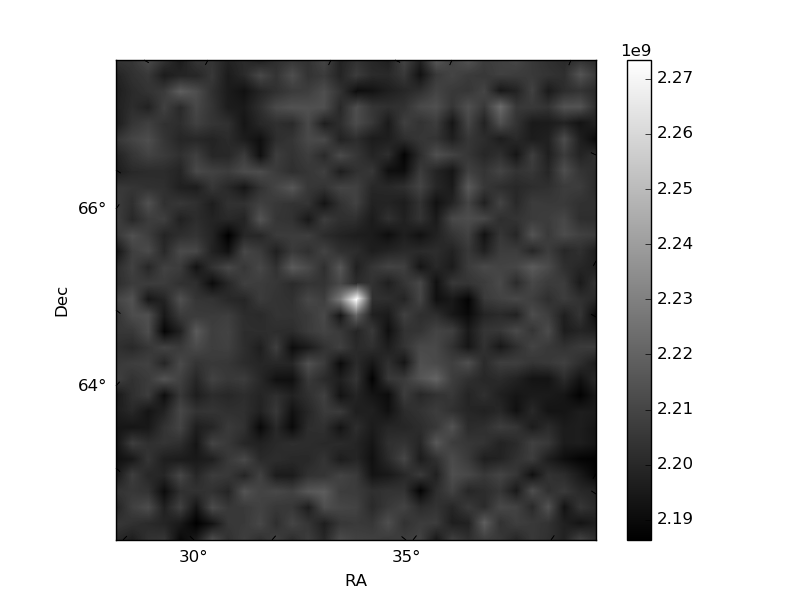
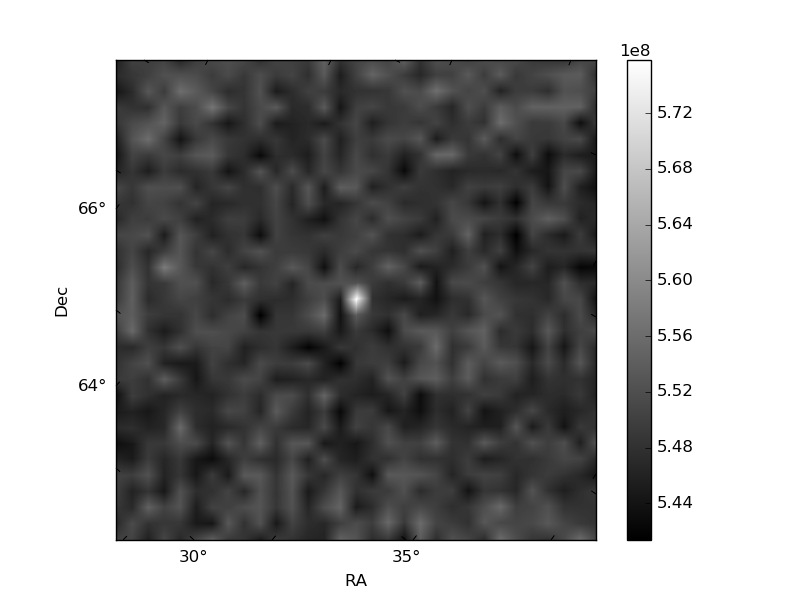
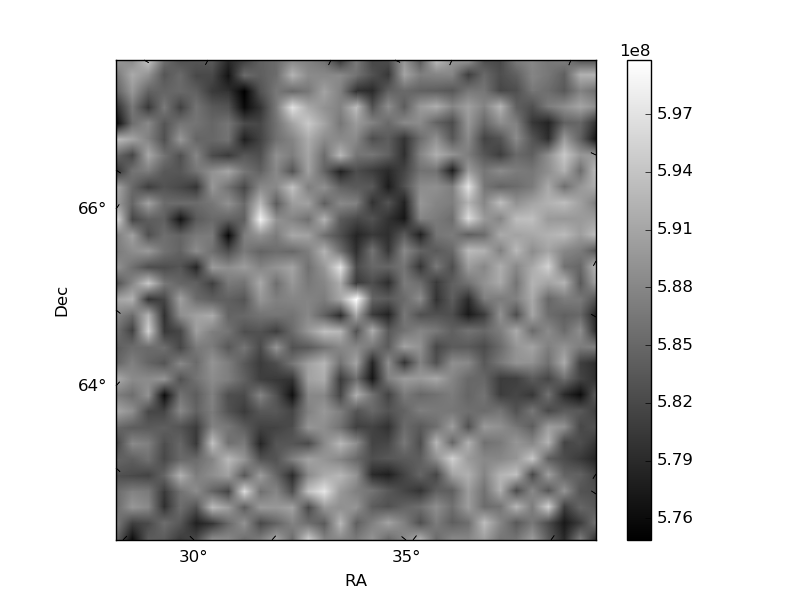
Histogram calculated using DETX and DETY for each event in the final _common_clean file
| Quadrant A | 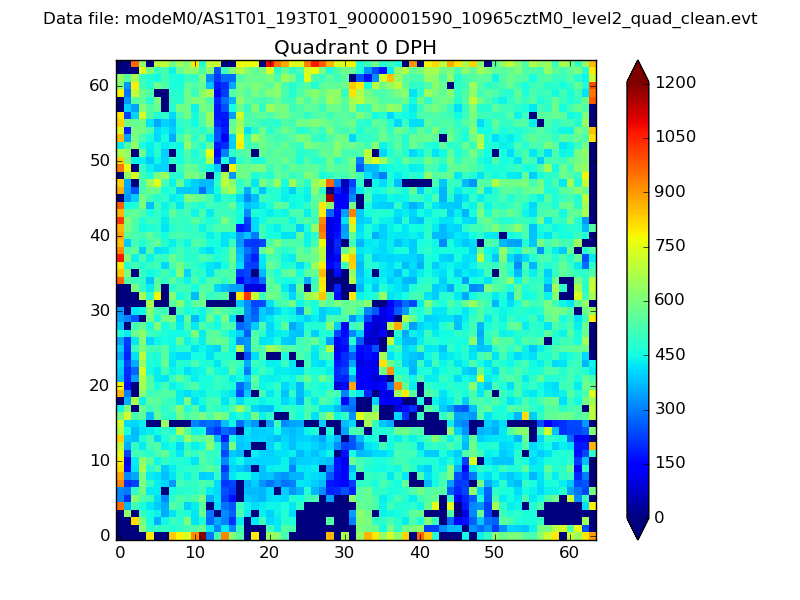 |
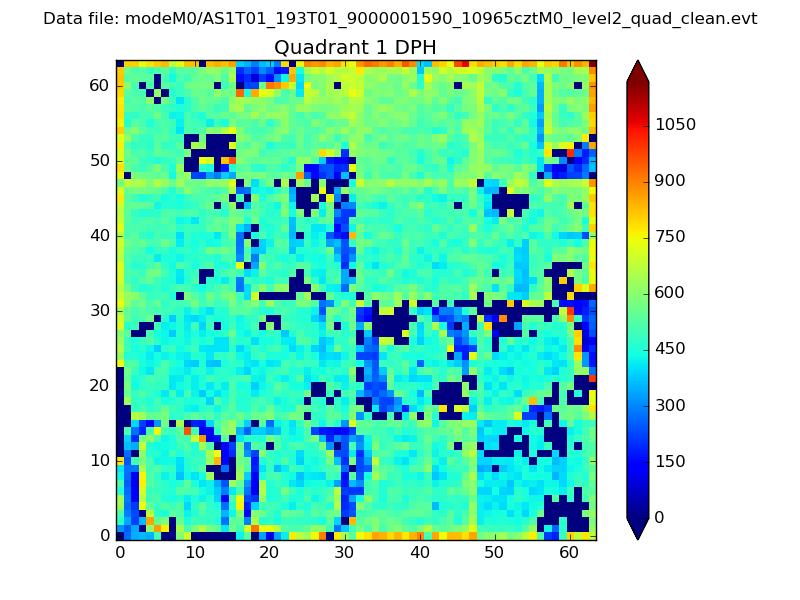 |
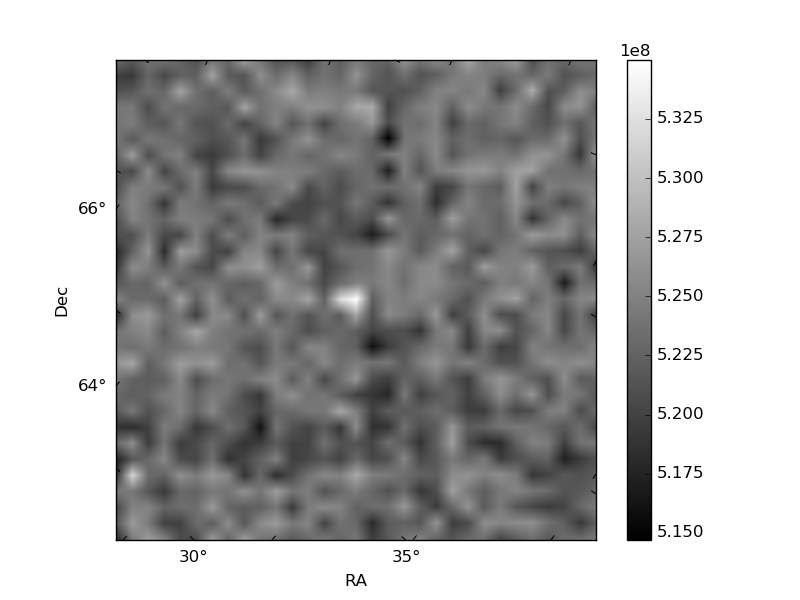
Quadrant B |
|---|---|---|---|
| Quadrant D | 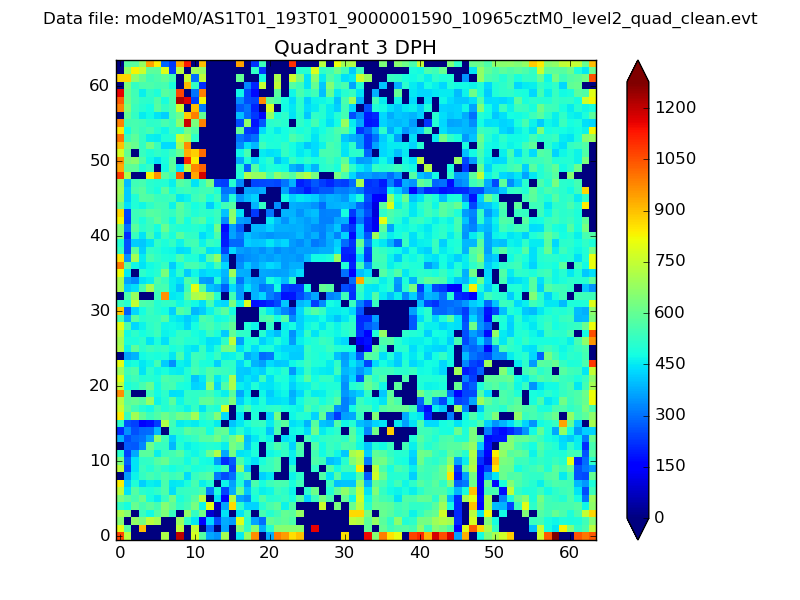 |
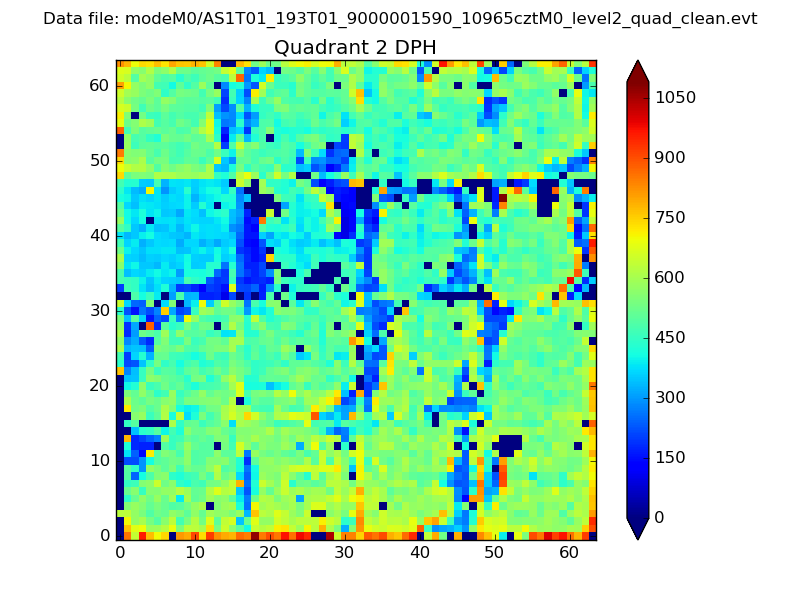 |
Quadrant C |
| Plot type | Count rate plots | Images |
|---|---|---|
| Comparison with Poisson distribution Blue bars denote a histogram of data divided into 1 sec bins. Red curve is a Poisson curve with rate = median count rate of data. |
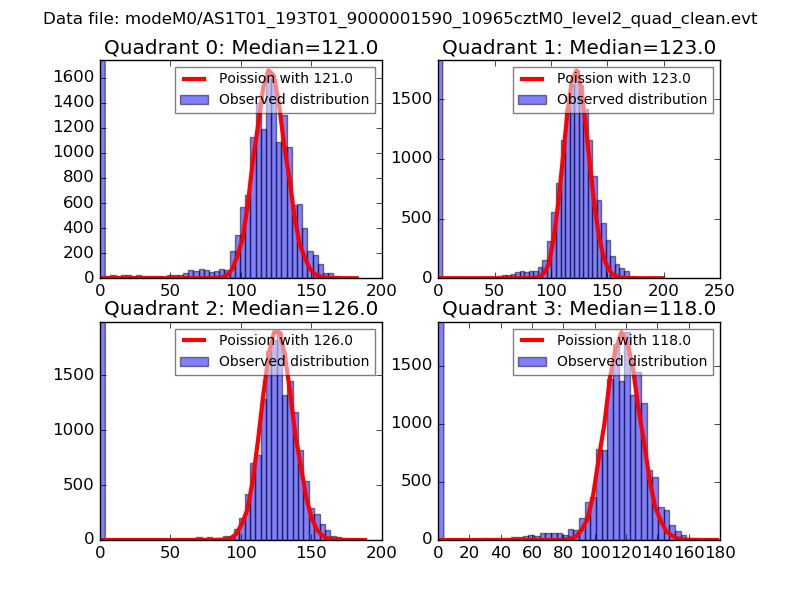 |
 |
| Quadrant-wise count rates Data is divided into 100 sec bins |
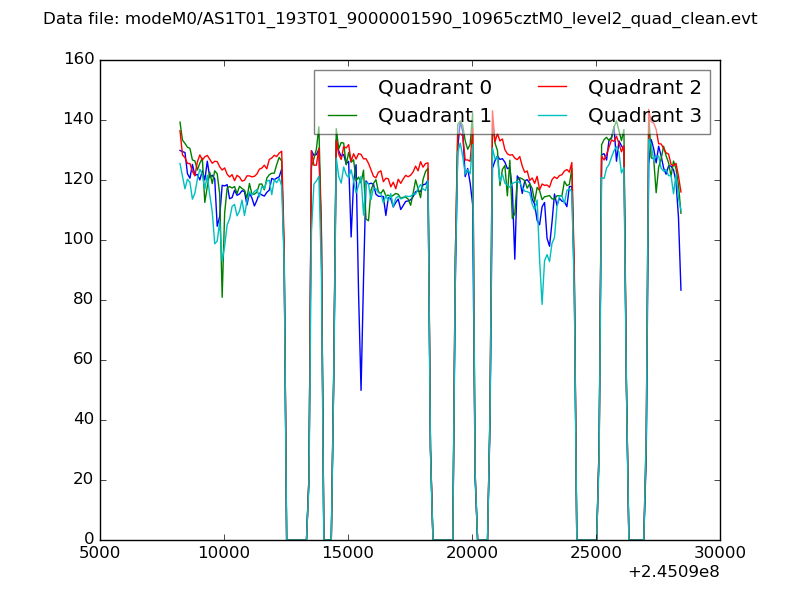 |
|
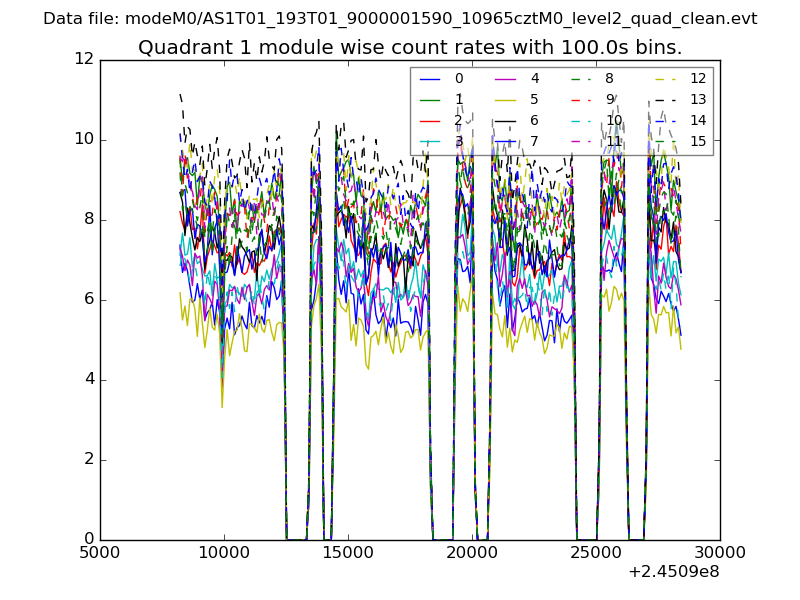
| Module-wise count rates for Quadrant A Data is divided into 100 sec bins |
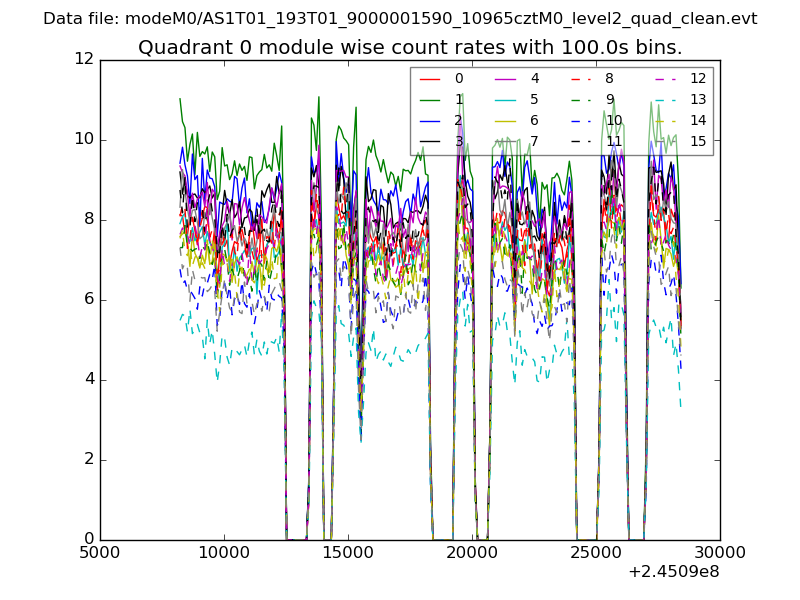 |
 |
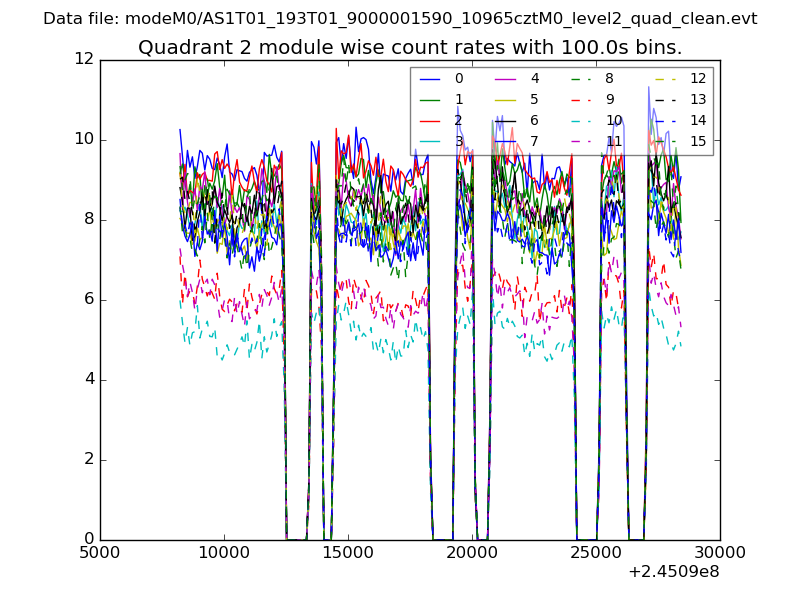
| Module-wise count rates for Quadrant B Data is divided into 100 sec bins |
 |
 |
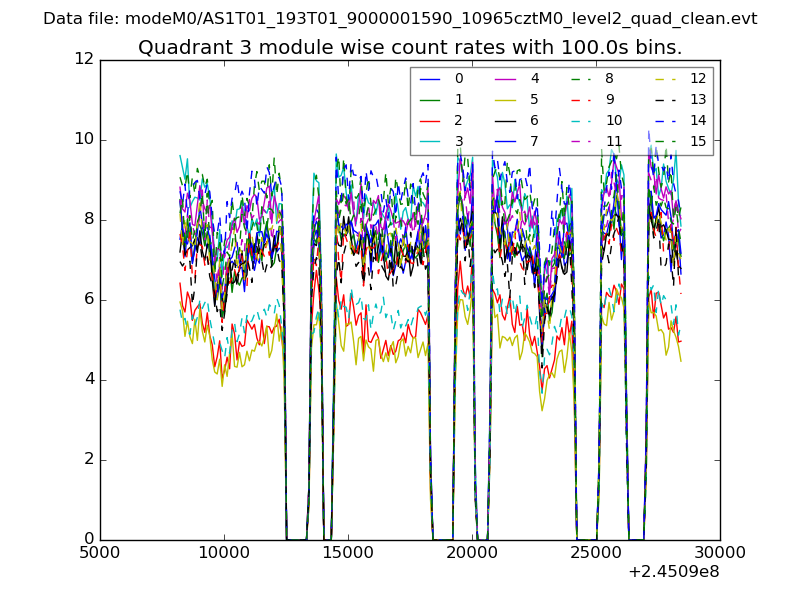
| Module-wise count rates for Quadrant C Data is divided into 100 sec bins |
 |
 |
| Module-wise count rates for Quadrant D Data is divided into 100 sec bins |
 |
 |
| Parameter | Plot |
|---|---|
| CZT HV Monitor | 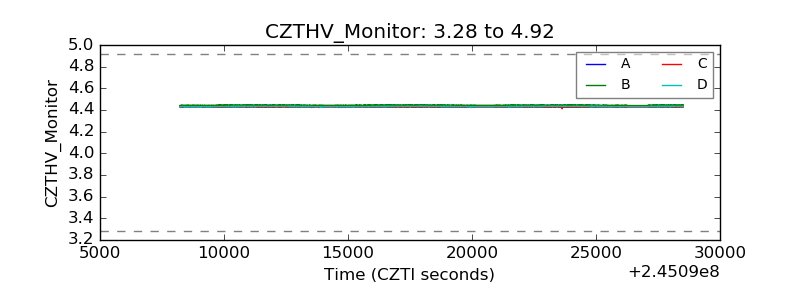 |
| D_VDD | 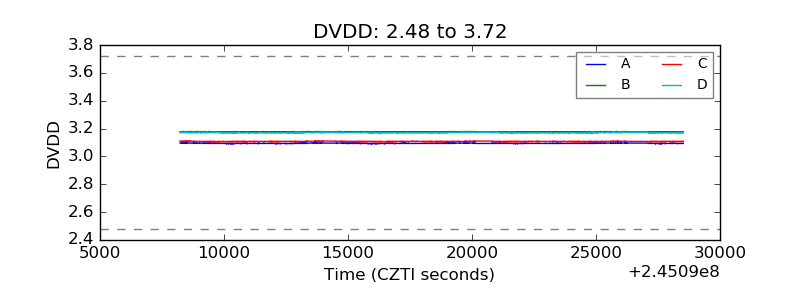 |
| Temperature 1 | 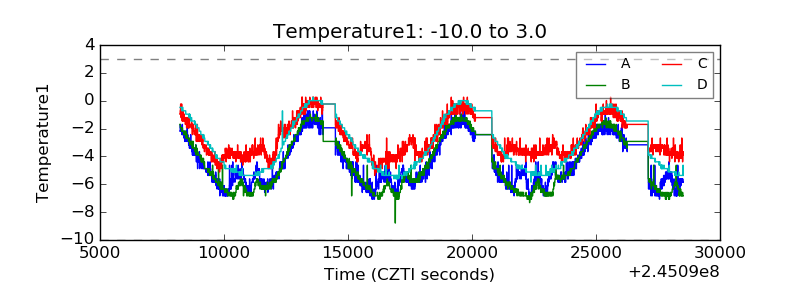 |
| Veto HV Monitor | 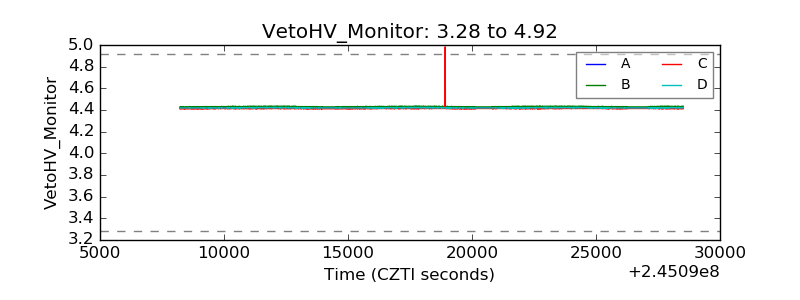 |
| Veto LLD | 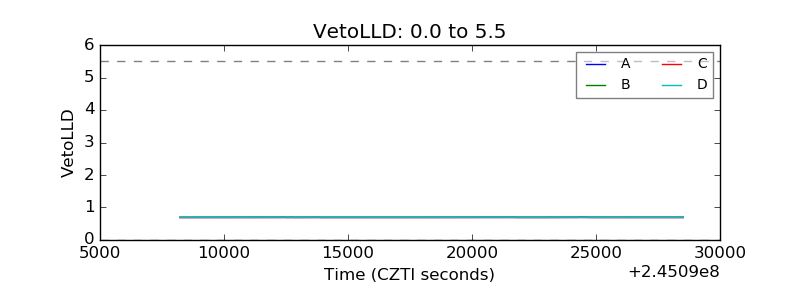 |
| Alpha Counter | 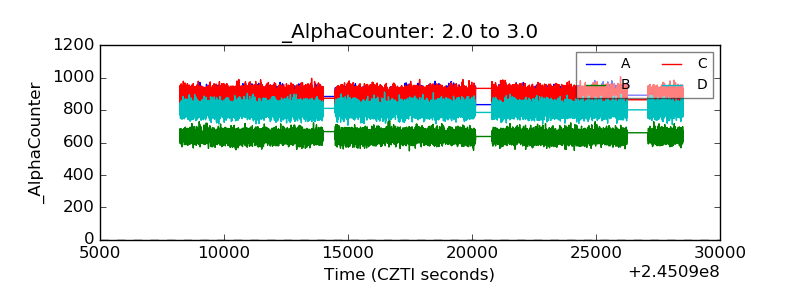 |
| _CPM_Rate | 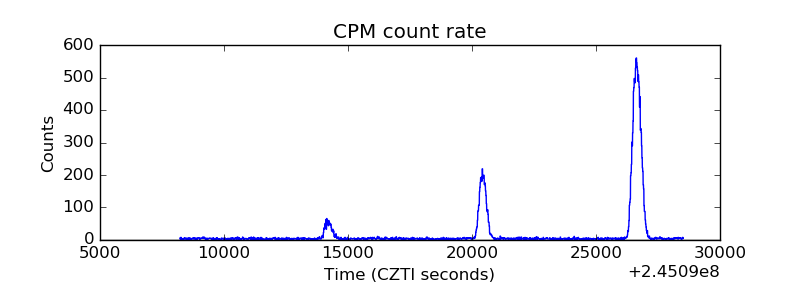 |
| CZT Counter | 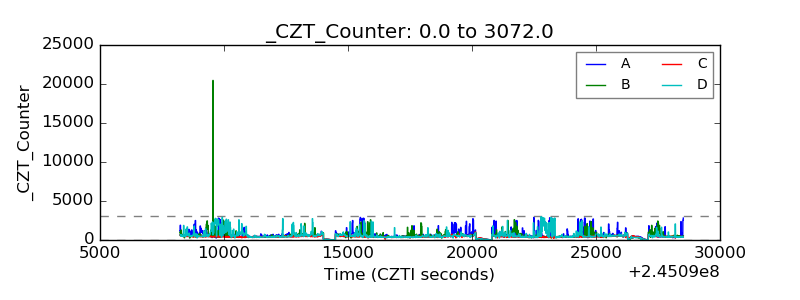 |
| +2.5 Volts monitor |  |
| +5 Volts monitor |  |
| _ROLL_ROT | 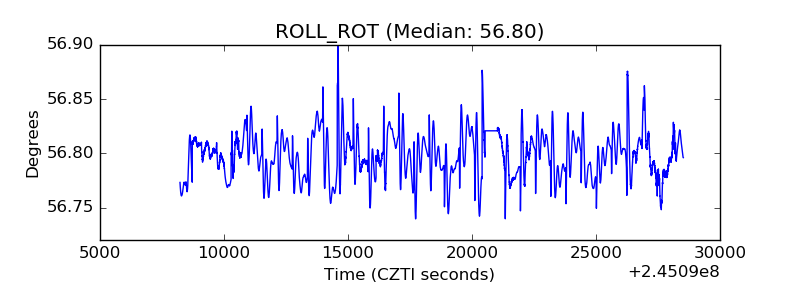 |
| _Roll_DEC | 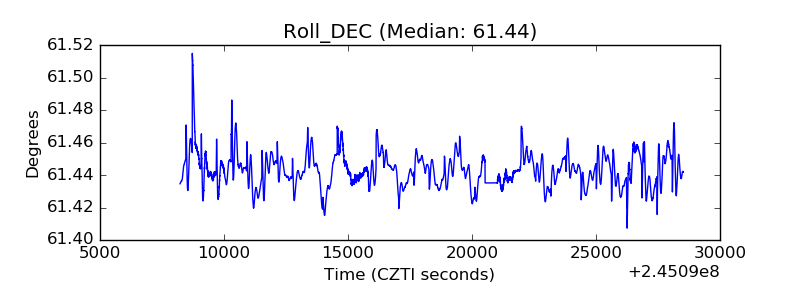 |
| _Roll_RA | 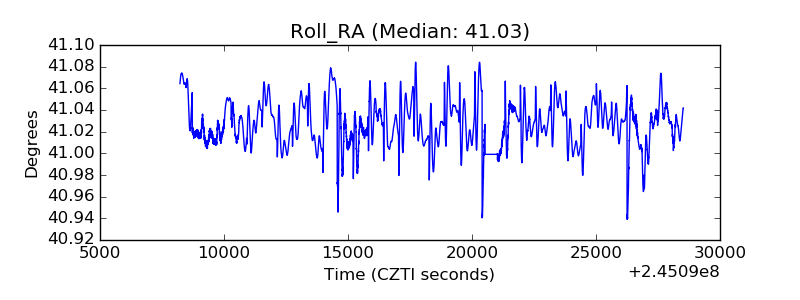 |
| Veto Counter | 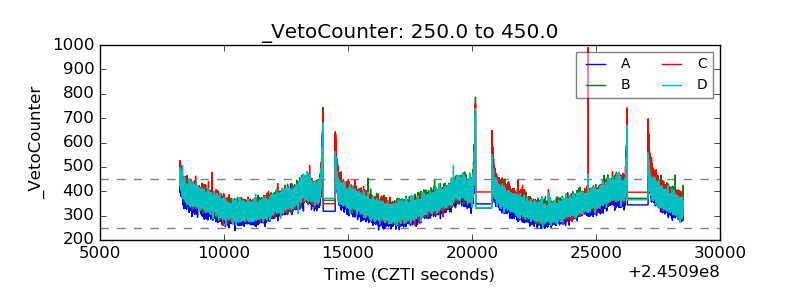 |