| Param | Original file | Final file |
|---|---|---|
| Filename | modeM0/AS1T01_193T01_9000001590_10966cztM0_level2.evt | modeM0/AS1T01_193T01_9000001590_10966cztM0_level2_quad_clean.evt |
| Size (bytes) | 183,787,200 | 47,779,200 |
| Size | 175.3 MB | 45.6 MB |
| Events in quadrant A | 1,645,785 | 303,213 |
| Events in quadrant B | 1,475,992 | 316,758 |
| Events in quadrant C | 1,077,396 | 328,974 |
| Events in quadrant D | 1,187,912 | 311,307 |
| Mode SS | |||
|---|---|---|---|
| Quadrant | BADHDUFLAG | Total packets | Discarded packets |
| A | 0 | 52 | 0 |
| B | 0 | 52 | 0 |
| C | 0 | 52 | 0 |
| D | 0 | 52 | 0 |
| Mode M0 | |||
|---|---|---|---|
| Quadrant | BADHDUFLAG | Total packets | Discarded packets |
| A | 0 | 6803 | 1 |
| B | 0 | 6277 | 1 |
| C | 0 | 5227 | 1 |
| D | 0 | 5577 | 1 |
| Mode M9 | |||
|---|---|---|---|
| Quadrant | BADHDUFLAG | Total packets | Discarded packets |
| A | 0 | 3 | 0 |
| B | 0 | 3 | 0 |
| C | 0 | 3 | 0 |
| D | 0 | 4 | 0 |
| Quadrant | Total seconds | Saturated seconds | Saturation percentage |
|---|---|---|---|
| A | 2598 | 164 | 6.312548% |
| B | 2598 | 106 | 4.080062% |
| C | 2598 | 2 | 0.076982% |
| D | 2598 | 27 | 1.039261% |
Noise dominated data is calculated using 1-second bins in cleaned event files. If a bin has >2000 counts, and if more than 50% of those come from <1% of pixels, then it is considered to be noise-dominated and hence unusable.
| Quadrant | # 1 sec bins | Bins with >0 counts | Bins with >2000 counts | High rate bins dominated by noise | Noise dominated (total time) | Noise dominated (detector-on time) | Marked lightcurve |
|---|---|---|---|---|---|---|---|
| A | 2598 | 2598 | 136 | 136 | 5.23% | 5.23% | 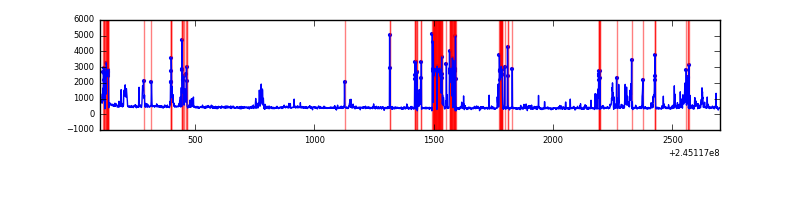 |
| B | 2598 | 2598 | 63 | 63 | 2.42% | 2.42% | 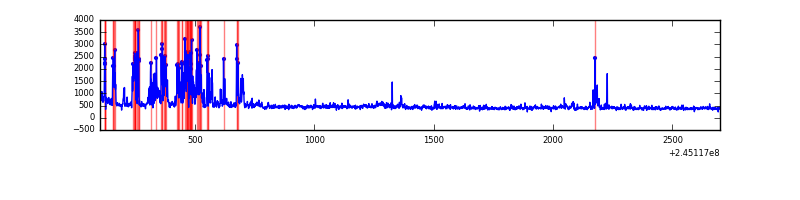 |
| C | 2598 | 2598 | 0 | 0 | 0.00% | 0.00% | 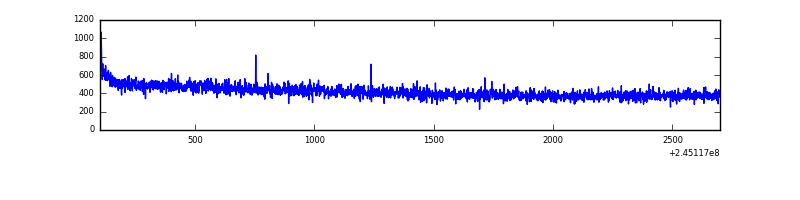 |
| D | 2598 | 2598 | 20 | 20 | 0.77% | 0.77% |  |
Top three noisy pixels from each quadrant. If the there are fewer than three noisy pixels in the level2.evt file, extra rows are filled as -1
| Pixel properties | Quadrant properties | ||||||
|---|---|---|---|---|---|---|---|
| Quadrant | DetID | PixID | Counts | Sigma | Mean | Median | Sigma |
| A | 8 | 5 | 589106 | 10449.45 | 267 | 262 | 56.4 |
| A | 15 | 223 | 10193 | 176.23 | 267 | 262 | 56.4 |
| A | 11 | 29 | 7175 | 122.68 | 267 | 262 | 56.4 |
| B | 4 | 239 | 312720 | 5694.03 | 278 | 271 | 54.9 |
| B | 0 | 187 | 25392 | 457.8 | 278 | 271 | 54.9 |
| B | 0 | 229 | 25360 | 457.22 | 278 | 271 | 54.9 |
| C | 13 | 61 | 2001 | 26.12 | 276 | 277 | 66.0 |
| C | 5 | 207 | 1327 | 15.91 | 276 | 277 | 66.0 |
| C | 3 | 202 | 642 | 5.53 | 276 | 277 | 66.0 |
| D | 1 | 52 | 54110 | 821.72 | 267 | 260 | 65.5 |
| D | 10 | 253 | 52197 | 792.53 | 267 | 260 | 65.5 |
| D | 2 | 14 | 19017 | 286.22 | 267 | 260 | 65.5 |
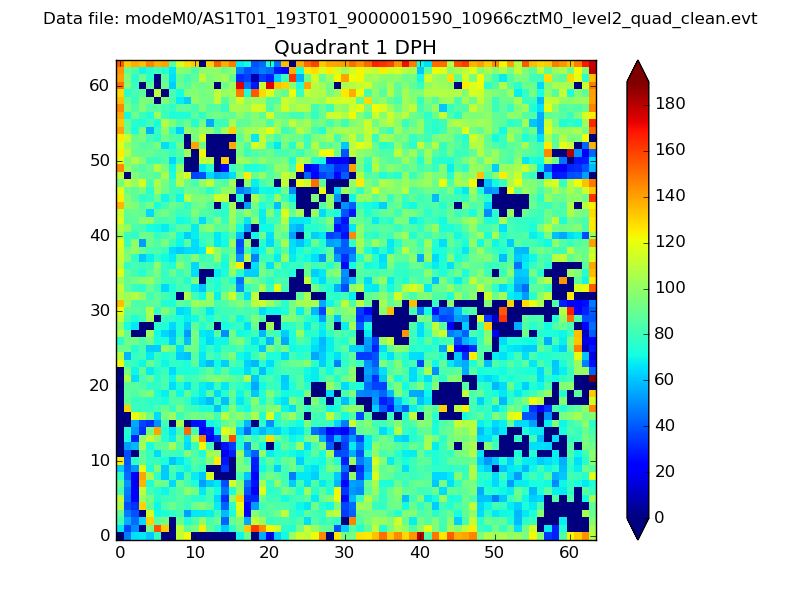
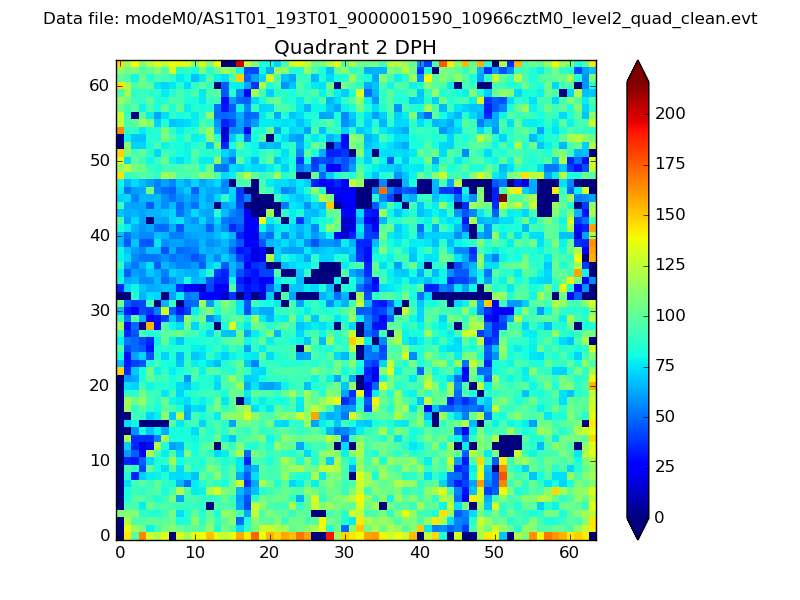
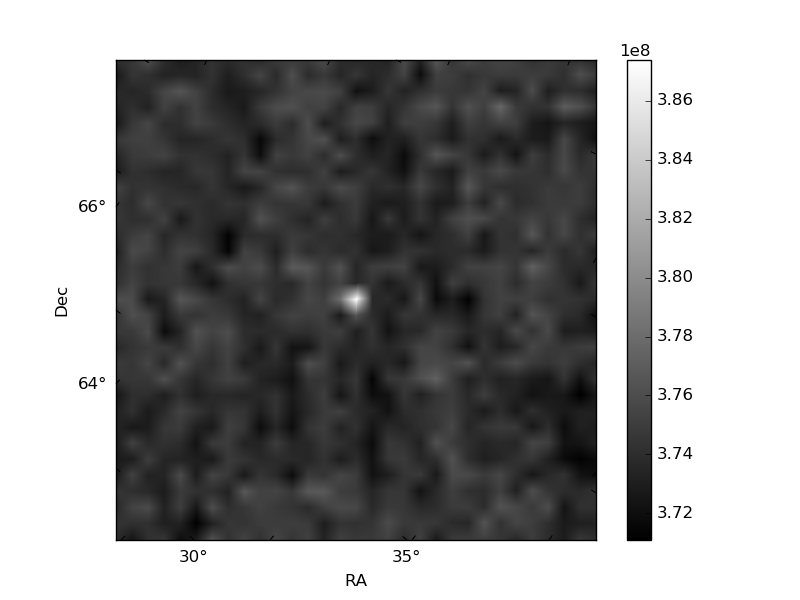
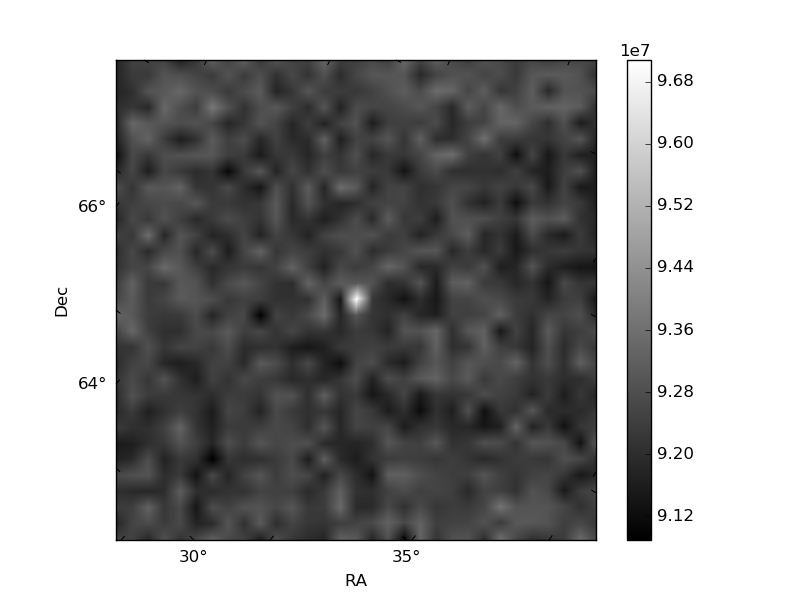
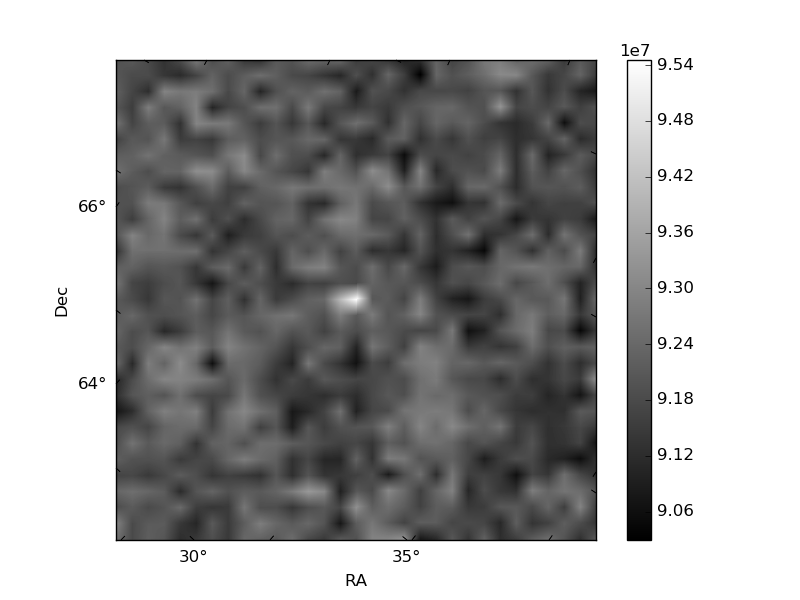
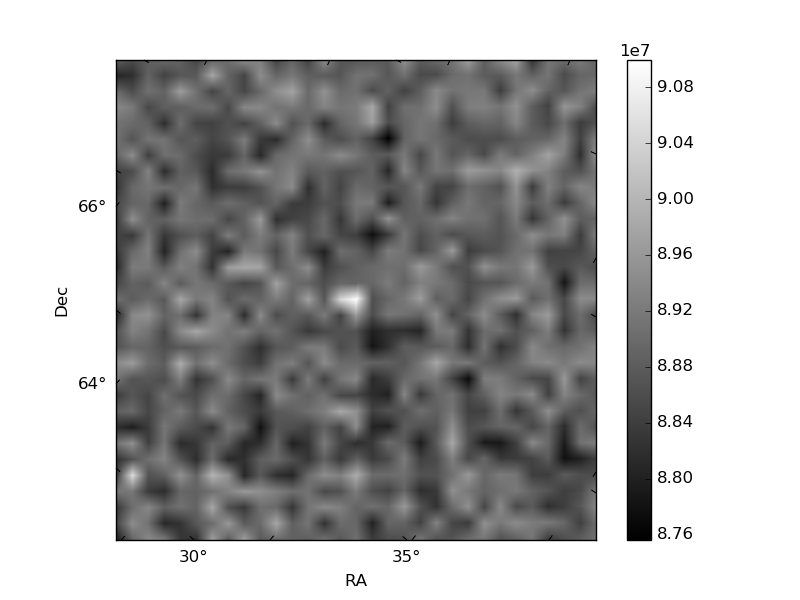
Histogram calculated using DETX and DETY for each event in the final _common_clean file
| Quadrant A | 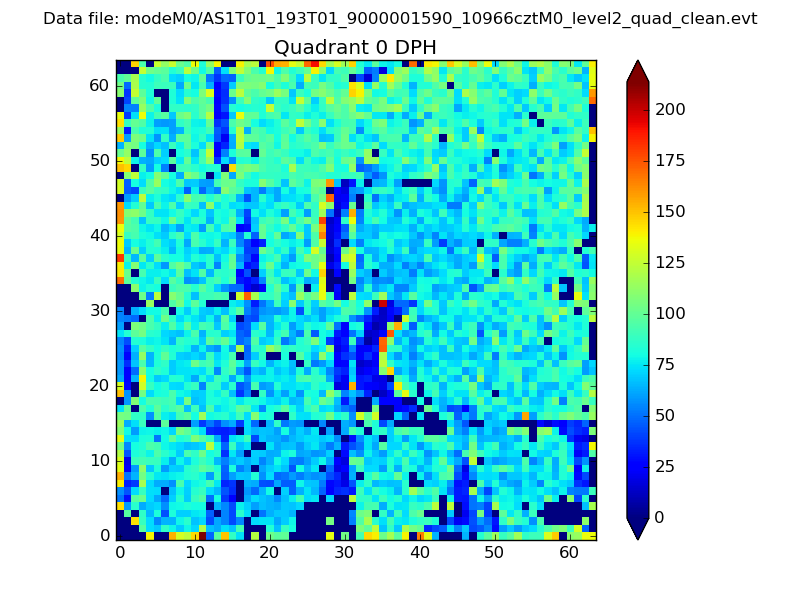 |
 |
Quadrant B |
|---|---|---|---|
| Quadrant D | 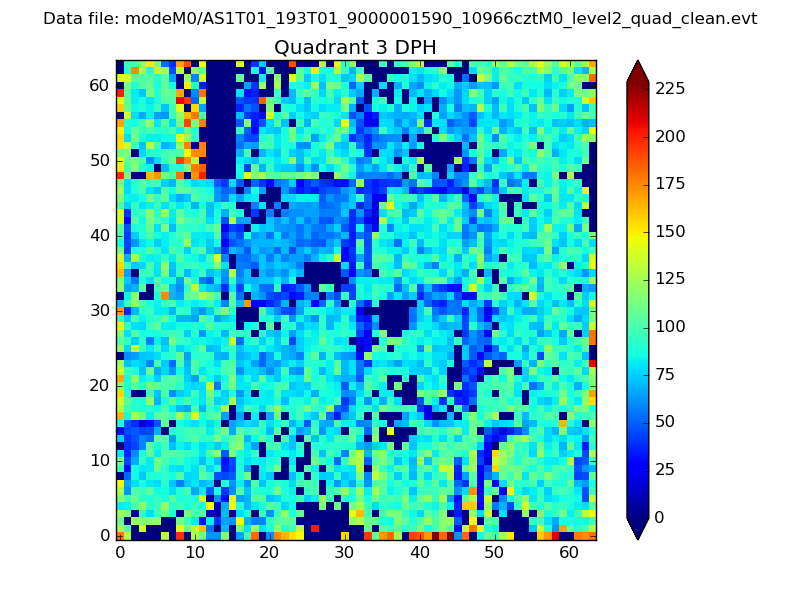 |
 |
Quadrant C |
| Plot type | Count rate plots | Images |
|---|---|---|
| Comparison with Poisson distribution Blue bars denote a histogram of data divided into 1 sec bins. Red curve is a Poisson curve with rate = median count rate of data. |
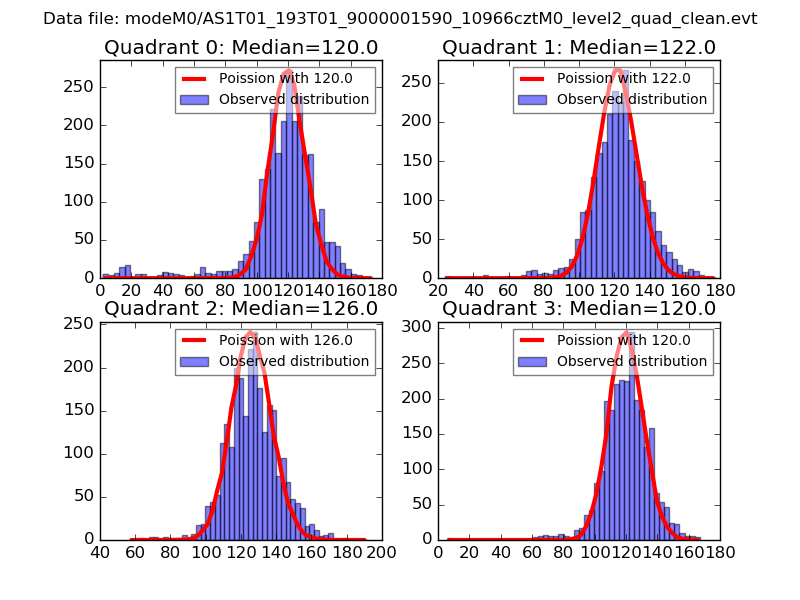 |
 |
| Quadrant-wise count rates Data is divided into 100 sec bins |
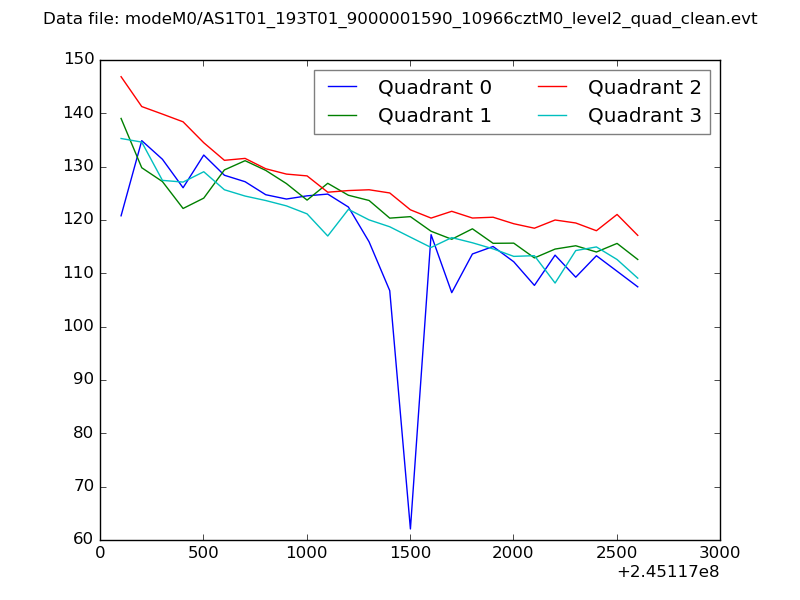 |
|
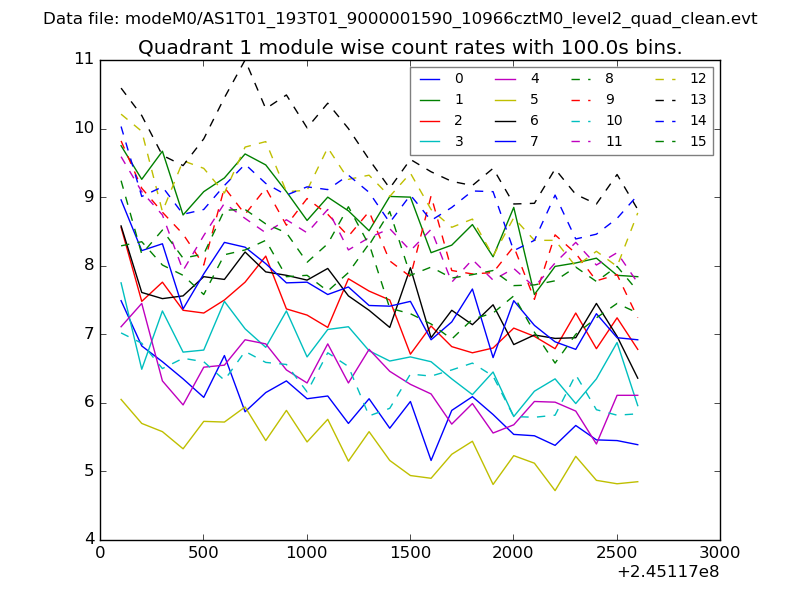
| Module-wise count rates for Quadrant A Data is divided into 100 sec bins |
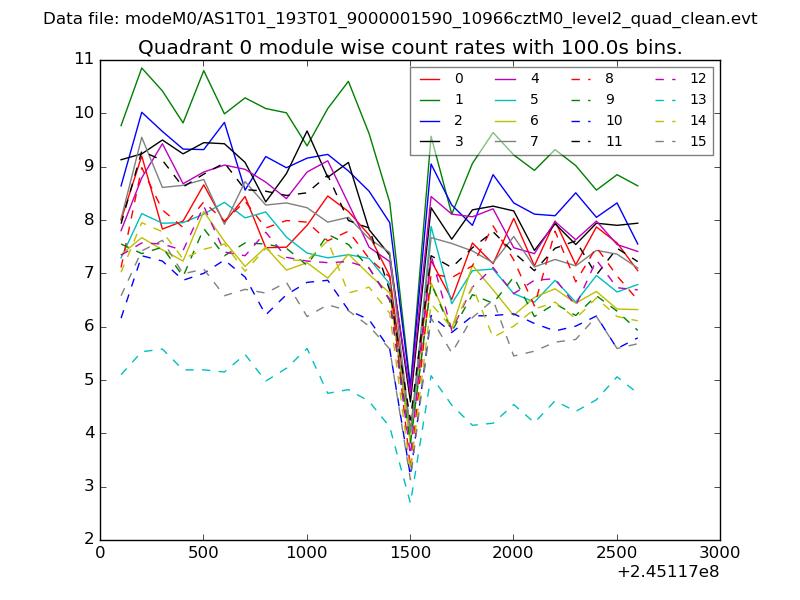 |
 |
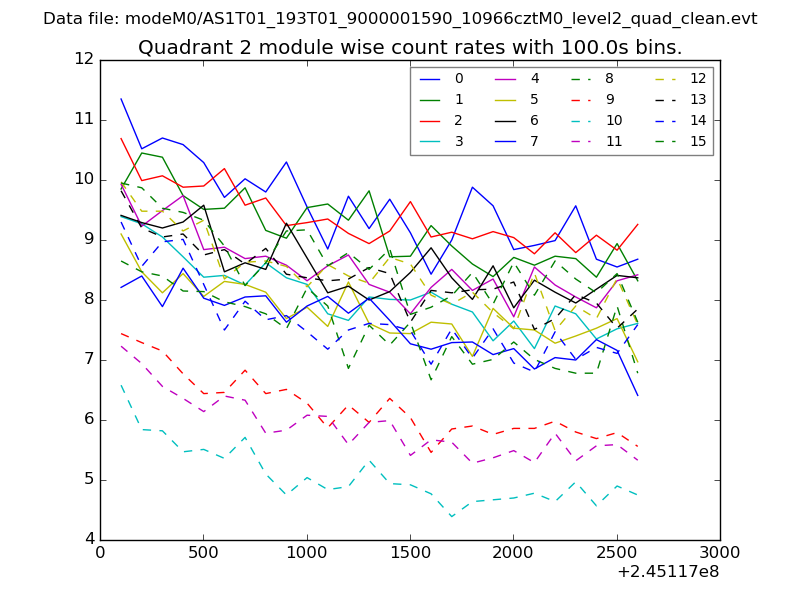
| Module-wise count rates for Quadrant B Data is divided into 100 sec bins |
 |
 |
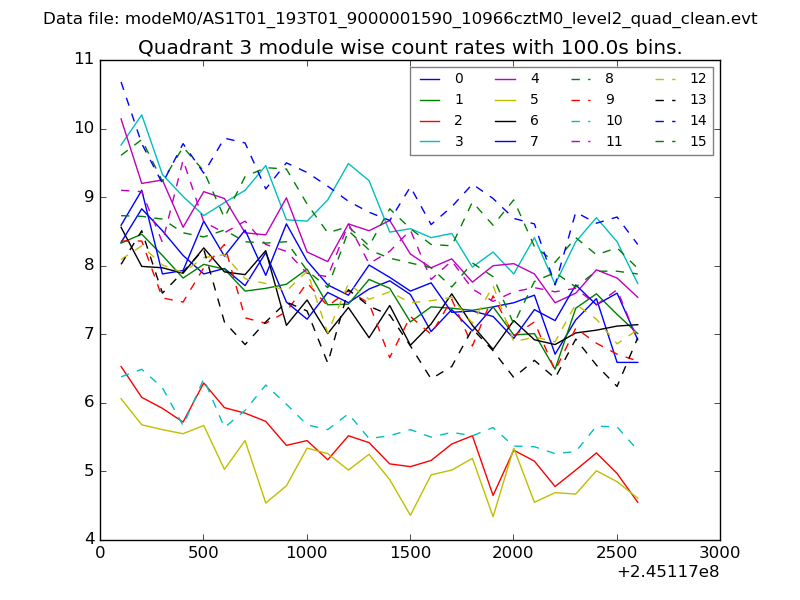
| Module-wise count rates for Quadrant C Data is divided into 100 sec bins |
 |
 |
| Module-wise count rates for Quadrant D Data is divided into 100 sec bins |
 |
 |
| Parameter | Plot |
|---|---|
| CZT HV Monitor | 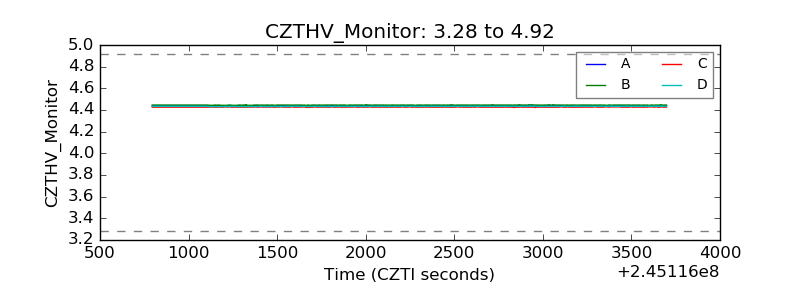 |
| D_VDD | 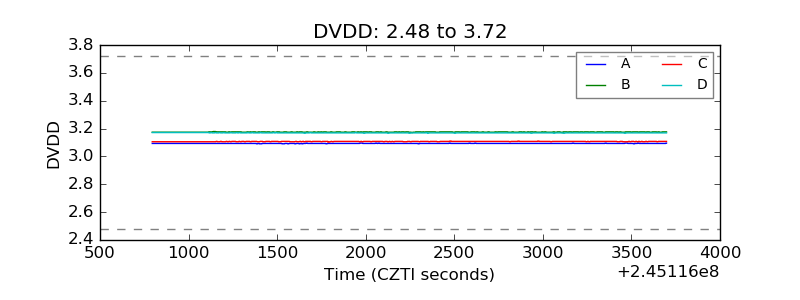 |
| Temperature 1 | 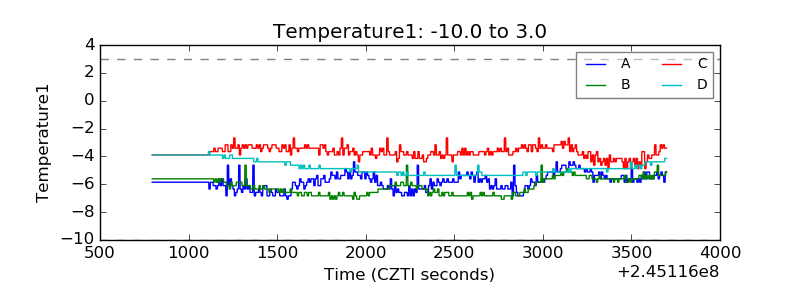 |
| Veto HV Monitor | 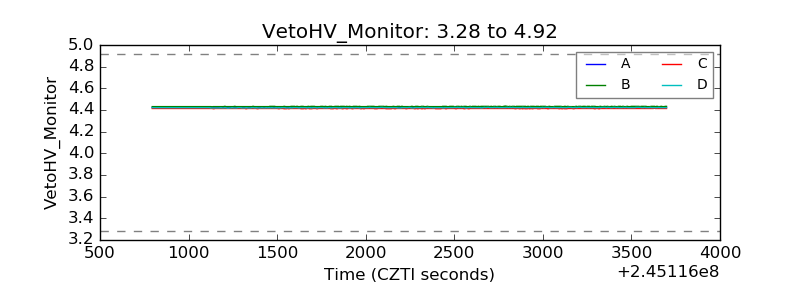 |
| Veto LLD | 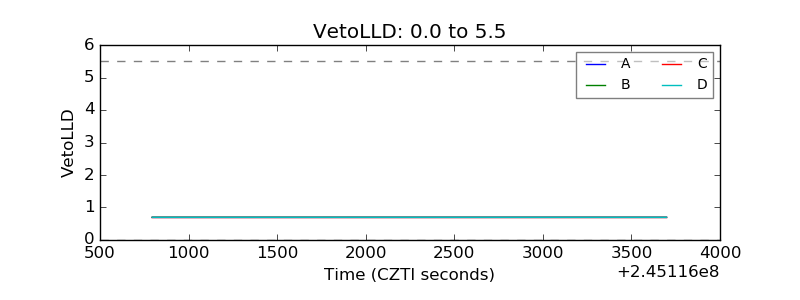 |
| Alpha Counter | 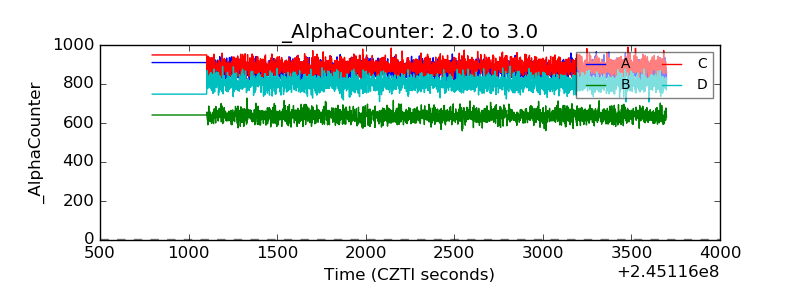 |
| _CPM_Rate | 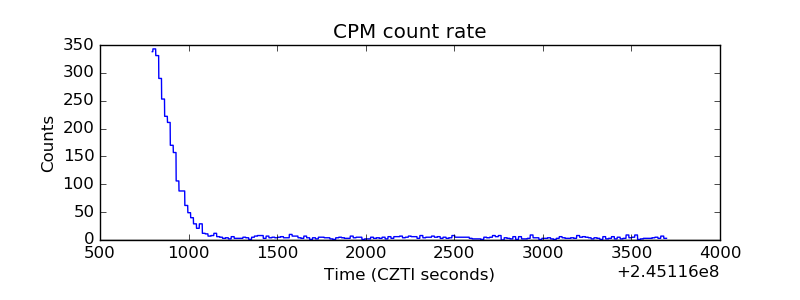 |
| CZT Counter | 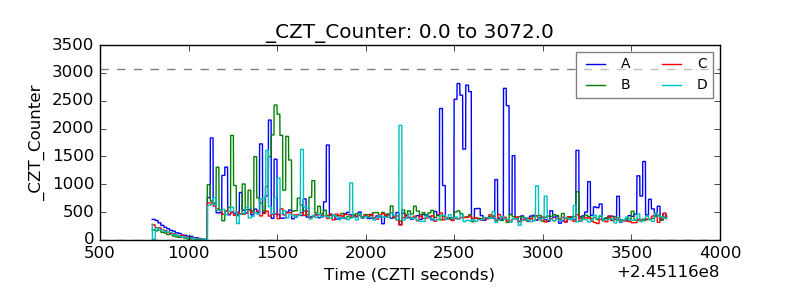 |
| +2.5 Volts monitor |  |
| +5 Volts monitor |  |
| _ROLL_ROT | 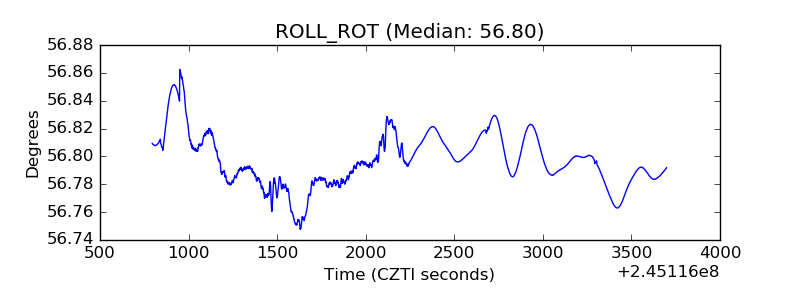 |
| _Roll_DEC |  |
| _Roll_RA | 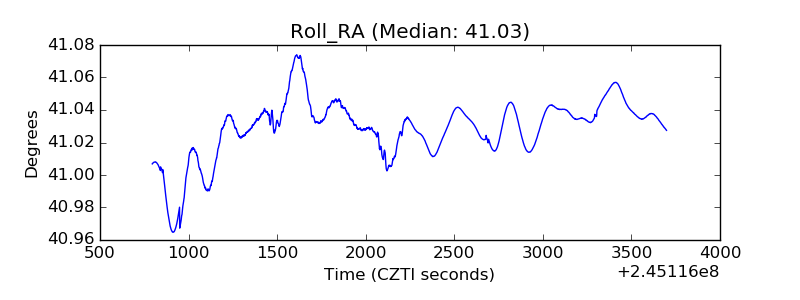 |
| Veto Counter | 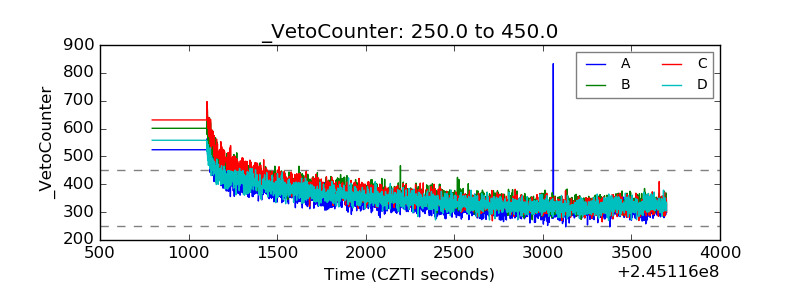 |