| Param | Original file | Final file |
|---|---|---|
| Filename | modeM0/AS1G08_027T06_9000001594_10973cztM0_level2.evt | modeM0/AS1G08_027T06_9000001594_10973cztM0_level2_quad_clean.evt |
| Size (bytes) | 495,794,880 | 95,296,320 |
| Size | 472.8 MB | 90.9 MB |
| Events in quadrant A | 3,680,089 | 629,254 |
| Events in quadrant B | 4,513,967 | 614,935 |
| Events in quadrant C | 2,885,618 | 612,388 |
| Events in quadrant D | 3,506,817 | 588,687 |
| Mode M9 | |||
|---|---|---|---|
| Quadrant | BADHDUFLAG | Total packets | Discarded packets |
| A | 0 | 10 | 0 |
| B | 0 | 10 | 0 |
| C | 0 | 10 | 0 |
| D | 0 | 10 | 0 |
| Mode M0 | |||
|---|---|---|---|
| Quadrant | BADHDUFLAG | Total packets | Discarded packets |
| A | 0 | 15078 | 2 |
| B | 0 | 17563 | 1 |
| C | 0 | 12938 | 1 |
| D | 0 | 14538 | 1 |
| Mode SS | |||
|---|---|---|---|
| Quadrant | BADHDUFLAG | Total packets | Discarded packets |
| A | 0 | 128 | 0 |
| B | 0 | 128 | 0 |
| C | 0 | 128 | 0 |
| D | 0 | 128 | 0 |
| Quadrant | Total seconds | Saturated seconds | Saturation percentage |
|---|---|---|---|
| A | 6314 | 117 | 1.853025% |
| B | 6314 | 563 | 8.916693% |
| C | 6314 | 47 | 0.744378% |
| D | 6314 | 108 | 1.710485% |
Noise dominated data is calculated using 1-second bins in cleaned event files. If a bin has >2000 counts, and if more than 50% of those come from <1% of pixels, then it is considered to be noise-dominated and hence unusable.
| Quadrant | # 1 sec bins | Bins with >0 counts | Bins with >2000 counts | High rate bins dominated by noise | Noise dominated (total time) | Noise dominated (detector-on time) | Marked lightcurve |
|---|---|---|---|---|---|---|---|
| A | 7349 | 6314 | 25 | 25 | 0.34% | 0.40% |  |
| B | 7349 | 6315 | 305 | 305 | 4.15% | 4.83% | 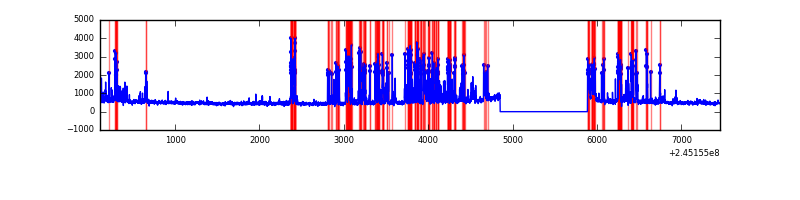 |
| C | 7349 | 6315 | 0 | 0 | 0.00% | 0.00% | 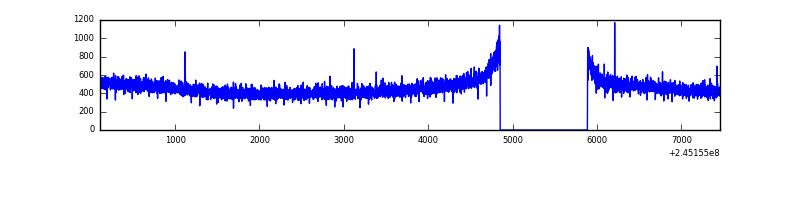 |
| D | 7349 | 6315 | 32 | 32 | 0.44% | 0.51% |  |
Top three noisy pixels from each quadrant. If the there are fewer than three noisy pixels in the level2.evt file, extra rows are filled as -1
| Pixel properties | Quadrant properties | ||||||
|---|---|---|---|---|---|---|---|
| Quadrant | DetID | PixID | Counts | Sigma | Mean | Median | Sigma |
| A | 8 | 5 | 370017 | 2327.12 | 776 | 759 | 158.7 |
| A | 8 | 15 | 275852 | 1733.68 | 776 | 759 | 158.7 |
| A | 8 | 6 | 35069 | 216.23 | 776 | 759 | 158.7 |
| B | 4 | 239 | 1462513 | 10201.09 | 753 | 737 | 143.3 |
| B | 0 | 214 | 41371 | 283.57 | 753 | 737 | 143.3 |
| B | 0 | 229 | 25737 | 174.46 | 753 | 737 | 143.3 |
| C | 13 | 61 | 5445 | 27.47 | 738 | 743 | 171.2 |
| C | 8 | 222 | 5352 | 26.92 | 738 | 743 | 171.2 |
| C | 14 | 234 | 2450 | 9.97 | 738 | 743 | 171.2 |
| D | 1 | 52 | 344605 | 1942.55 | 742 | 723 | 177.0 |
| D | 8 | 195 | 91957 | 515.37 | 742 | 723 | 177.0 |
| D | 13 | 104 | 73467 | 410.92 | 742 | 723 | 177.0 |
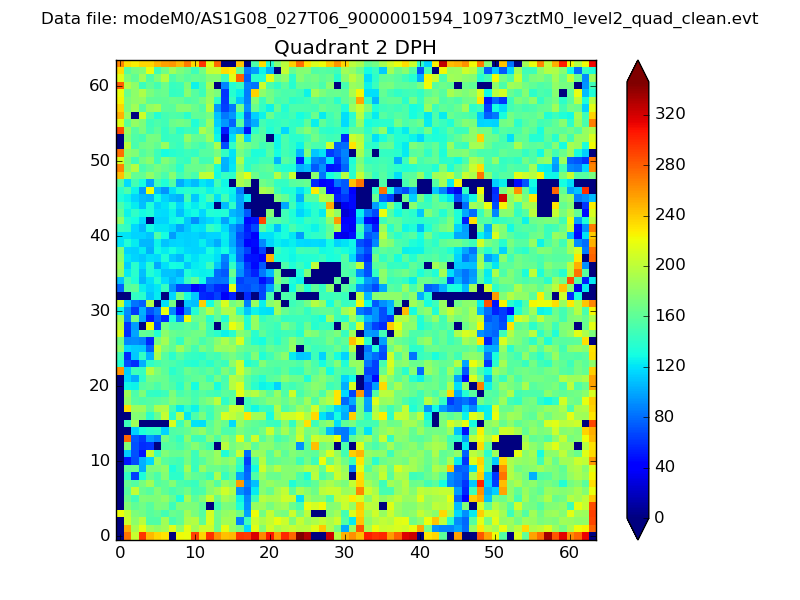
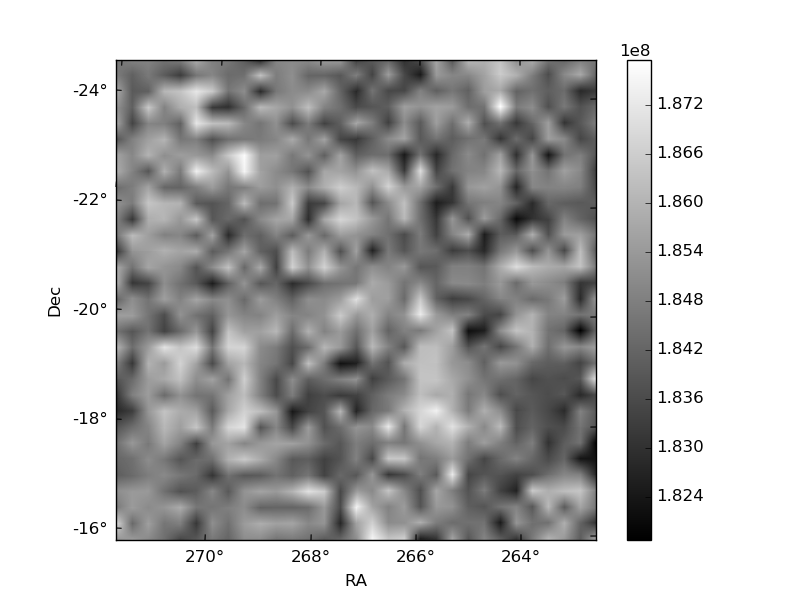
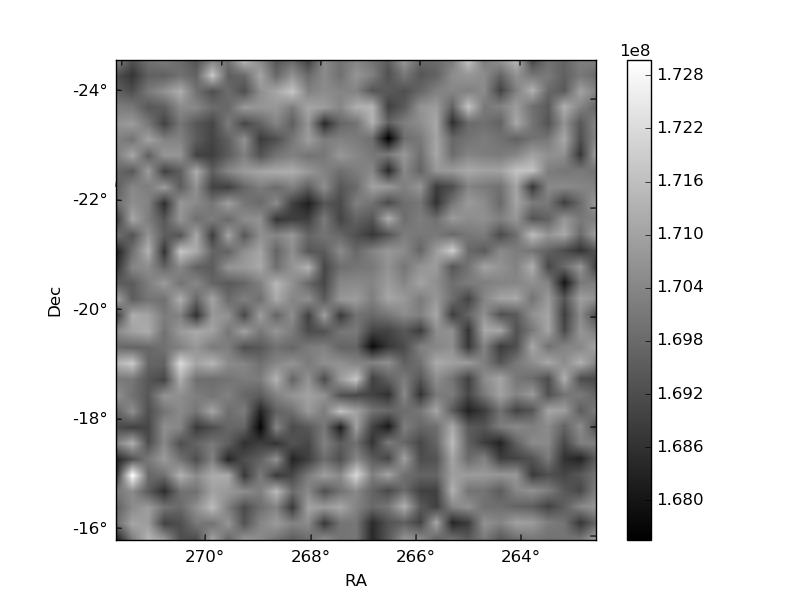
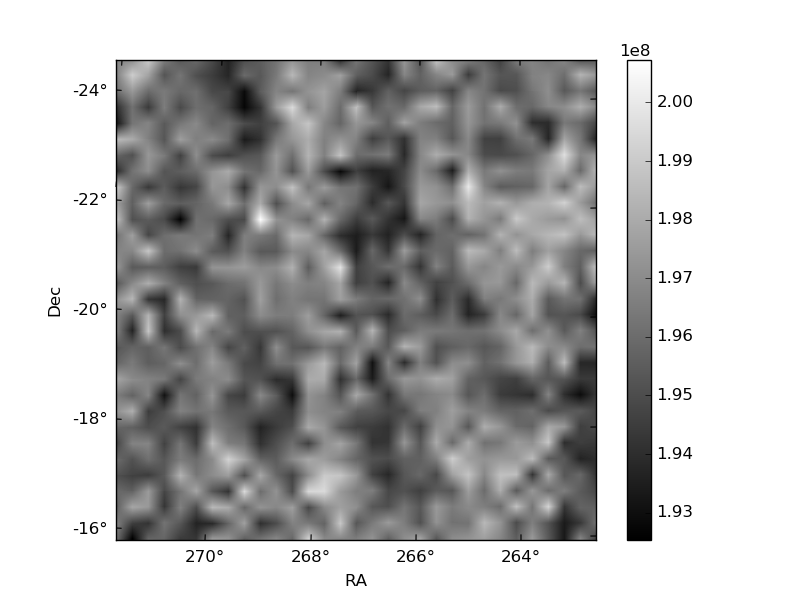
Histogram calculated using DETX and DETY for each event in the final _common_clean file
| Quadrant A | 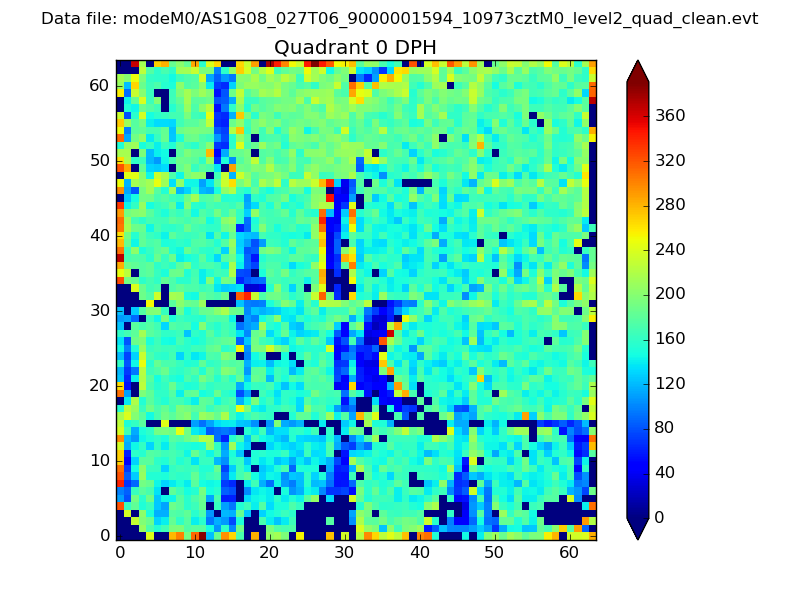 |
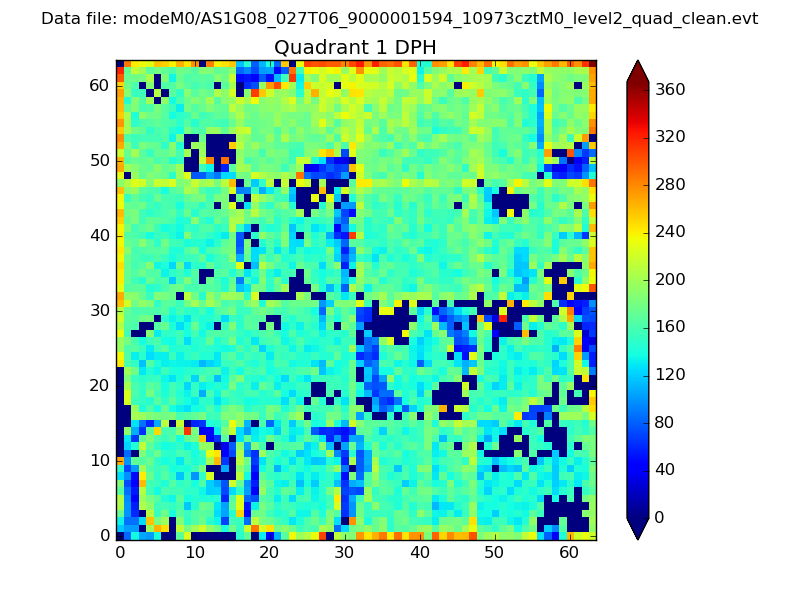 |
Quadrant B |
|---|---|---|---|
| Quadrant D | 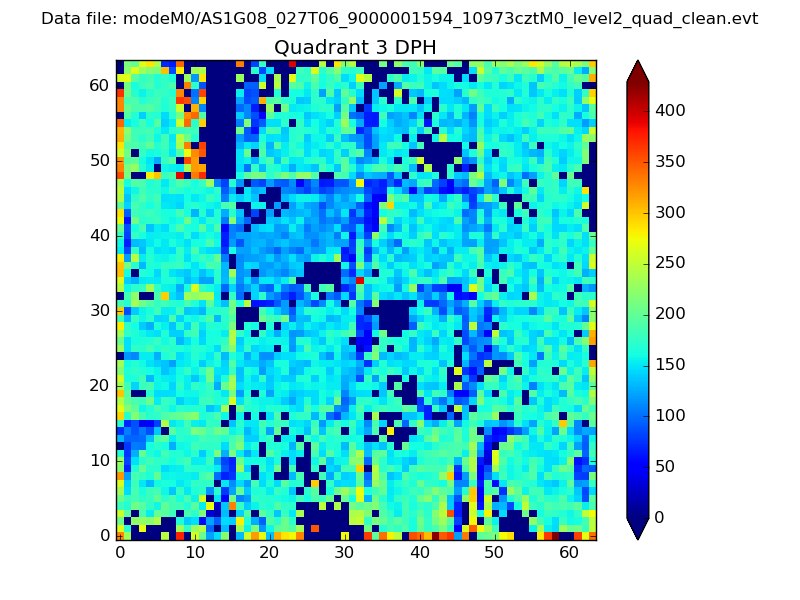 |
 |
Quadrant C |
| Plot type | Count rate plots | Images |
|---|---|---|
| Comparison with Poisson distribution Blue bars denote a histogram of data divided into 1 sec bins. Red curve is a Poisson curve with rate = median count rate of data. |
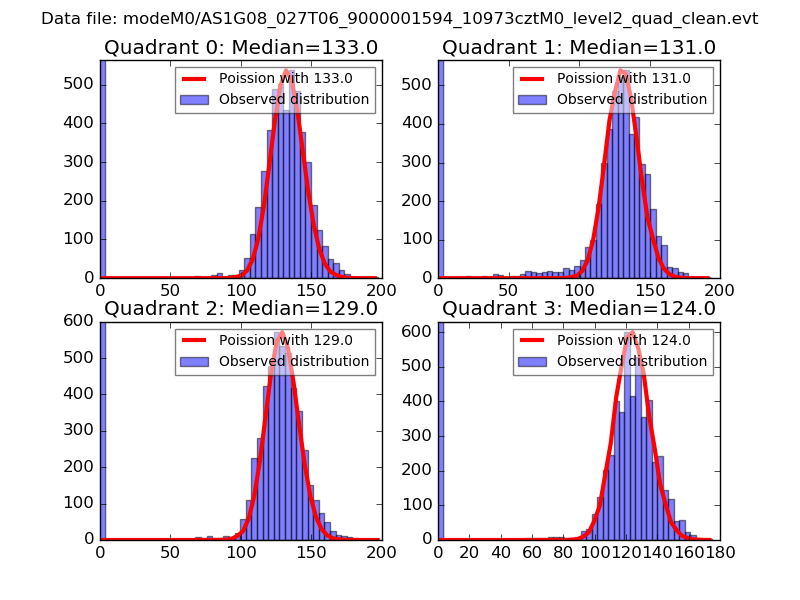 |
 |
| Quadrant-wise count rates Data is divided into 100 sec bins |
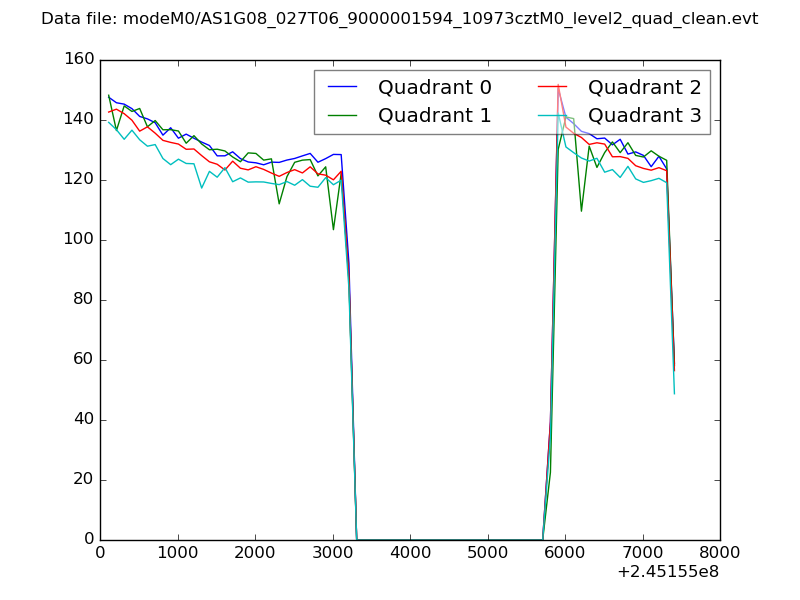 |
|
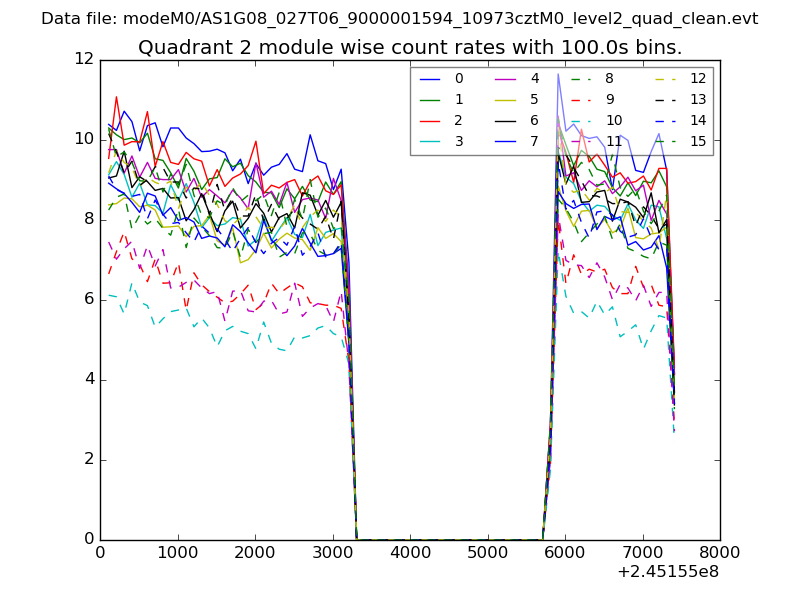
| Module-wise count rates for Quadrant A Data is divided into 100 sec bins |
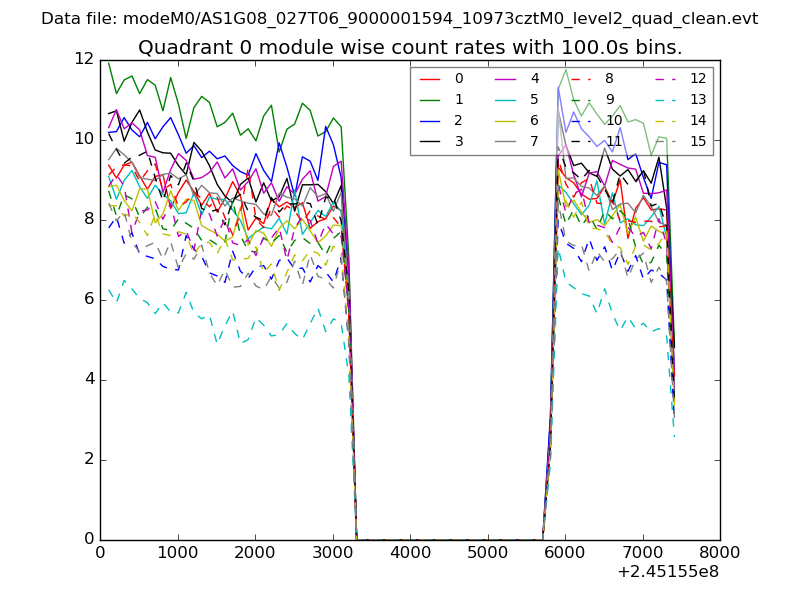 |
 |
| Module-wise count rates for Quadrant B Data is divided into 100 sec bins |
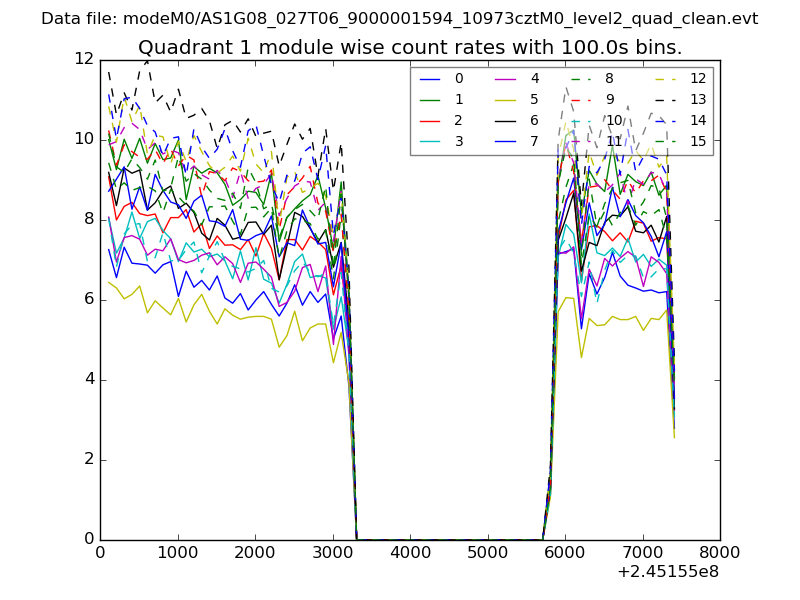 |
 |
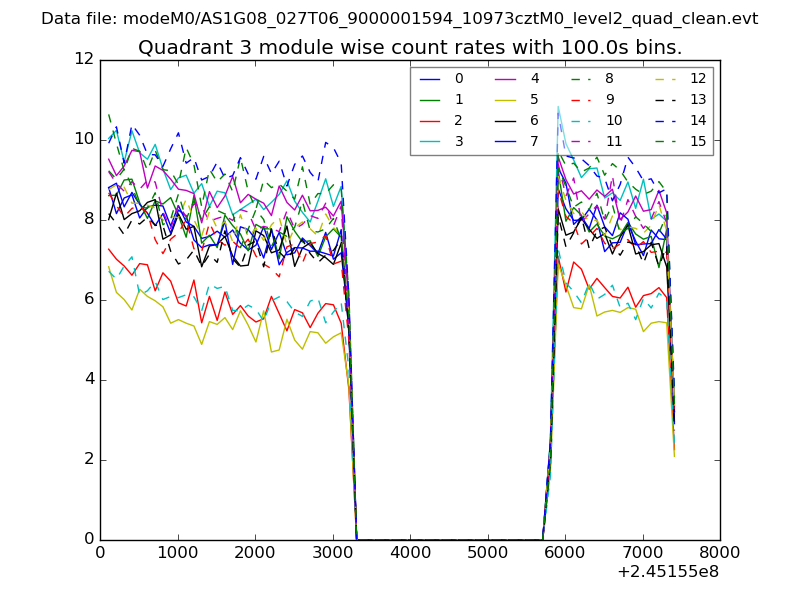
| Module-wise count rates for Quadrant C Data is divided into 100 sec bins |
 |
 |
| Module-wise count rates for Quadrant D Data is divided into 100 sec bins |
 |
 |
| Parameter | Plot |
|---|---|
| CZT HV Monitor | 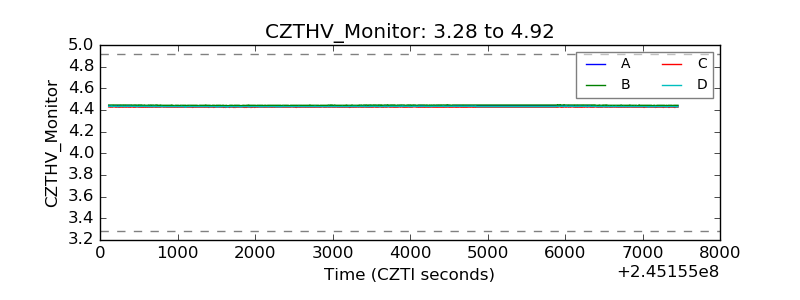 |
| D_VDD | 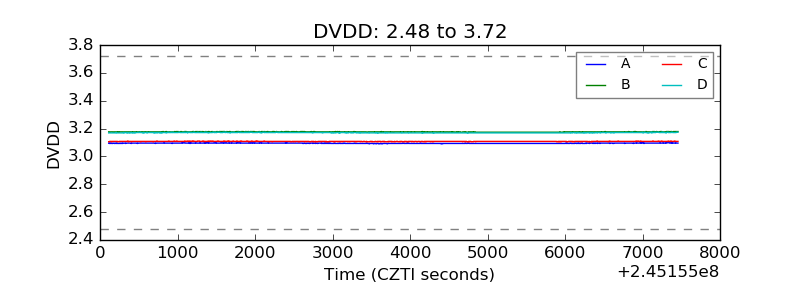 |
| Temperature 1 | 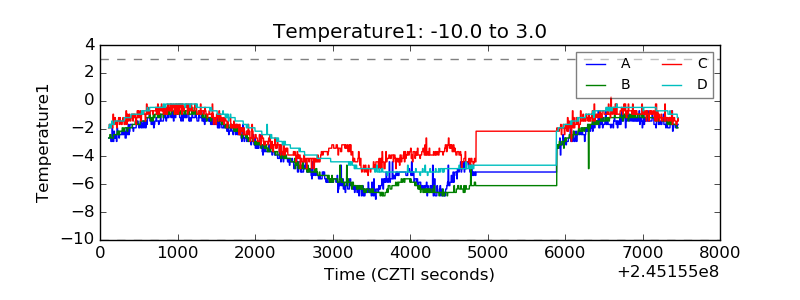 |
| Veto HV Monitor | 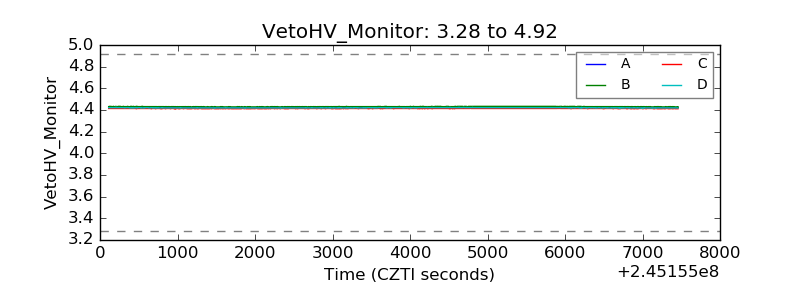 |
| Veto LLD | 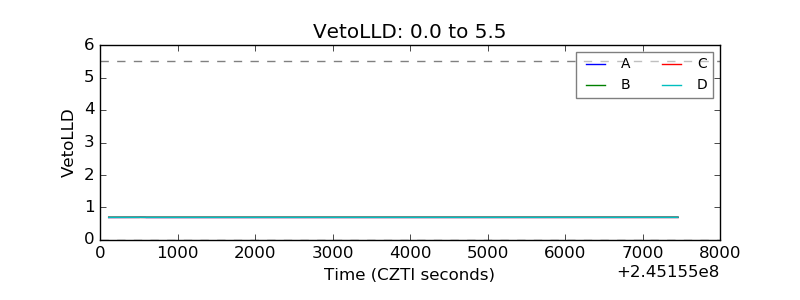 |
| Alpha Counter | 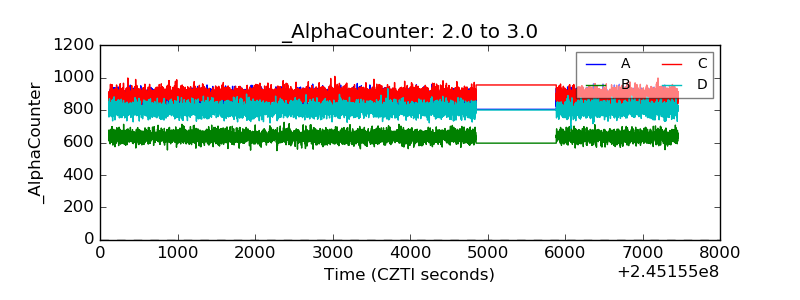 |
| _CPM_Rate | 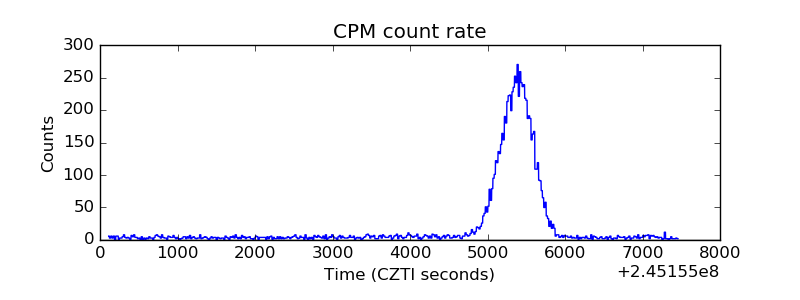 |
| CZT Counter | 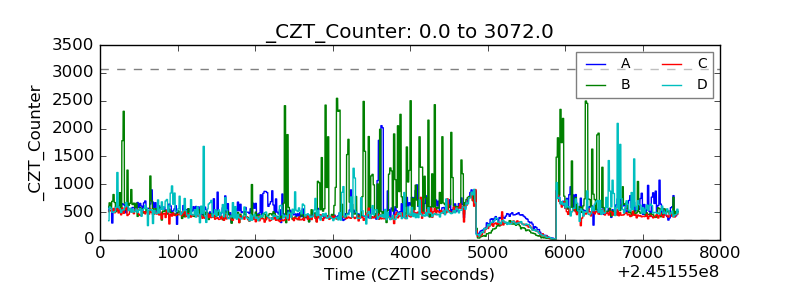 |
| +2.5 Volts monitor |  |
| +5 Volts monitor |  |
| _ROLL_ROT | 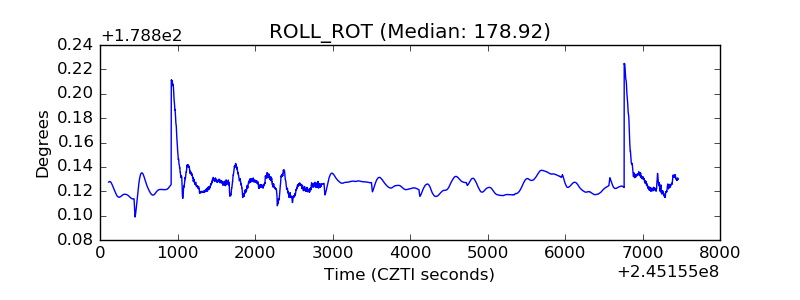 |
| _Roll_DEC | 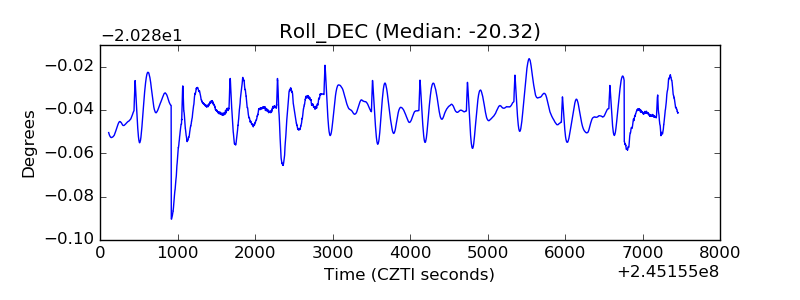 |
| _Roll_RA | 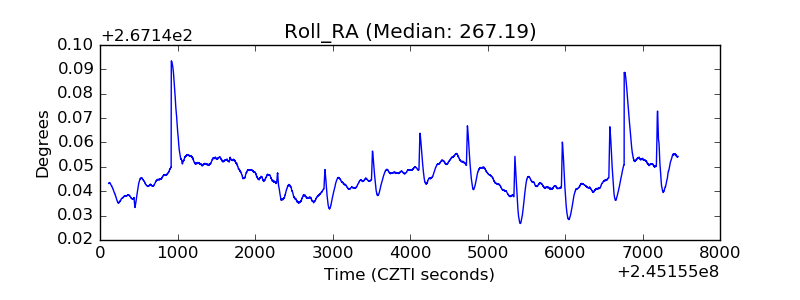 |
| Veto Counter | 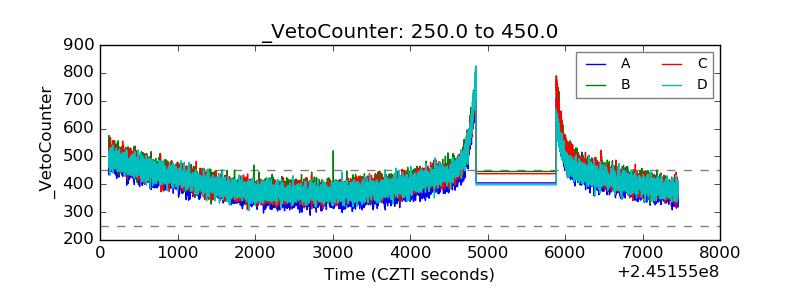 |