| Param | Original file | Final file |
|---|---|---|
| Filename | modeM0/AS1G08_027T06_9000001594_10974cztM0_level2.evt | modeM0/AS1G08_027T06_9000001594_10974cztM0_level2_quad_clean.evt |
| Size (bytes) | 527,785,920 | 88,865,280 |
| Size | 503.3 MB | 84.7 MB |
| Events in quadrant A | 4,466,407 | 563,803 |
| Events in quadrant B | 4,317,545 | 565,027 |
| Events in quadrant C | 3,032,255 | 558,780 |
| Events in quadrant D | 3,712,201 | 535,069 |
| Mode M9 | |||
|---|---|---|---|
| Quadrant | BADHDUFLAG | Total packets | Discarded packets |
| A | 0 | 6 | 0 |
| B | 0 | 6 | 0 |
| C | 0 | 6 | 0 |
| D | 0 | 6 | 0 |
| Mode M0 | |||
|---|---|---|---|
| Quadrant | BADHDUFLAG | Total packets | Discarded packets |
| A | 0 | 17866 | 2 |
| B | 0 | 17198 | 1 |
| C | 0 | 13848 | 1 |
| D | 0 | 15707 | 1 |
| Mode SS | |||
|---|---|---|---|
| Quadrant | BADHDUFLAG | Total packets | Discarded packets |
| A | 0 | 136 | 0 |
| B | 0 | 136 | 0 |
| C | 0 | 136 | 0 |
| D | 0 | 136 | 0 |
| Quadrant | Total seconds | Saturated seconds | Saturation percentage |
|---|---|---|---|
| A | 6719 | 158 | 2.351540% |
| B | 6719 | 340 | 5.060277% |
| C | 6719 | 48 | 0.714392% |
| D | 6719 | 95 | 1.413901% |
Noise dominated data is calculated using 1-second bins in cleaned event files. If a bin has >2000 counts, and if more than 50% of those come from <1% of pixels, then it is considered to be noise-dominated and hence unusable.
| Quadrant | # 1 sec bins | Bins with >0 counts | Bins with >2000 counts | High rate bins dominated by noise | Noise dominated (total time) | Noise dominated (detector-on time) | Marked lightcurve |
|---|---|---|---|---|---|---|---|
| A | 7349 | 6720 | 45 | 45 | 0.61% | 0.67% |  |
| B | 7349 | 6720 | 158 | 158 | 2.15% | 2.35% | 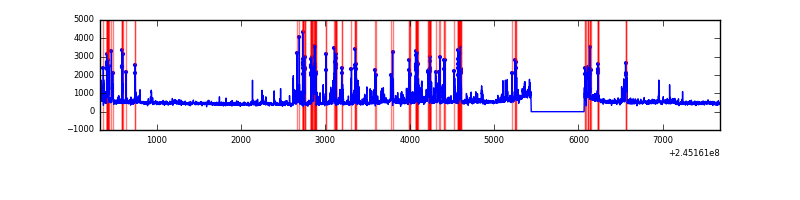 |
| C | 7349 | 6720 | 0 | 0 | 0.00% | 0.00% | 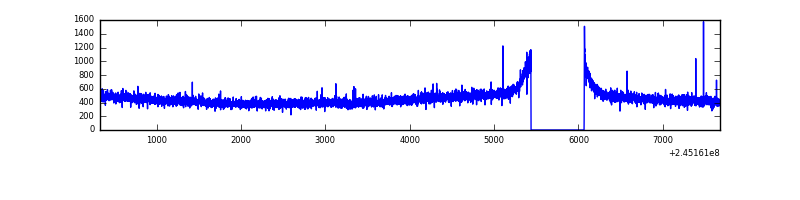 |
| D | 7349 | 6720 | 48 | 48 | 0.65% | 0.71% |  |
Top three noisy pixels from each quadrant. If the there are fewer than three noisy pixels in the level2.evt file, extra rows are filled as -1
| Pixel properties | Quadrant properties | ||||||
|---|---|---|---|---|---|---|---|
| Quadrant | DetID | PixID | Counts | Sigma | Mean | Median | Sigma |
| A | 8 | 5 | 845713 | 5159.06 | 805 | 788 | 163.8 |
| A | 8 | 15 | 288074 | 1754.15 | 805 | 788 | 163.8 |
| A | 13 | 210 | 71976 | 434.67 | 805 | 788 | 163.8 |
| B | 4 | 239 | 994360 | 6494.65 | 797 | 777 | 153.0 |
| B | 0 | 214 | 52819 | 340.18 | 797 | 777 | 153.0 |
| B | 15 | 204 | 36097 | 230.87 | 797 | 777 | 153.0 |
| C | 13 | 61 | 5788 | 27.69 | 775 | 777 | 181.0 |
| C | 8 | 222 | 5431 | 25.72 | 775 | 777 | 181.0 |
| C | 5 | 207 | 3748 | 16.41 | 775 | 777 | 181.0 |
| D | 13 | 152 | 328998 | 1772.13 | 772 | 747 | 185.2 |
| D | 1 | 52 | 243737 | 1311.83 | 772 | 747 | 185.2 |
| D | 13 | 104 | 76650 | 409.78 | 772 | 747 | 185.2 |
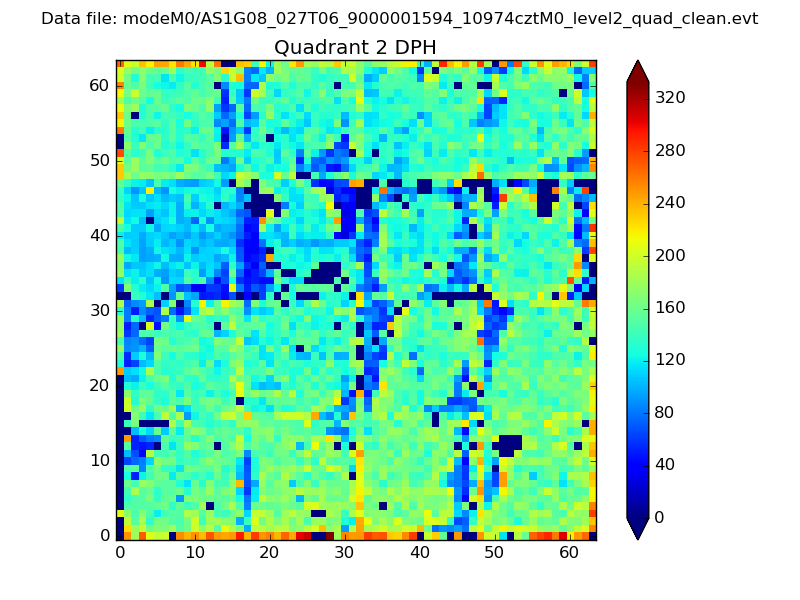
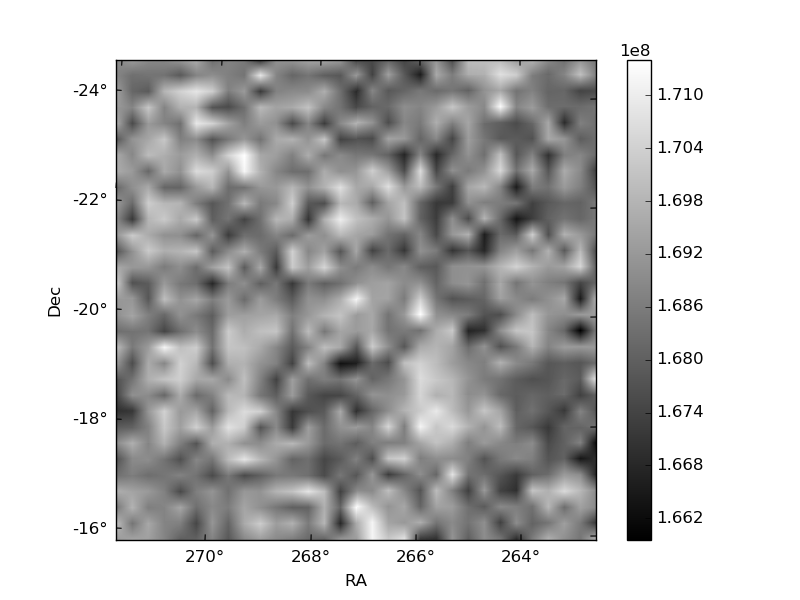
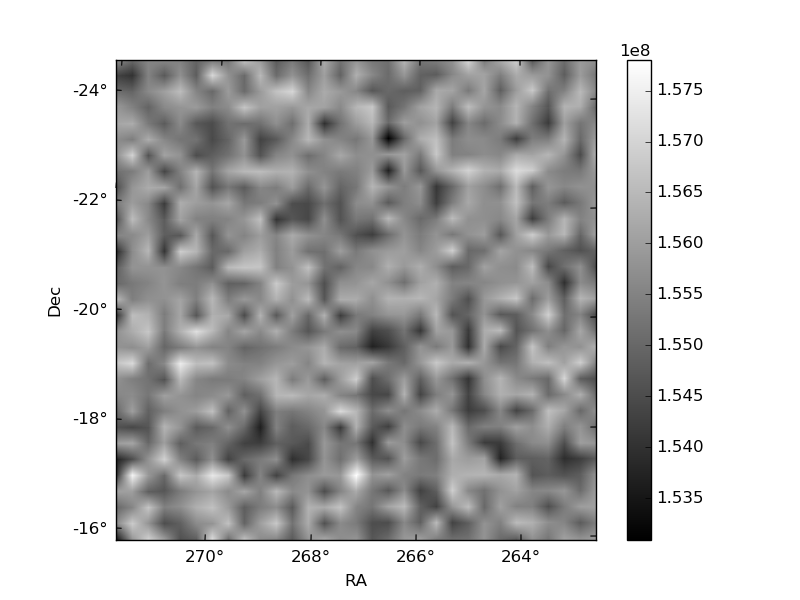
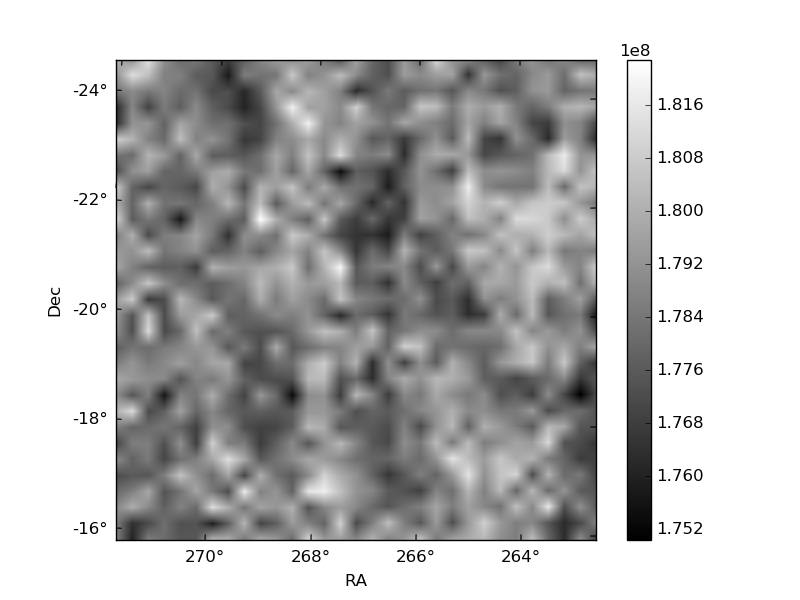
Histogram calculated using DETX and DETY for each event in the final _common_clean file
| Quadrant A | 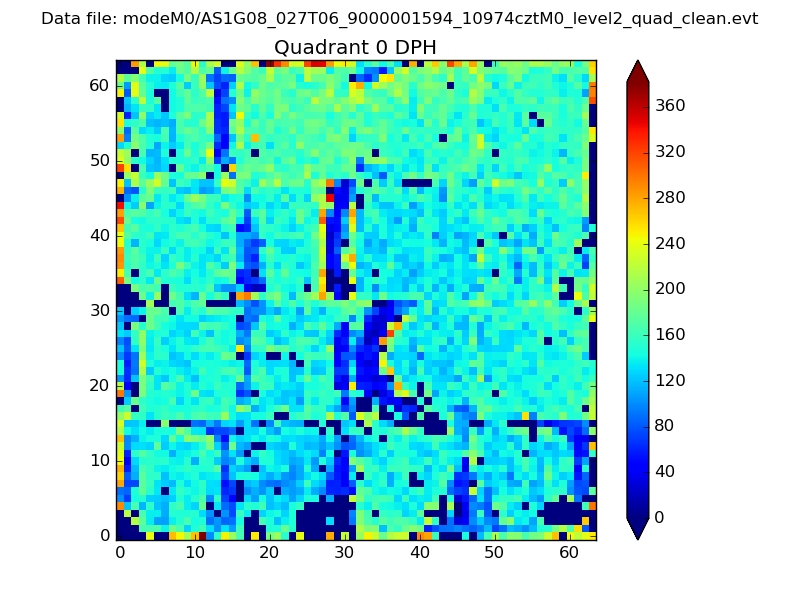 |
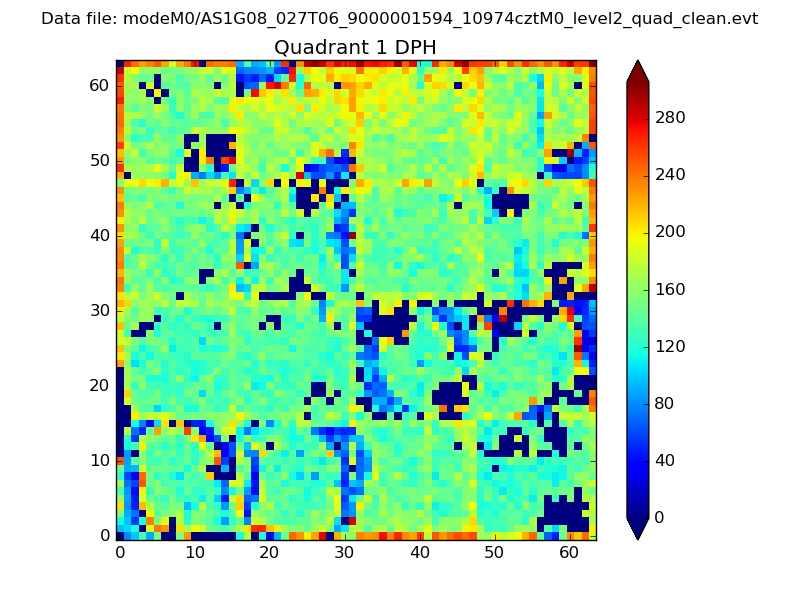 |
Quadrant B |
|---|---|---|---|
| Quadrant D | 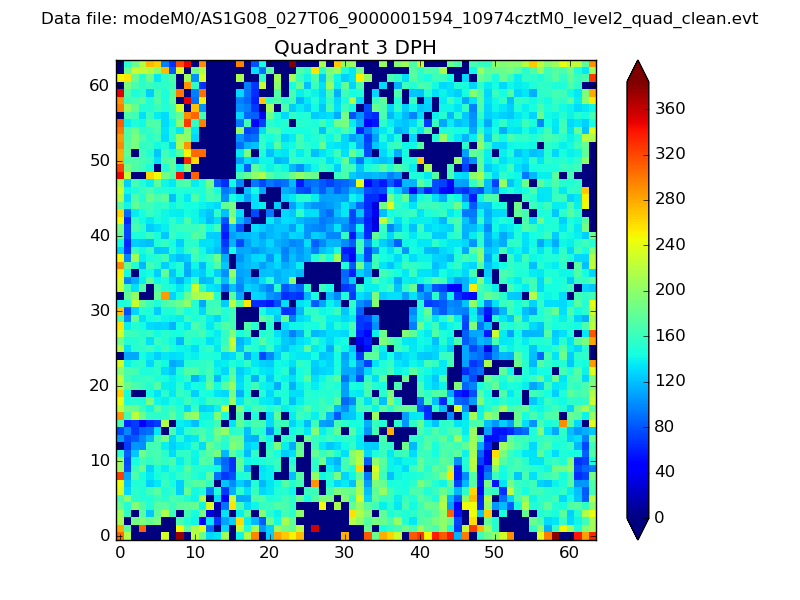 |
 |
Quadrant C |
| Plot type | Count rate plots | Images |
|---|---|---|
| Comparison with Poisson distribution Blue bars denote a histogram of data divided into 1 sec bins. Red curve is a Poisson curve with rate = median count rate of data. |
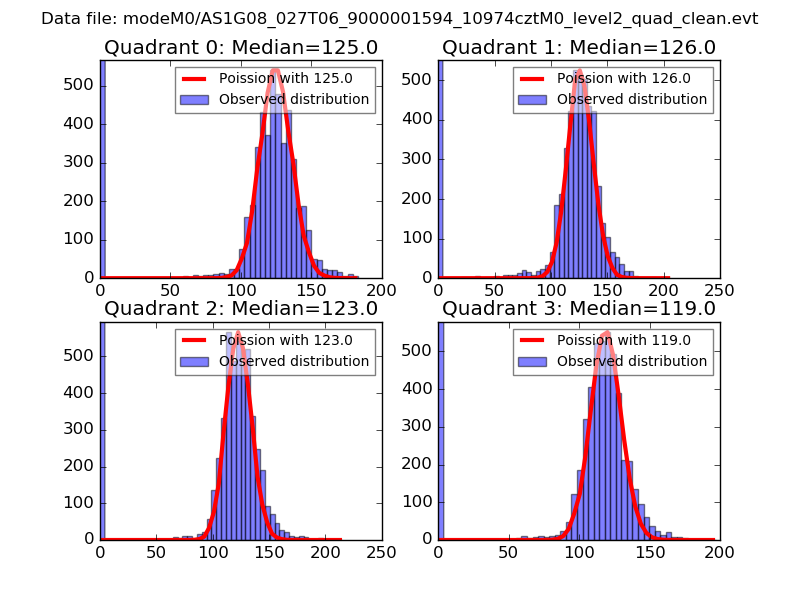 |
 |
| Quadrant-wise count rates Data is divided into 100 sec bins |
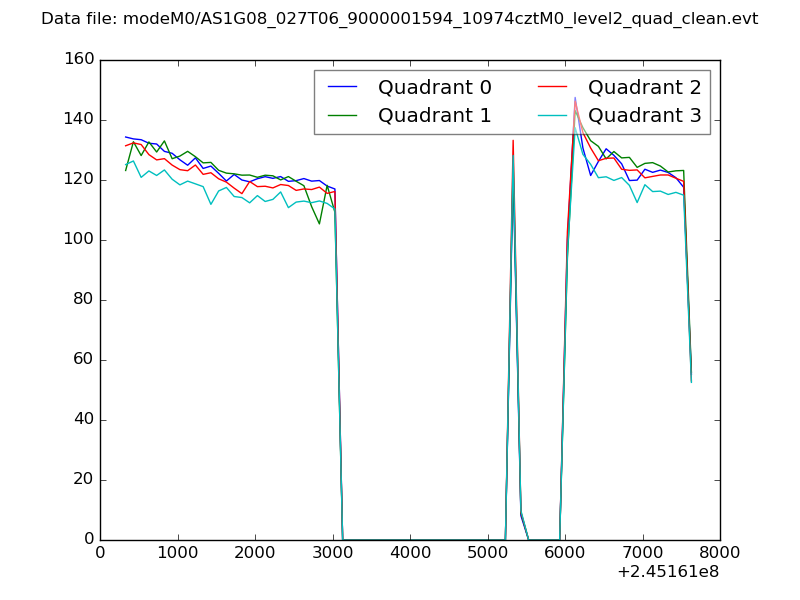 |
|
| Module-wise count rates for Quadrant A Data is divided into 100 sec bins |
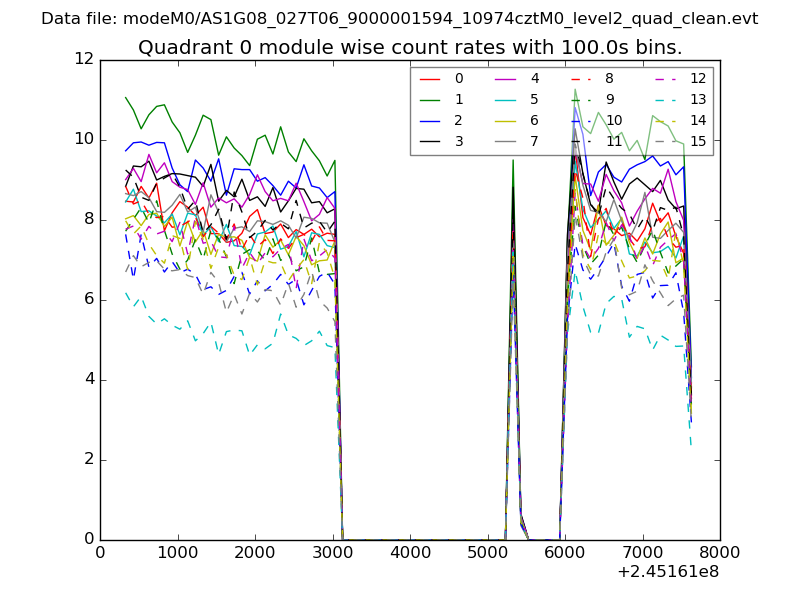 |
 |
| Module-wise count rates for Quadrant B Data is divided into 100 sec bins |
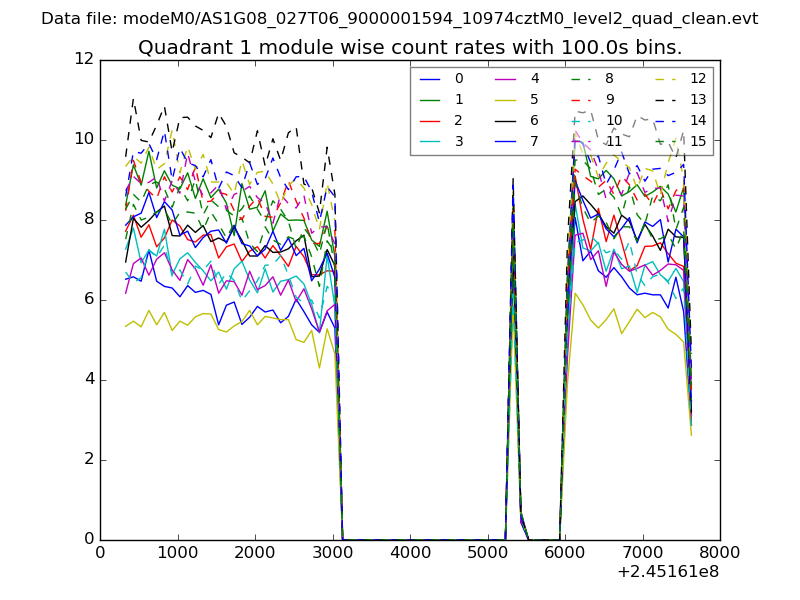 |
 |
| Module-wise count rates for Quadrant C Data is divided into 100 sec bins |
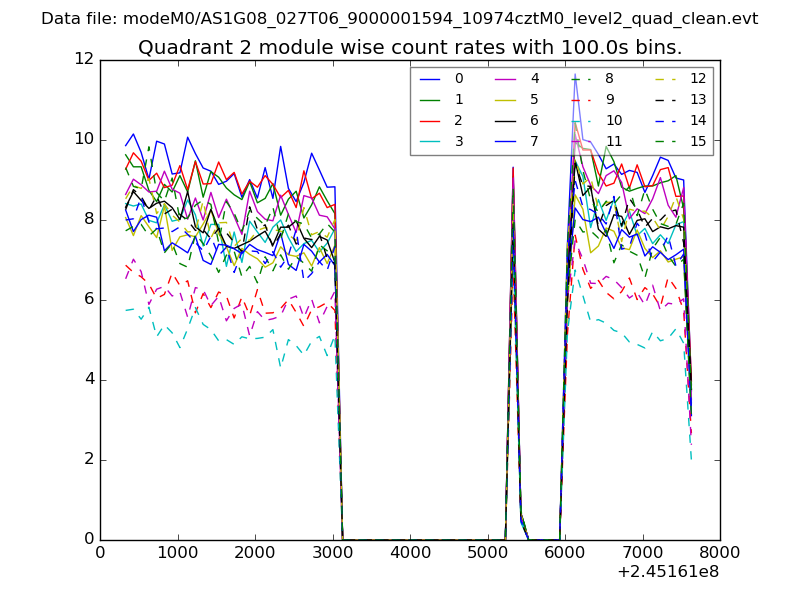 |
 |
| Module-wise count rates for Quadrant D Data is divided into 100 sec bins |
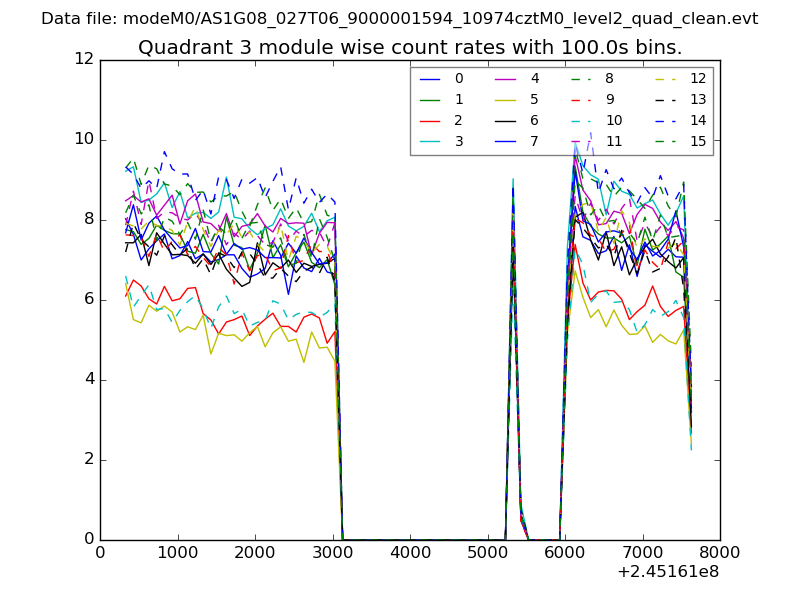 |
 |
| Parameter | Plot |
|---|---|
| CZT HV Monitor | 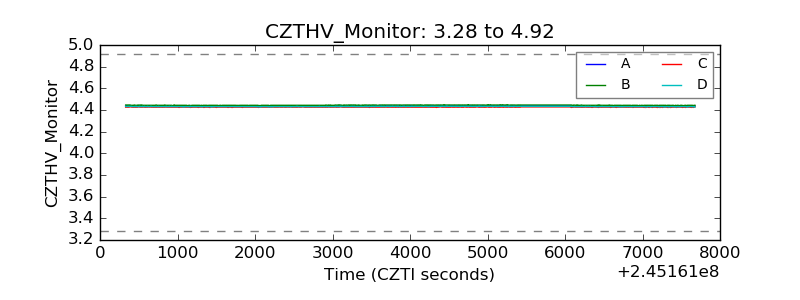 |
| D_VDD | 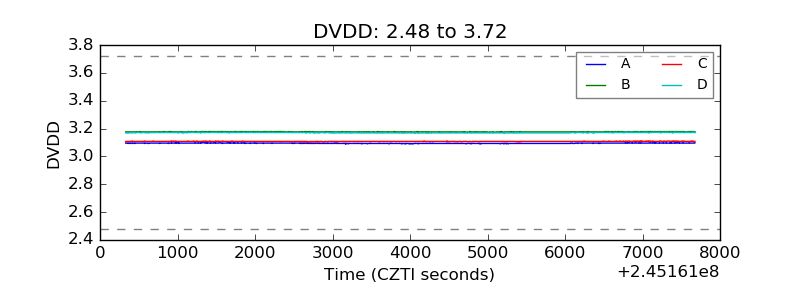 |
| Temperature 1 | 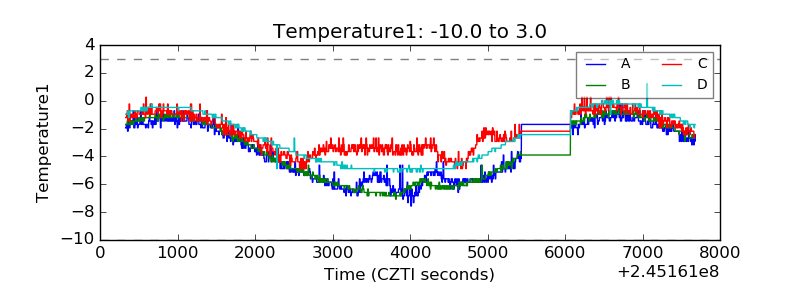 |
| Veto HV Monitor | 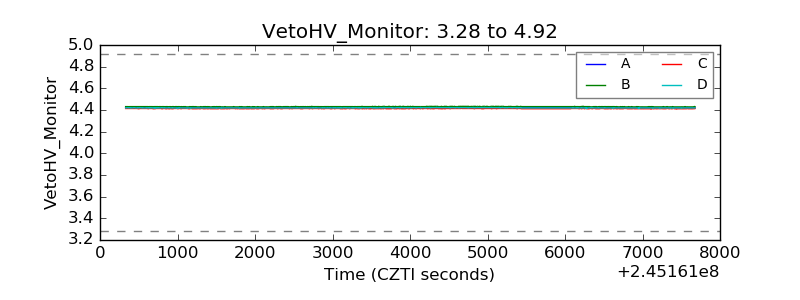 |
| Veto LLD |  |
| Alpha Counter | 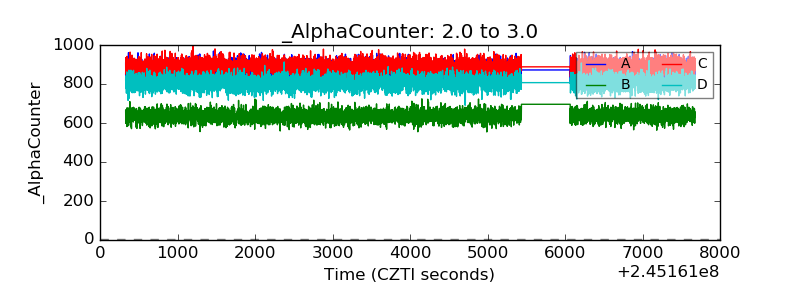 |
| _CPM_Rate | 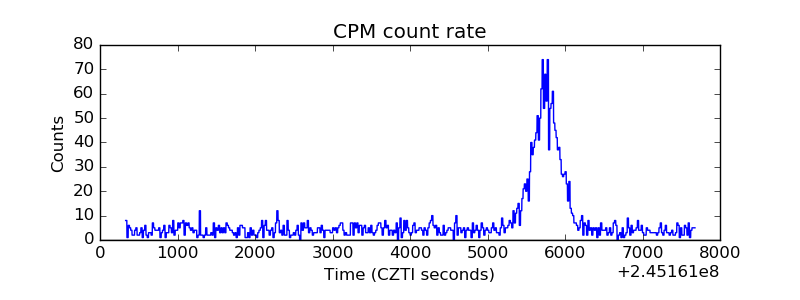 |
| CZT Counter | 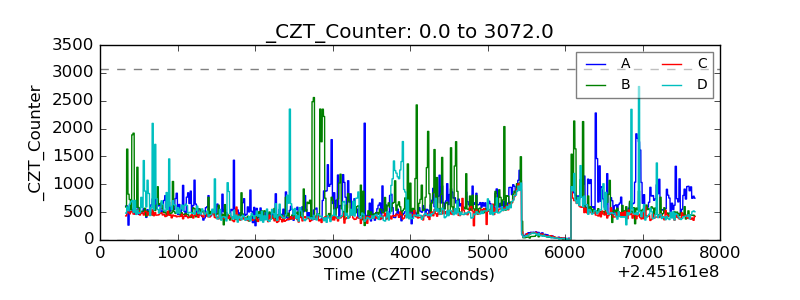 |
| +2.5 Volts monitor |  |
| +5 Volts monitor |  |
| _ROLL_ROT | 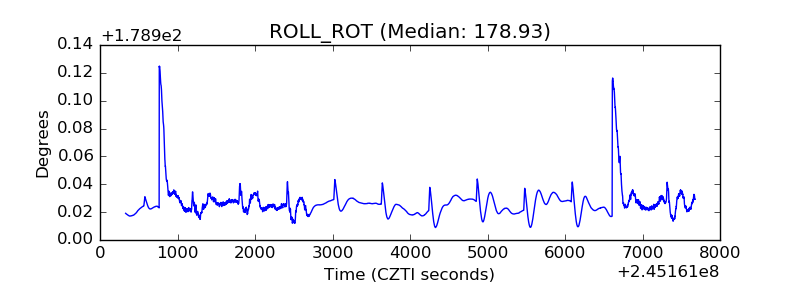 |
| _Roll_DEC | 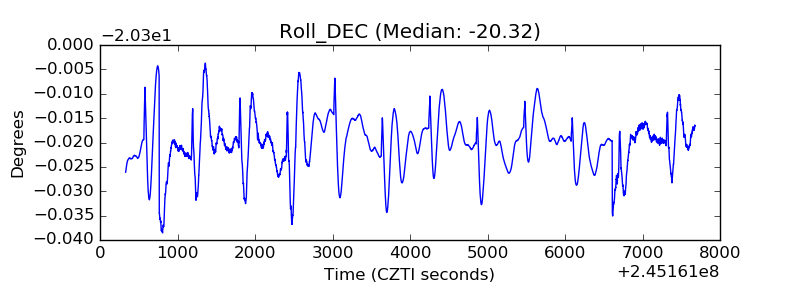 |
| _Roll_RA | 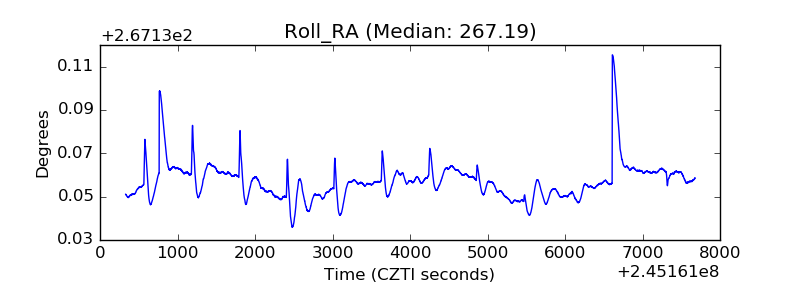 |
| Veto Counter | 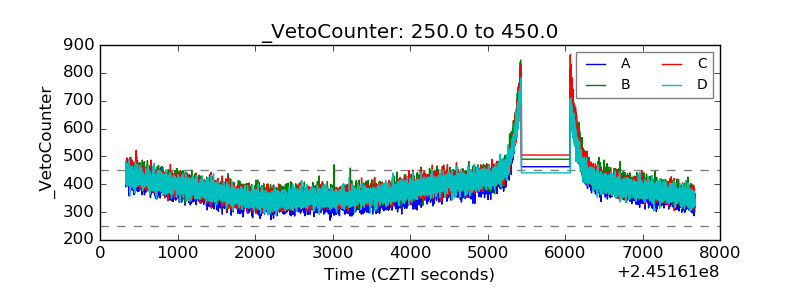 |