| Param | Original file | Final file |
|---|---|---|
| Filename | modeM0/AS1G08_027T06_9000001594_10976cztM0_level2.evt | modeM0/AS1G08_027T06_9000001594_10976cztM0_level2_quad_clean.evt |
| Size (bytes) | 626,212,800 | 98,104,320 |
| Size | 597.2 MB | 93.6 MB |
| Events in quadrant A | 5,328,998 | 621,985 |
| Events in quadrant B | 5,934,188 | 608,596 |
| Events in quadrant C | 3,301,699 | 630,023 |
| Events in quadrant D | 3,902,883 | 599,168 |
| Mode M0 | |||
|---|---|---|---|
| Quadrant | BADHDUFLAG | Total packets | Discarded packets |
| A | 0 | 20994 | 4 |
| B | 0 | 22474 | 1 |
| C | 0 | 15147 | 5 |
| D | 0 | 16803 | 1 |
| Mode SS | |||
|---|---|---|---|
| Quadrant | BADHDUFLAG | Total packets | Discarded packets |
| A | 0 | 148 | 0 |
| B | 0 | 148 | 0 |
| C | 0 | 148 | 0 |
| D | 0 | 148 | 0 |
| Quadrant | Total seconds | Saturated seconds | Saturation percentage |
|---|---|---|---|
| A | 7333 | 368 | 5.018410% |
| B | 7334 | 870 | 11.862558% |
| C | 7332 | 41 | 0.559193% |
| D | 7334 | 115 | 1.568039% |
Noise dominated data is calculated using 1-second bins in cleaned event files. If a bin has >2000 counts, and if more than 50% of those come from <1% of pixels, then it is considered to be noise-dominated and hence unusable.
| Quadrant | # 1 sec bins | Bins with >0 counts | Bins with >2000 counts | High rate bins dominated by noise | Noise dominated (total time) | Noise dominated (detector-on time) | Marked lightcurve |
|---|---|---|---|---|---|---|---|
| A | 7359 | 7335 | 164 | 164 | 2.23% | 2.24% | 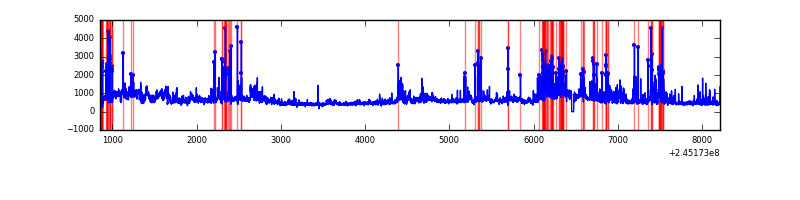 |
| B | 7359 | 7335 | 522 | 522 | 7.09% | 7.12% | 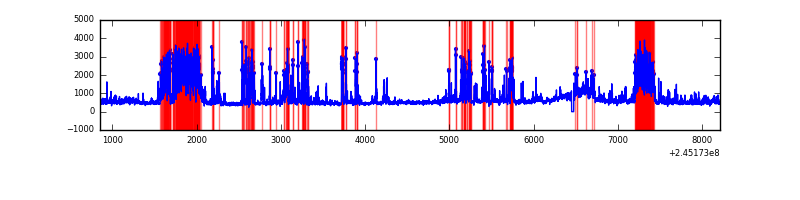 |
| C | 7359 | 7335 | 5 | 5 | 0.07% | 0.07% | 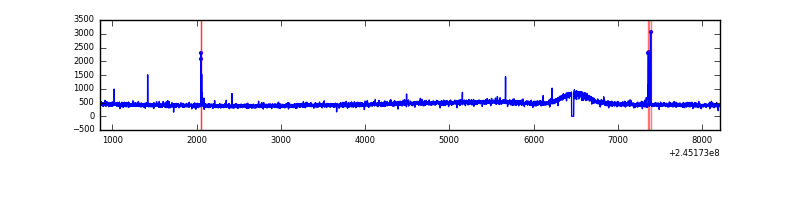 |
| D | 7359 | 7335 | 66 | 66 | 0.90% | 0.90% | 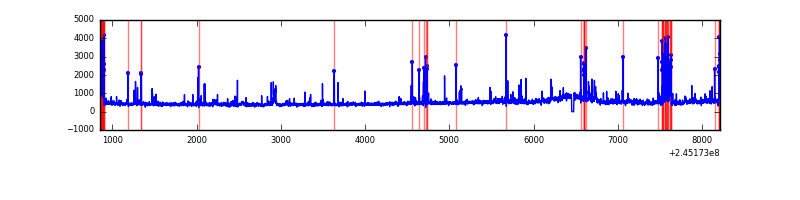 |
Top three noisy pixels from each quadrant. If the there are fewer than three noisy pixels in the level2.evt file, extra rows are filled as -1
| Pixel properties | Quadrant properties | ||||||
|---|---|---|---|---|---|---|---|
| Quadrant | DetID | PixID | Counts | Sigma | Mean | Median | Sigma |
| A | 8 | 15 | 654745 | 3715.05 | 858 | 841 | 176.0 |
| A | 15 | 223 | 640552 | 3634.41 | 858 | 841 | 176.0 |
| A | 8 | 5 | 417414 | 2366.69 | 858 | 841 | 176.0 |
| B | 4 | 239 | 2337775 | 14296.92 | 844 | 822 | 163.5 |
| B | 0 | 219 | 65236 | 394.07 | 844 | 822 | 163.5 |
| B | 15 | 204 | 46425 | 278.99 | 844 | 822 | 163.5 |
| C | 0 | 207 | 19241 | 94.66 | 836 | 839 | 194.4 |
| C | 1 | 3 | 12126 | 58.06 | 836 | 839 | 194.4 |
| C | 13 | 61 | 6384 | 28.52 | 836 | 839 | 194.4 |
| D | 8 | 195 | 209271 | 1027.08 | 833 | 809 | 203.0 |
| D | 13 | 104 | 107491 | 525.62 | 833 | 809 | 203.0 |
| D | 13 | 152 | 87137 | 425.33 | 833 | 809 | 203.0 |
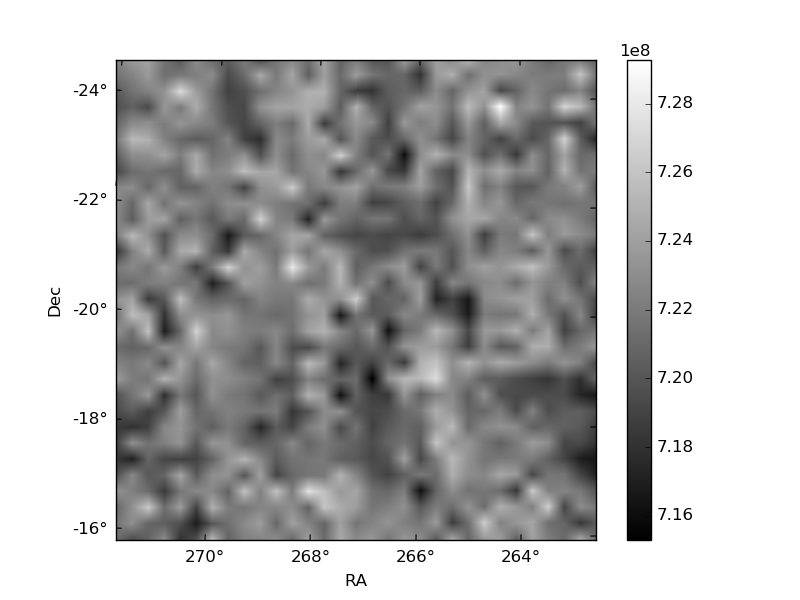
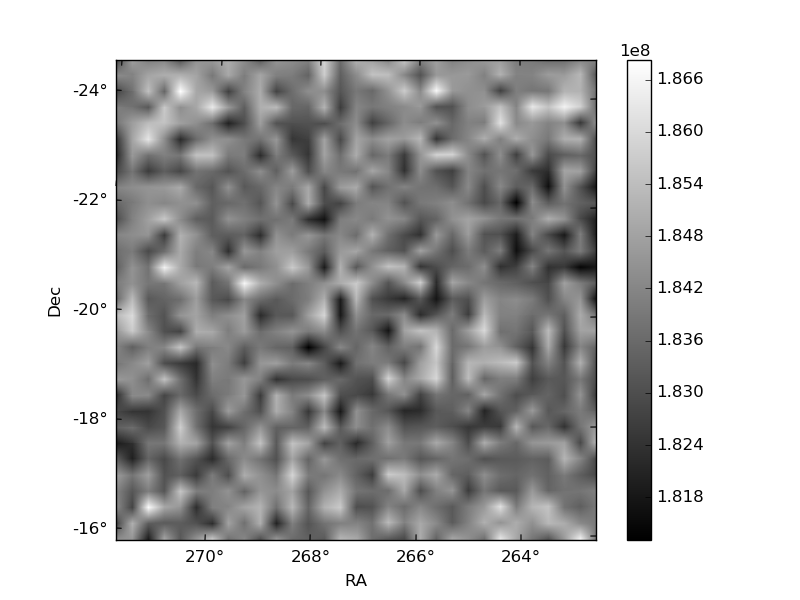
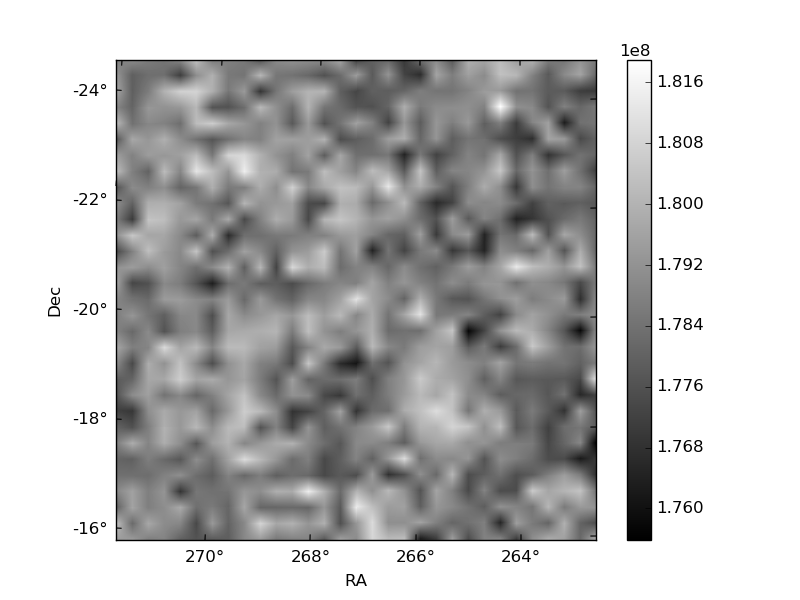
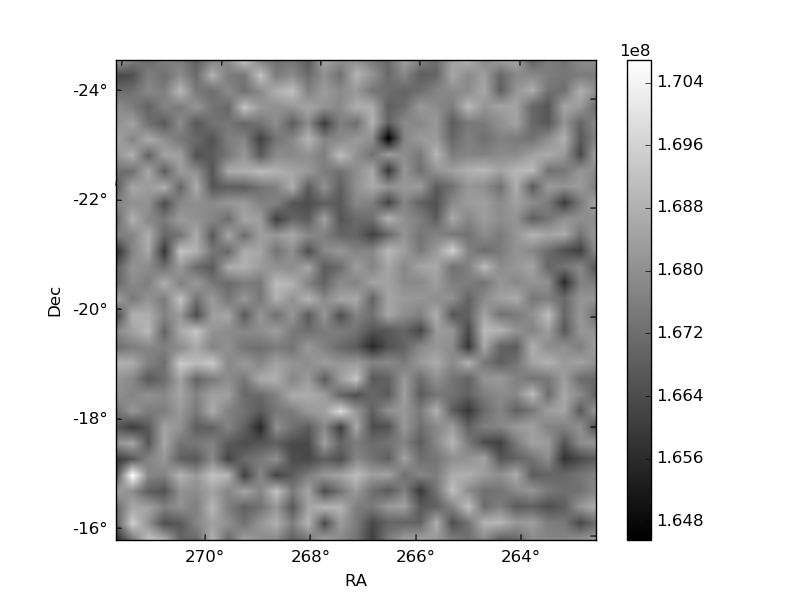
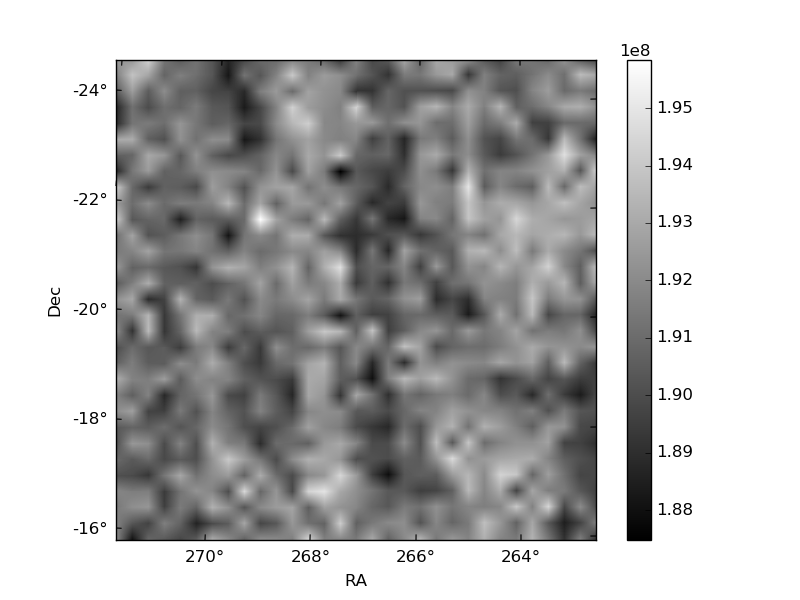
Histogram calculated using DETX and DETY for each event in the final _common_clean file
| Quadrant A | 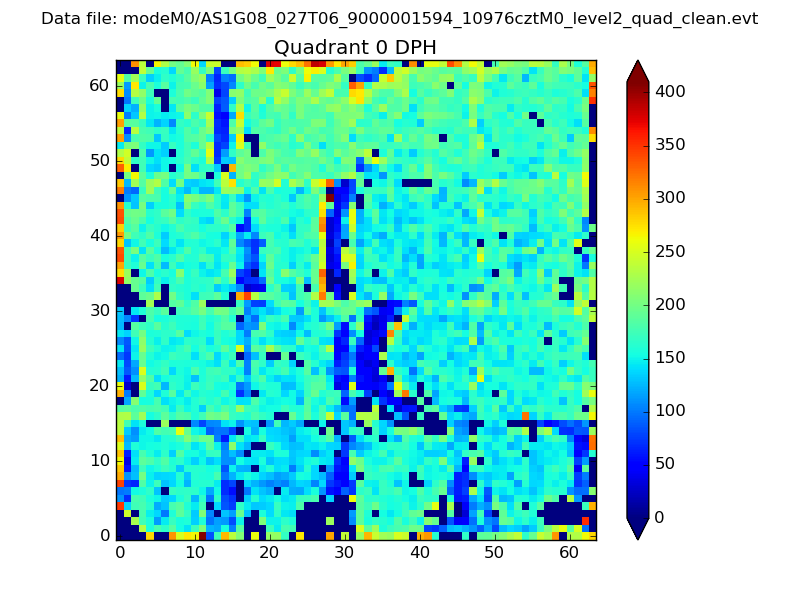 |
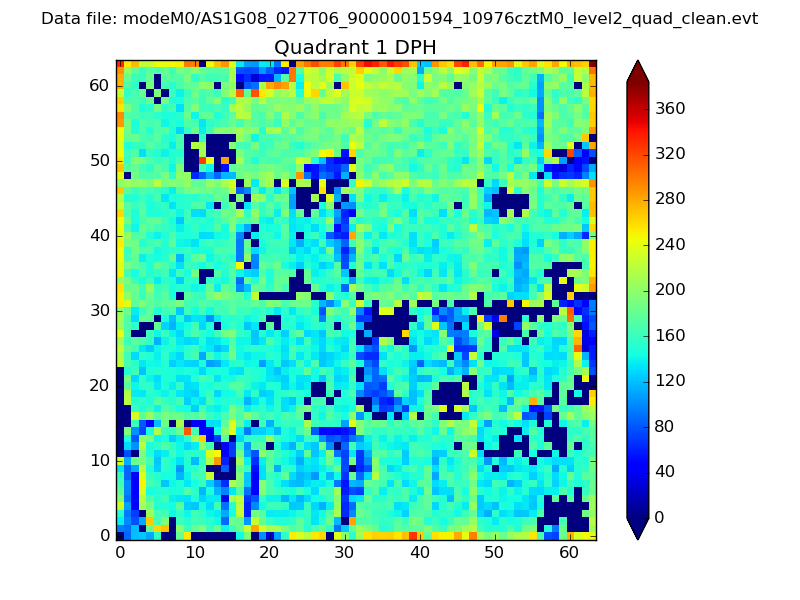 |
Quadrant B |
|---|---|---|---|
| Quadrant D | 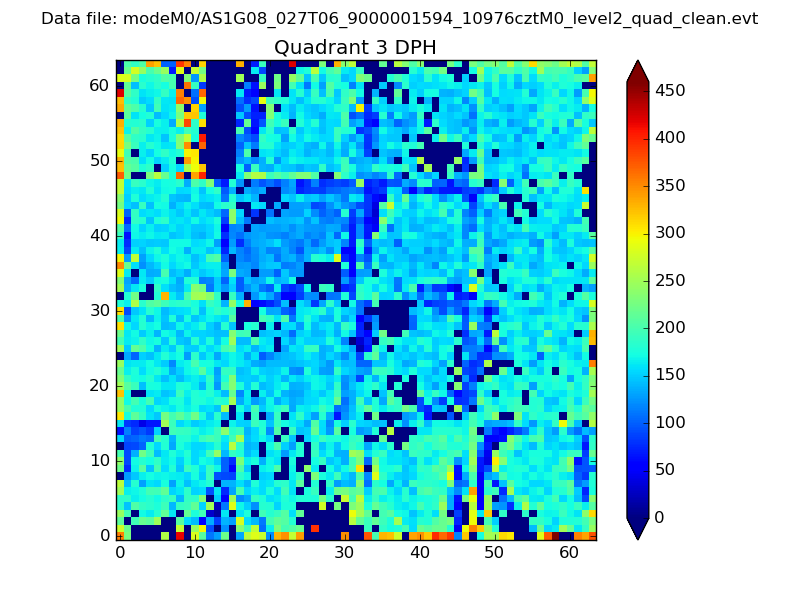 |
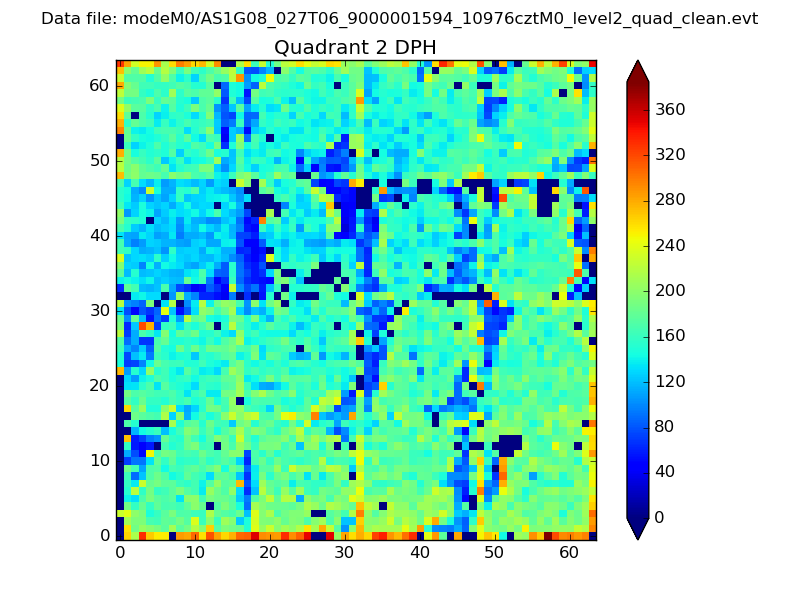 |
Quadrant C |
| Plot type | Count rate plots | Images |
|---|---|---|
| Comparison with Poisson distribution Blue bars denote a histogram of data divided into 1 sec bins. Red curve is a Poisson curve with rate = median count rate of data. |
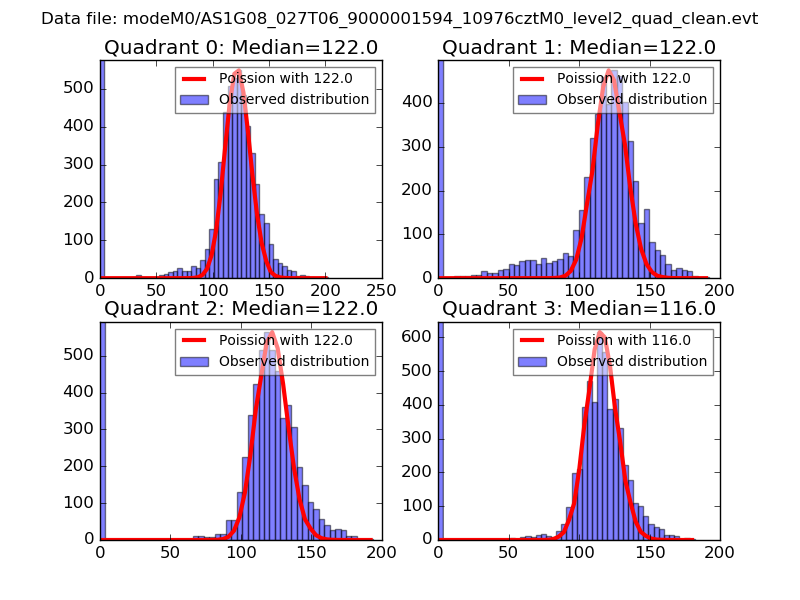 |
 |
| Quadrant-wise count rates Data is divided into 100 sec bins |
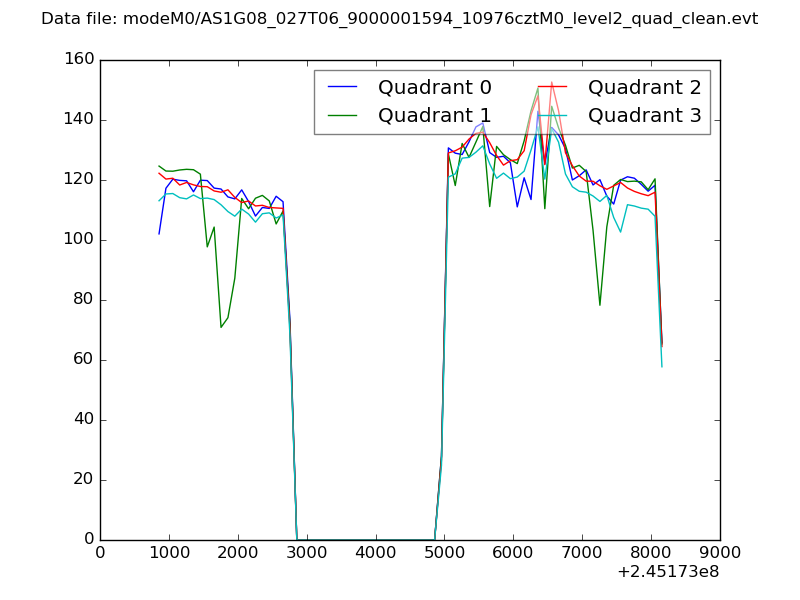 |
|
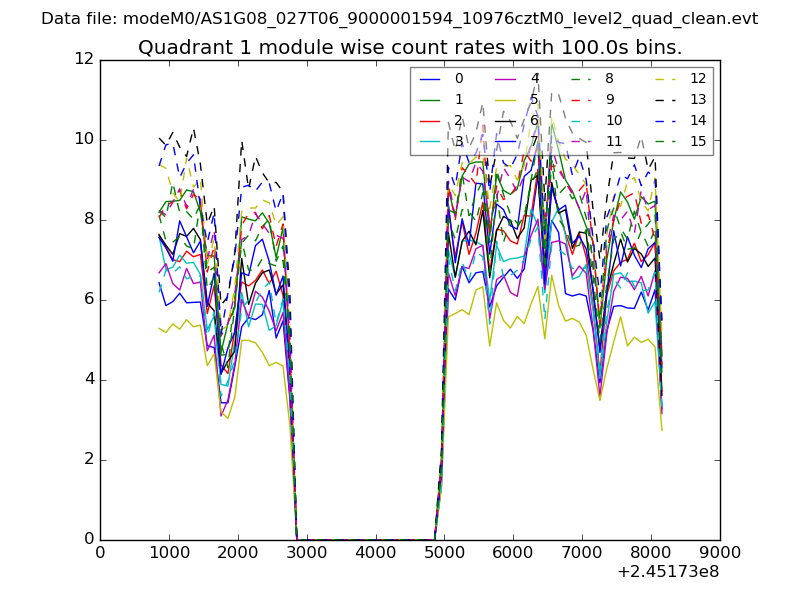
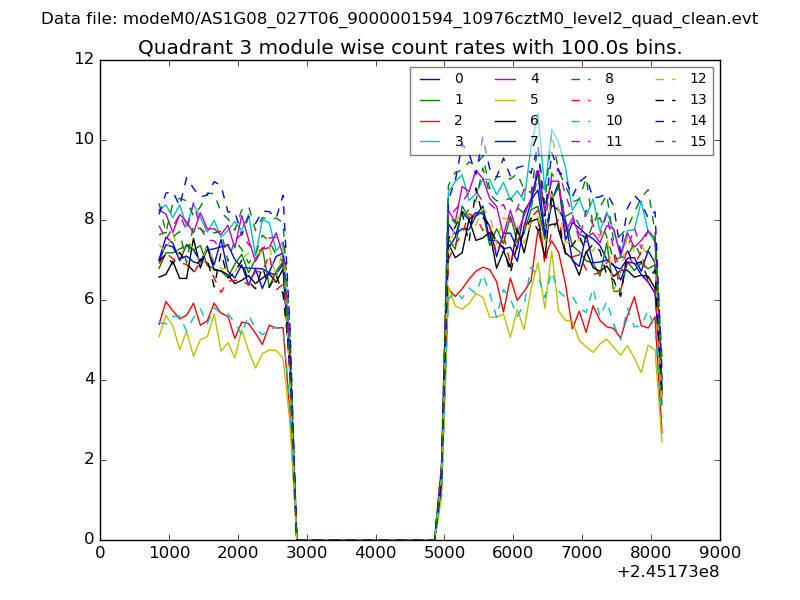
| Module-wise count rates for Quadrant A Data is divided into 100 sec bins |
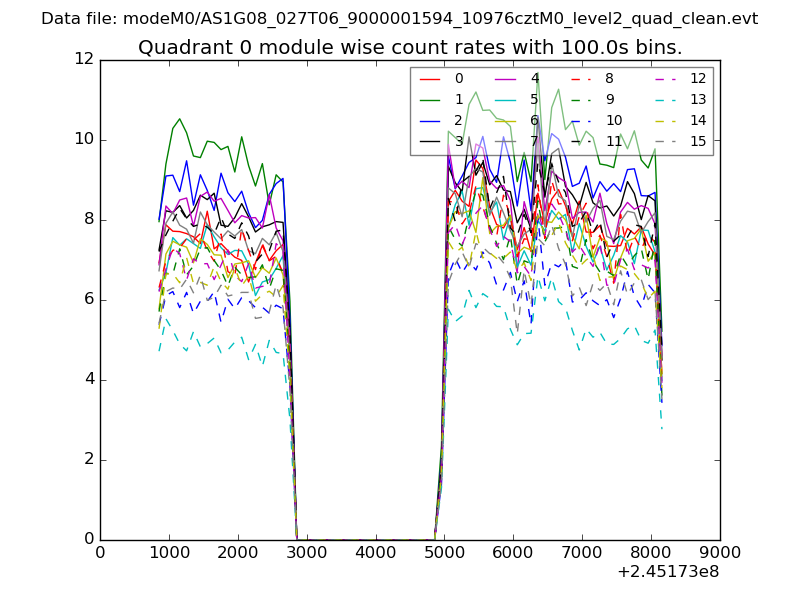 |
 |
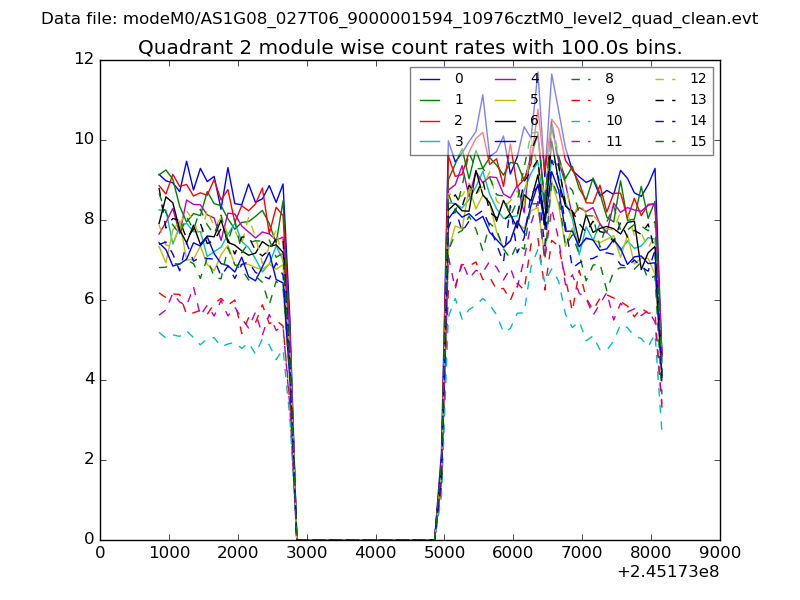
| Module-wise count rates for Quadrant B Data is divided into 100 sec bins |
 |
 |
| Module-wise count rates for Quadrant C Data is divided into 100 sec bins |
 |
 |
| Module-wise count rates for Quadrant D Data is divided into 100 sec bins |
 |
 |
| Parameter | Plot |
|---|---|
| CZT HV Monitor | 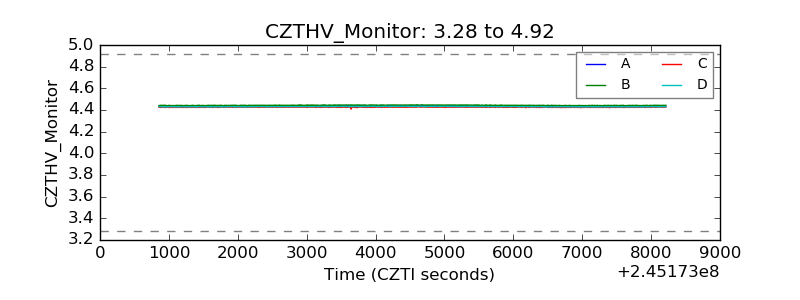 |
| D_VDD | 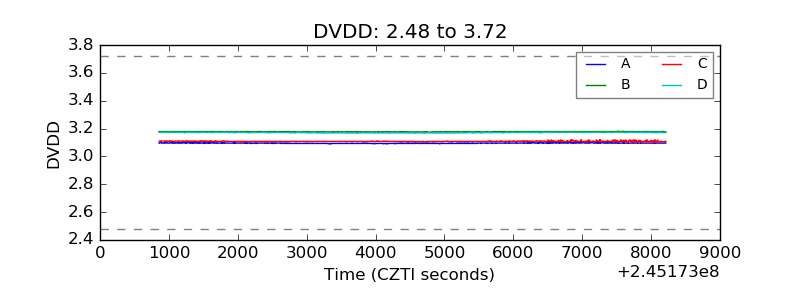 |
| Temperature 1 | 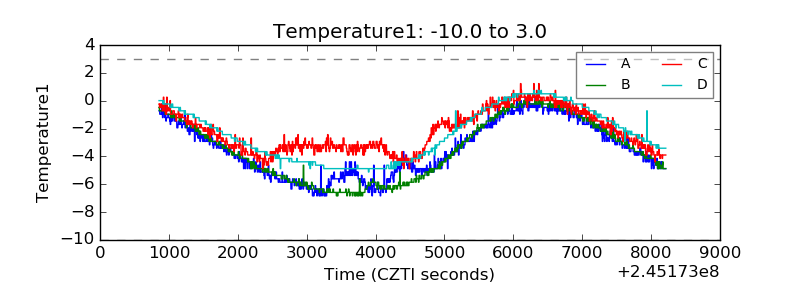 |
| Veto HV Monitor | 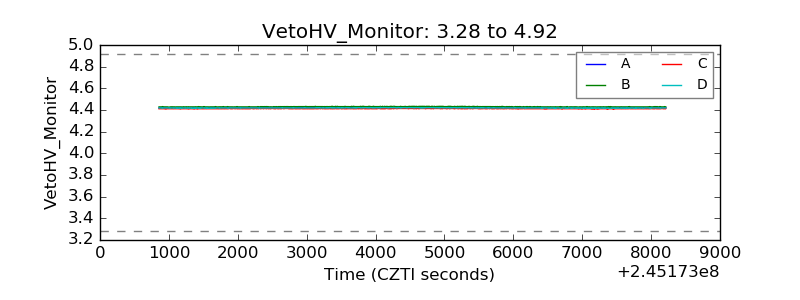 |
| Veto LLD | 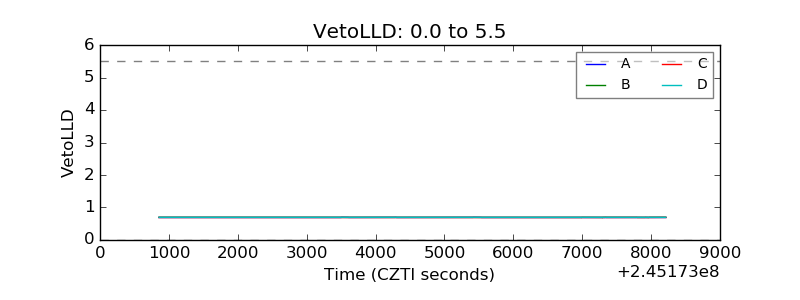 |
| Alpha Counter | 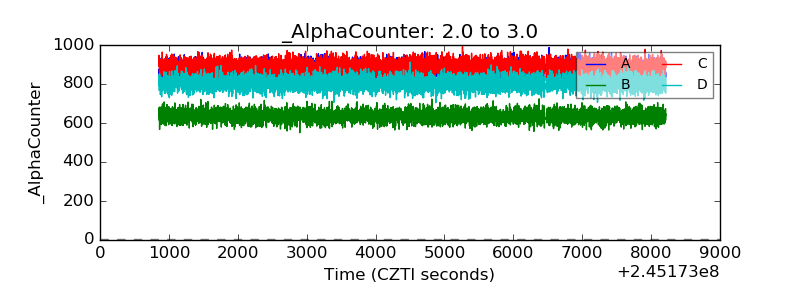 |
| _CPM_Rate | 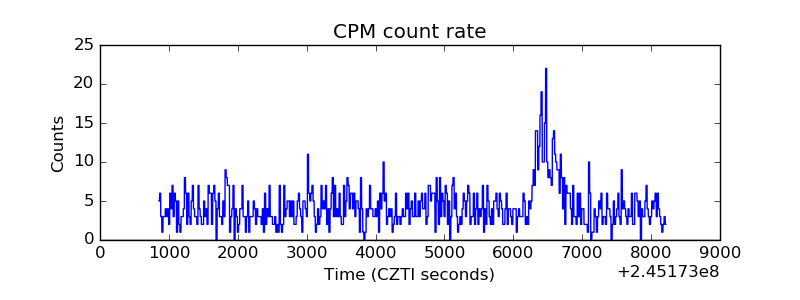 |
| CZT Counter | 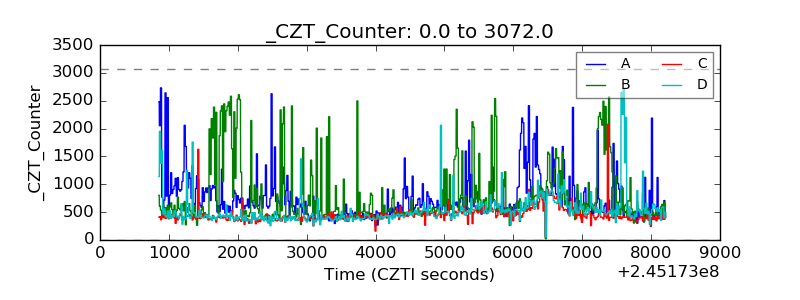 |
| +2.5 Volts monitor |  |
| +5 Volts monitor |  |
| _ROLL_ROT | 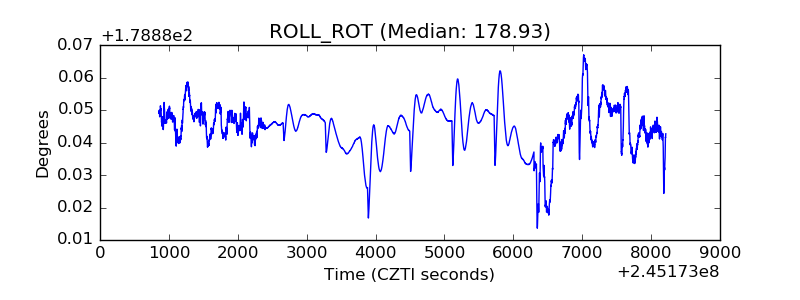 |
| _Roll_DEC | 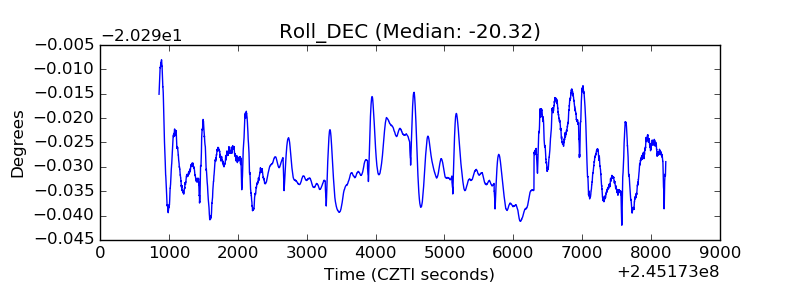 |
| _Roll_RA | 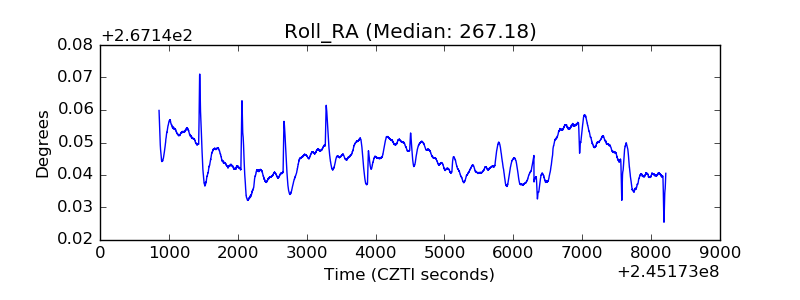 |
| Veto Counter | 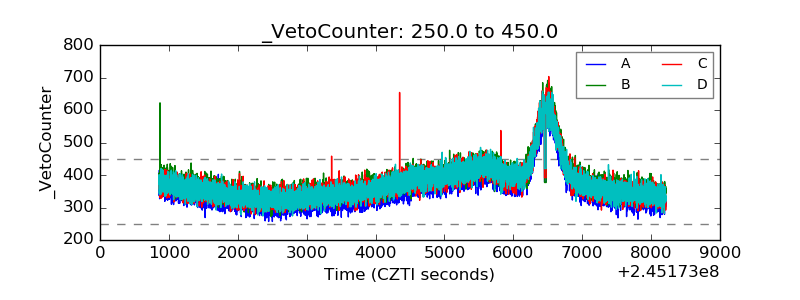 |