| Param | Original file | Final file |
|---|---|---|
| Filename | modeM0/AS1G08_027T06_9000001594_10979cztM0_level2.evt | modeM0/AS1G08_027T06_9000001594_10979cztM0_level2_quad_clean.evt |
| Size (bytes) | 1,093,141,440 | 144,195,840 |
| Size | 1.0 GB | 137.5 MB |
| Events in quadrant A | 11,188,708 | 887,777 |
| Events in quadrant B | 8,910,097 | 888,105 |
| Events in quadrant C | 5,188,328 | 915,007 |
| Events in quadrant D | 7,019,691 | 856,536 |
| Mode M9 | |||
|---|---|---|---|
| Quadrant | BADHDUFLAG | Total packets | Discarded packets |
| A | 0 | 16 | 0 |
| B | 0 | 16 | 0 |
| C | 0 | 16 | 0 |
| D | 0 | 16 | 0 |
| Mode M0 | |||
|---|---|---|---|
| Quadrant | BADHDUFLAG | Total packets | Discarded packets |
| A | 0 | 41207 | 4 |
| B | 0 | 34251 | 3 |
| C | 0 | 23964 | 3 |
| D | 0 | 28962 | 3 |
| Mode SS | |||
|---|---|---|---|
| Quadrant | BADHDUFLAG | Total packets | Discarded packets |
| A | 0 | 246 | 0 |
| B | 0 | 246 | 0 |
| C | 0 | 246 | 0 |
| D | 0 | 246 | 0 |
| Quadrant | Total seconds | Saturated seconds | Saturation percentage |
|---|---|---|---|
| A | 11830 | 1569 | 13.262891% |
| B | 11830 | 1093 | 9.239222% |
| C | 11830 | 24 | 0.202874% |
| D | 11830 | 250 | 2.113271% |
Noise dominated data is calculated using 1-second bins in cleaned event files. If a bin has >2000 counts, and if more than 50% of those come from <1% of pixels, then it is considered to be noise-dominated and hence unusable.
| Quadrant | # 1 sec bins | Bins with >0 counts | Bins with >2000 counts | High rate bins dominated by noise | Noise dominated (total time) | Noise dominated (detector-on time) | Marked lightcurve |
|---|---|---|---|---|---|---|---|
| A | 13545 | 11833 | 1253 | 1253 | 9.25% | 10.59% | 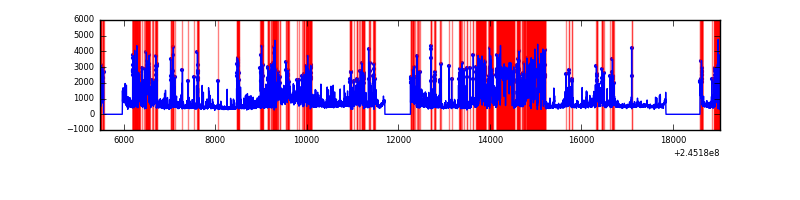 |
| B | 13545 | 11833 | 682 | 682 | 5.04% | 5.76% |  |
| C | 13545 | 11833 | 0 | 0 | 0.00% | 0.00% | 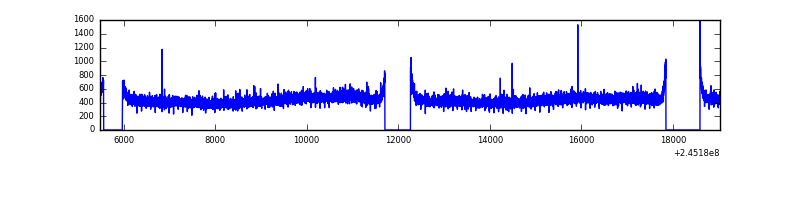 |
| D | 13545 | 11833 | 211 | 211 | 1.56% | 1.78% | 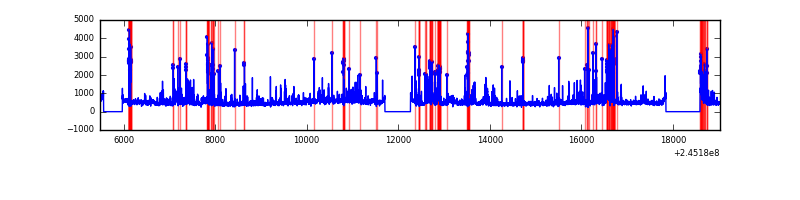 |
Top three noisy pixels from each quadrant. If the there are fewer than three noisy pixels in the level2.evt file, extra rows are filled as -1
| Pixel properties | Quadrant properties | ||||||
|---|---|---|---|---|---|---|---|
| Quadrant | DetID | PixID | Counts | Sigma | Mean | Median | Sigma |
| A | 15 | 223 | 3038810 | 11473.06 | 1300 | 1272 | 264.8 |
| A | 8 | 5 | 1748196 | 6598.29 | 1300 | 1272 | 264.8 |
| A | 15 | 239 | 1115893 | 4210.03 | 1300 | 1272 | 264.8 |
| B | 4 | 239 | 3359620 | 13077.57 | 1340 | 1311 | 256.8 |
| B | 0 | 214 | 100823 | 387.51 | 1340 | 1311 | 256.8 |
| B | 15 | 36 | 45241 | 171.07 | 1340 | 1311 | 256.8 |
| C | 13 | 61 | 10019 | 28.1 | 1328 | 1333 | 309.1 |
| C | 12 | 4 | 5868 | 14.67 | 1328 | 1333 | 309.1 |
| C | 8 | 222 | 4913 | 11.58 | 1328 | 1333 | 309.1 |
| D | 1 | 52 | 1289973 | 4000.79 | 1311 | 1271 | 322.1 |
| D | 8 | 195 | 374653 | 1159.17 | 1311 | 1271 | 322.1 |
| D | 13 | 104 | 131094 | 403.04 | 1311 | 1271 | 322.1 |
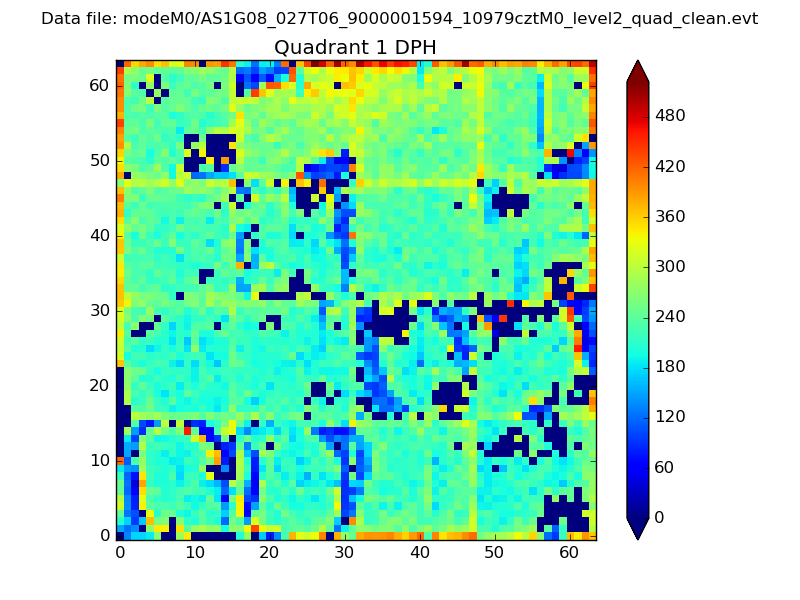
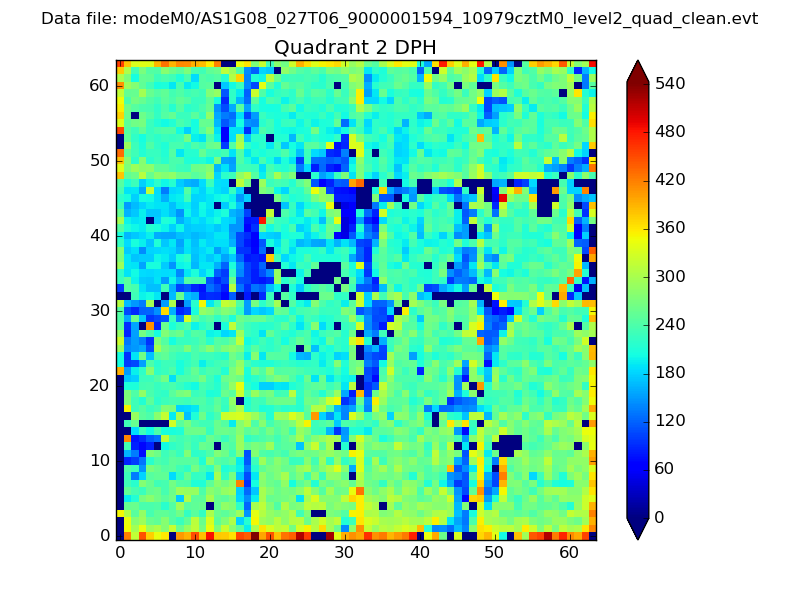
Histogram calculated using DETX and DETY for each event in the final _common_clean file
| Quadrant A | 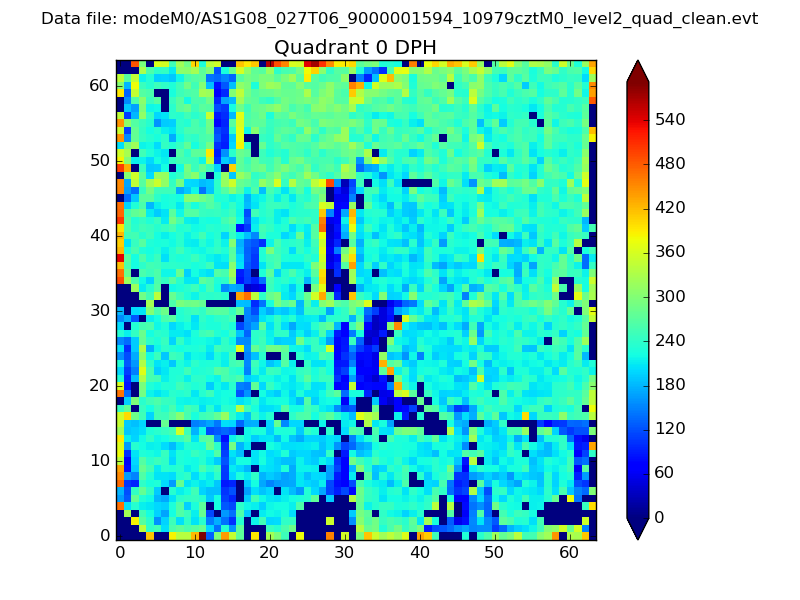 |
 |
Quadrant B |
|---|---|---|---|
| Quadrant D | 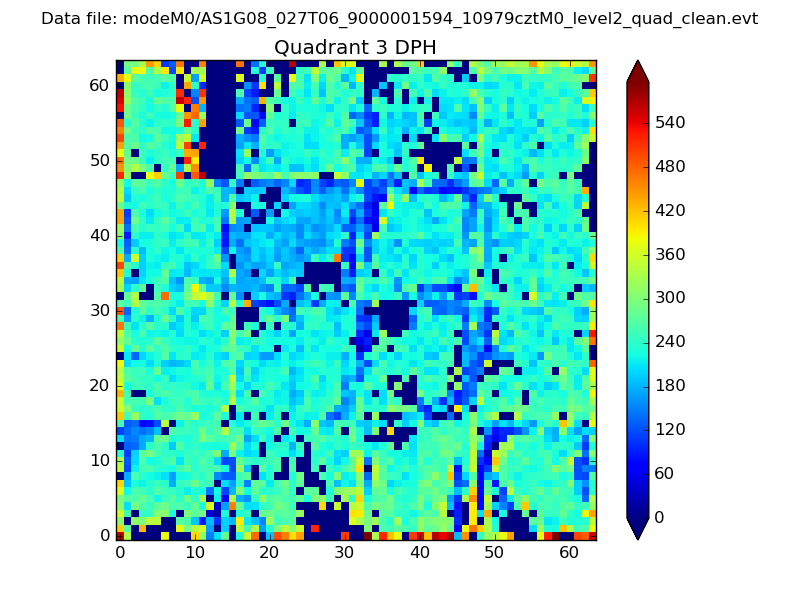 |
 |
Quadrant C |
| Plot type | Count rate plots | Images |
|---|---|---|
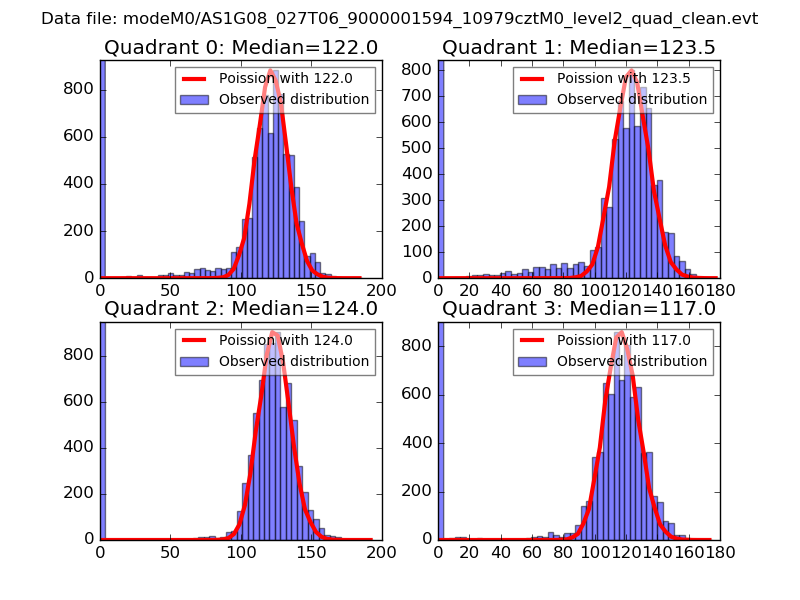
| Comparison with Poisson distribution Blue bars denote a histogram of data divided into 1 sec bins. Red curve is a Poisson curve with rate = median count rate of data. |
 |
 |
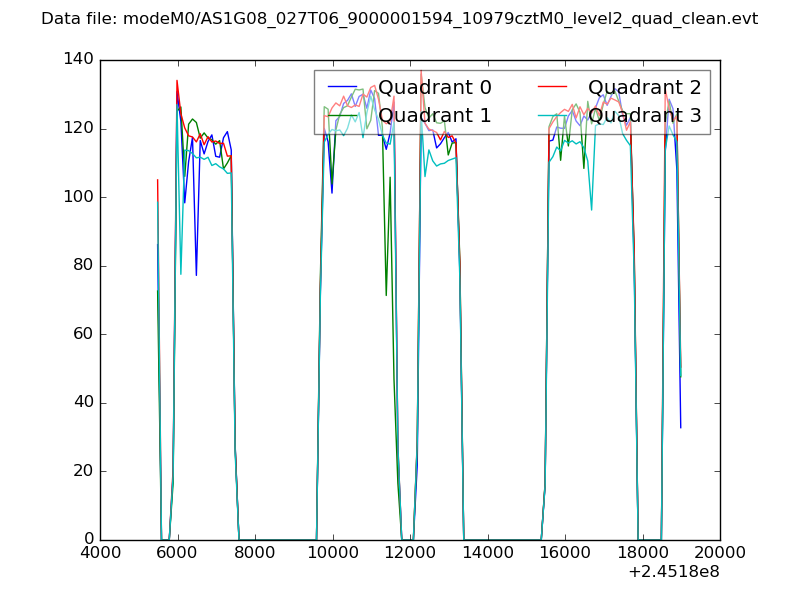
| Quadrant-wise count rates Data is divided into 100 sec bins |
 |
|
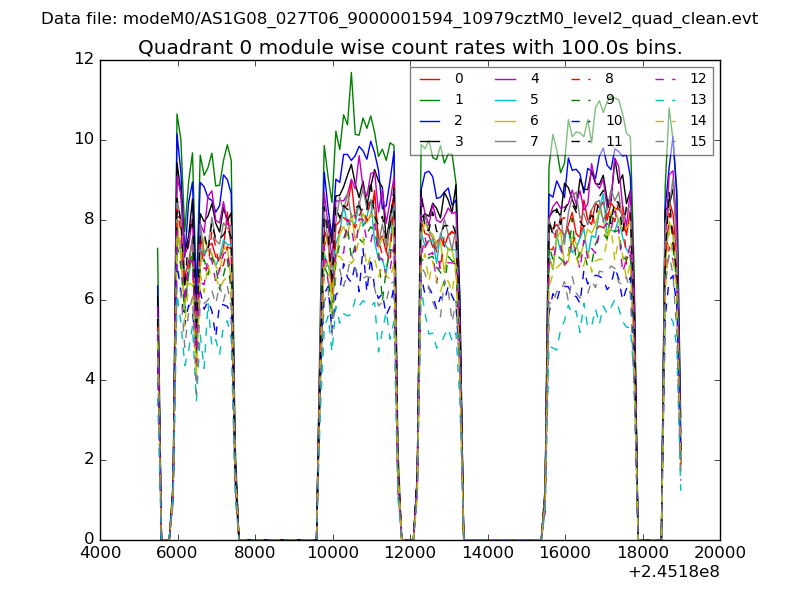
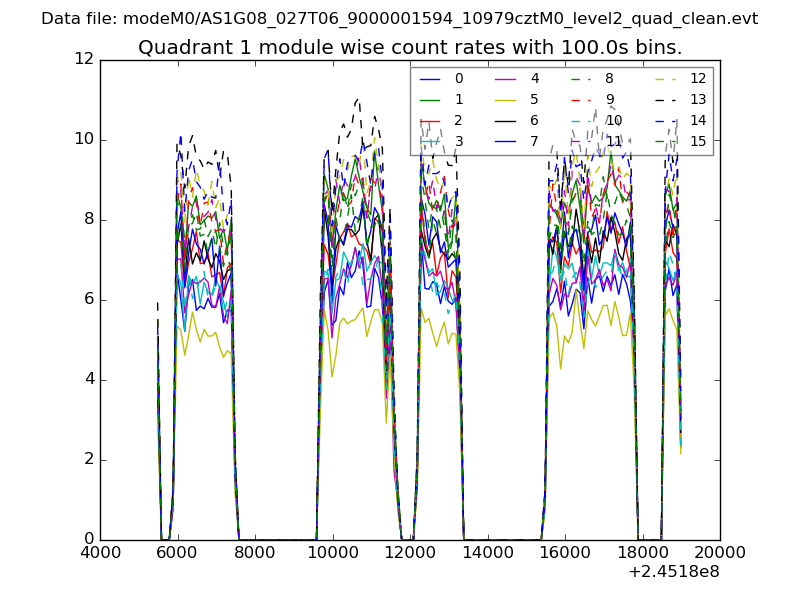
| Module-wise count rates for Quadrant A Data is divided into 100 sec bins |
 |
 |
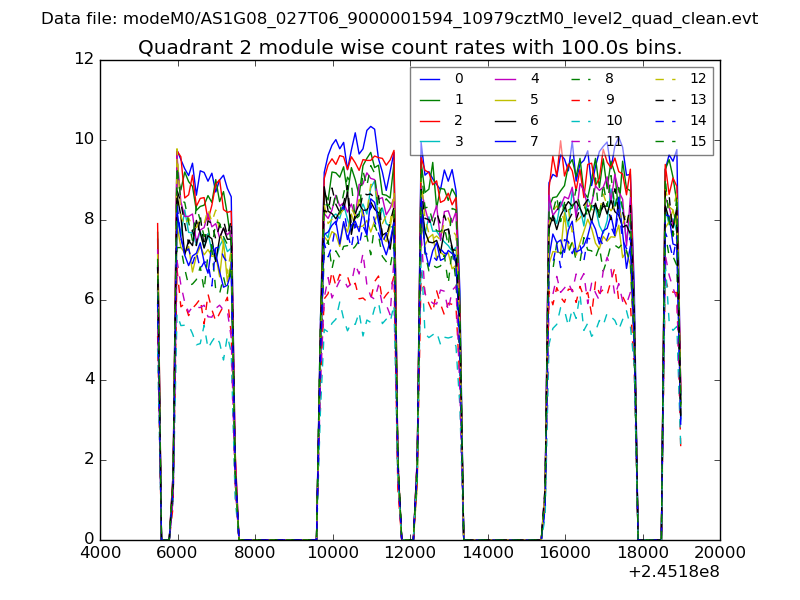
| Module-wise count rates for Quadrant B Data is divided into 100 sec bins |
 |
 |
| Module-wise count rates for Quadrant C Data is divided into 100 sec bins |
 |
 |
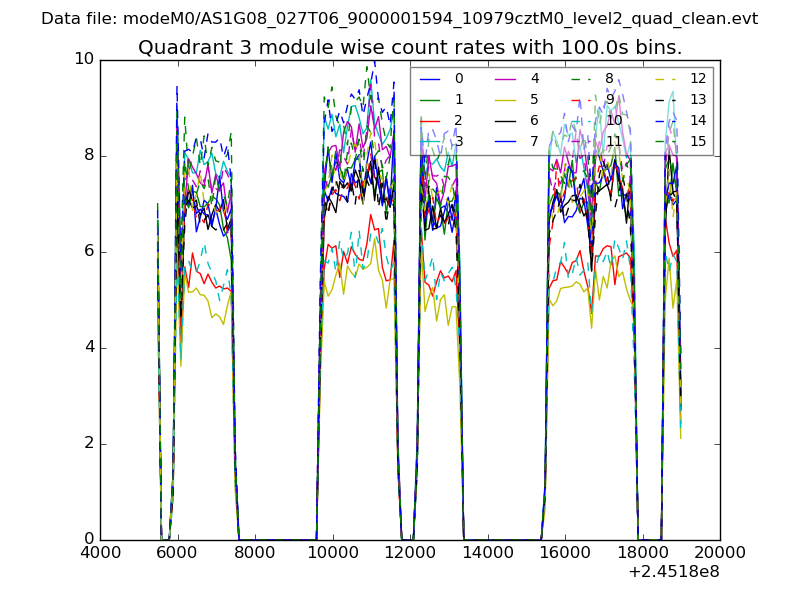
| Module-wise count rates for Quadrant D Data is divided into 100 sec bins |
 |
 |
| Parameter | Plot |
|---|---|
| CZT HV Monitor | 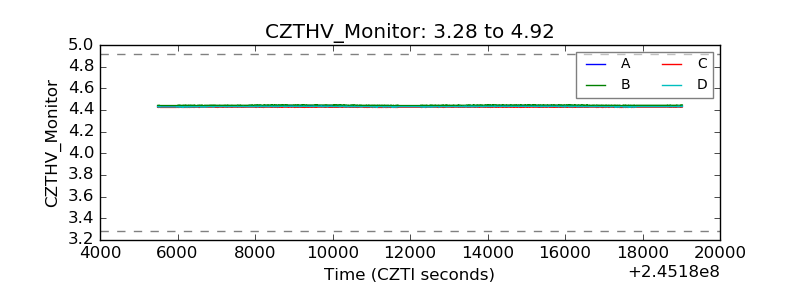 |
| D_VDD | 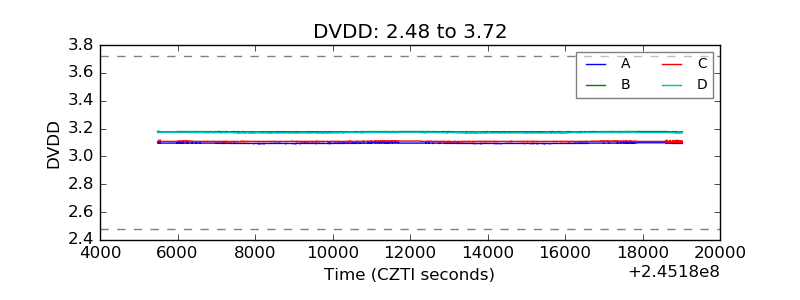 |
| Temperature 1 | 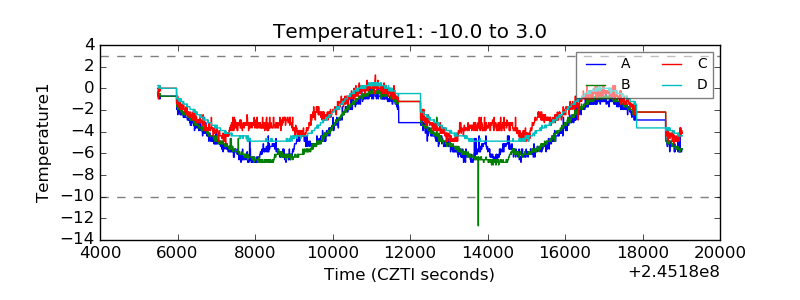 |
| Veto HV Monitor | 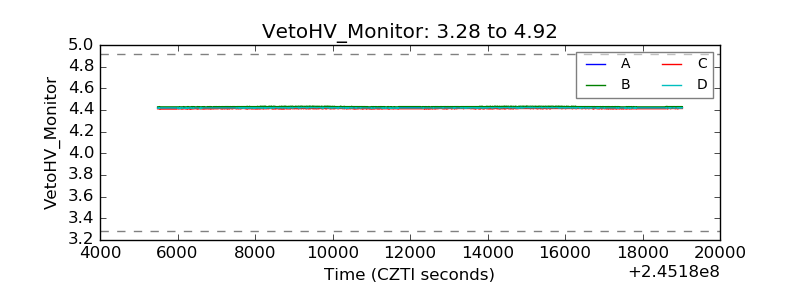 |
| Veto LLD | 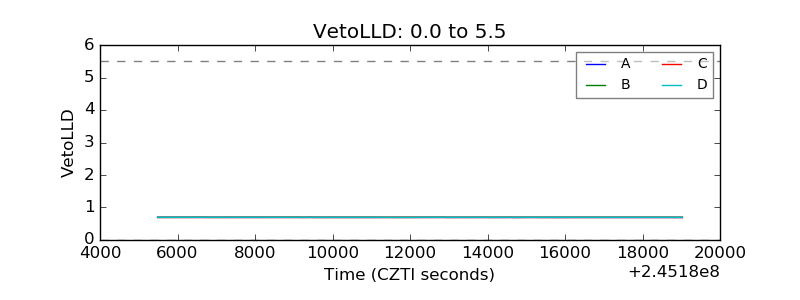 |
| Alpha Counter | 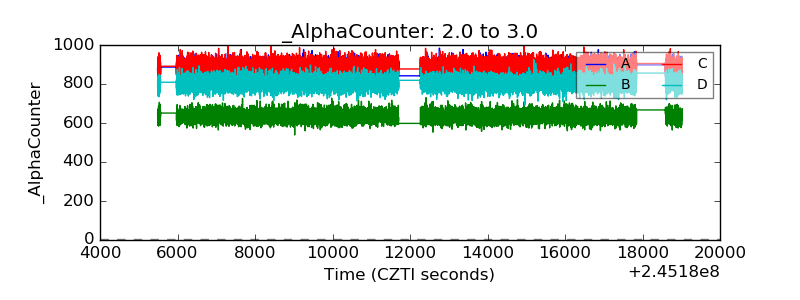 |
| _CPM_Rate | 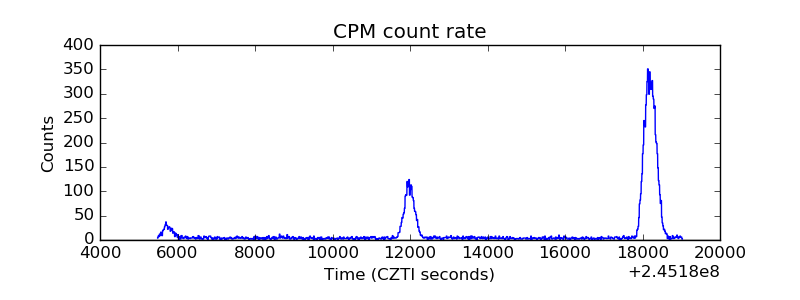 |
| CZT Counter | 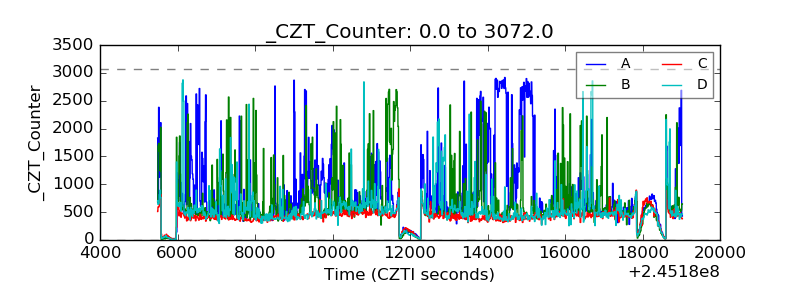 |
| +2.5 Volts monitor |  |
| +5 Volts monitor |  |
| _ROLL_ROT | 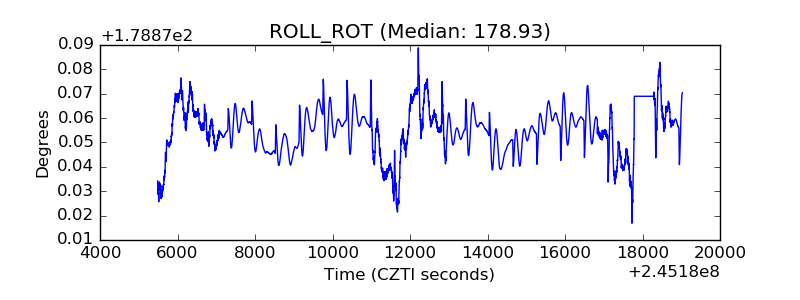 |
| _Roll_DEC | 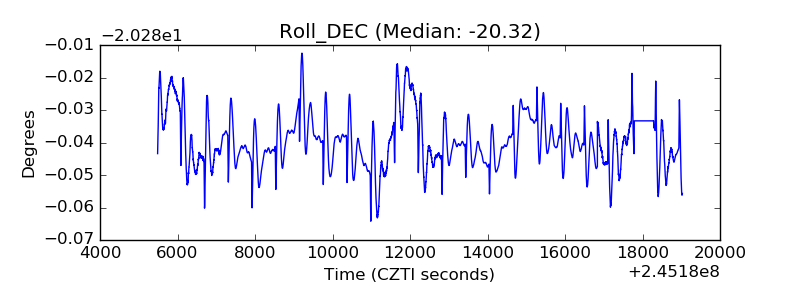 |
| _Roll_RA | 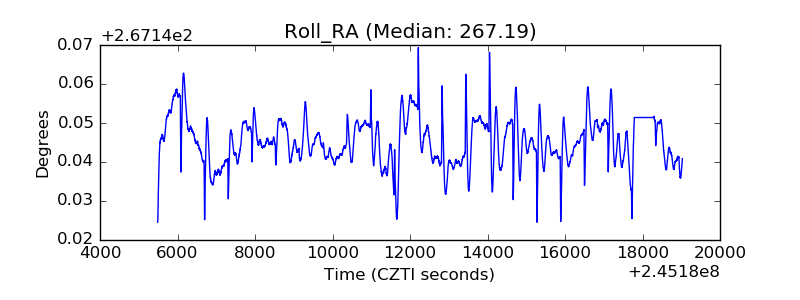 |
| Veto Counter | 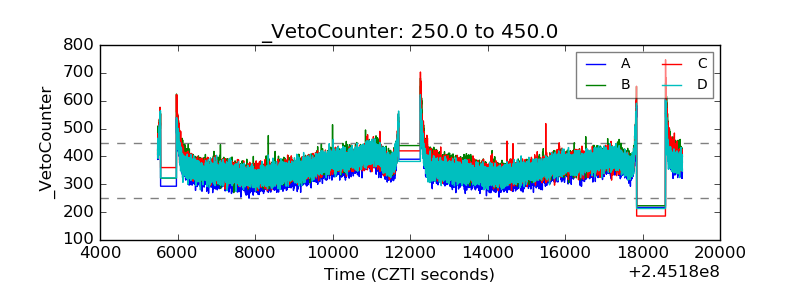 |