| Param | Original file | Final file |
|---|---|---|
| Filename | modeM0/AS1G08_027T06_9000001594_10980cztM0_level2.evt | modeM0/AS1G08_027T06_9000001594_10980cztM0_level2_quad_clean.evt |
| Size (bytes) | 532,863,360 | 71,251,200 |
| Size | 508.2 MB | 68.0 MB |
| Events in quadrant A | 3,948,744 | 416,359 |
| Events in quadrant B | 4,685,489 | 426,436 |
| Events in quadrant C | 3,114,199 | 426,973 |
| Events in quadrant D | 3,916,575 | 402,217 |
| Mode M9 | |||
|---|---|---|---|
| Quadrant | BADHDUFLAG | Total packets | Discarded packets |
| A | 0 | 17 | 0 |
| B | 0 | 17 | 0 |
| C | 0 | 17 | 0 |
| D | 0 | 17 | 0 |
| Mode M0 | |||
|---|---|---|---|
| Quadrant | BADHDUFLAG | Total packets | Discarded packets |
| A | 0 | 16439 | 3 |
| B | 0 | 18459 | 2 |
| C | 0 | 14207 | 2 |
| D | 0 | 16321 | 2 |
| Mode SS | |||
|---|---|---|---|
| Quadrant | BADHDUFLAG | Total packets | Discarded packets |
| A | 0 | 142 | 0 |
| B | 0 | 142 | 0 |
| C | 0 | 142 | 0 |
| D | 0 | 142 | 0 |
| Quadrant | Total seconds | Saturated seconds | Saturation percentage |
|---|---|---|---|
| A | 6969 | 333 | 4.778304% |
| B | 6969 | 406 | 5.825800% |
| C | 6969 | 30 | 0.430478% |
| D | 6969 | 205 | 2.941599% |
Noise dominated data is calculated using 1-second bins in cleaned event files. If a bin has >2000 counts, and if more than 50% of those come from <1% of pixels, then it is considered to be noise-dominated and hence unusable.
| Quadrant | # 1 sec bins | Bins with >0 counts | Bins with >2000 counts | High rate bins dominated by noise | Noise dominated (total time) | Noise dominated (detector-on time) | Marked lightcurve |
|---|---|---|---|---|---|---|---|
| A | 8635 | 6971 | 262 | 262 | 3.03% | 3.76% | 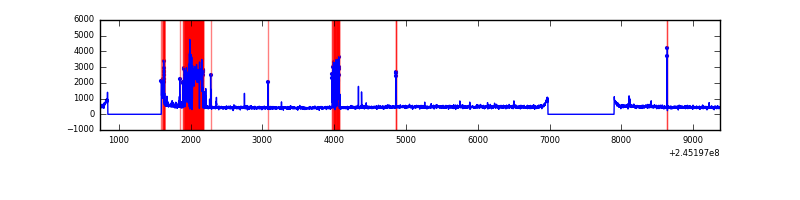 |
| B | 8635 | 6970 | 224 | 224 | 2.59% | 3.21% | 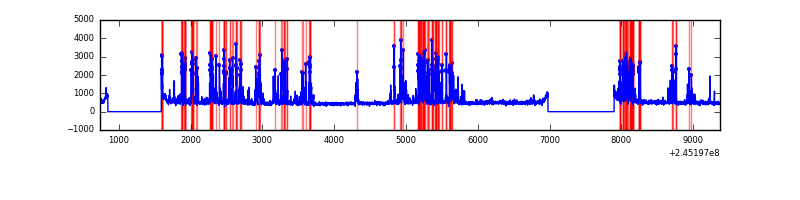 |
| C | 8635 | 6971 | 1 | 1 | 0.01% | 0.01% | 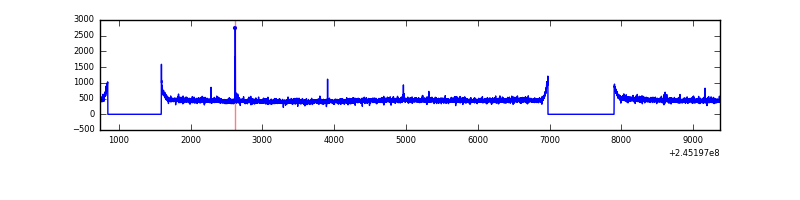 |
| D | 8635 | 6971 | 153 | 153 | 1.77% | 2.19% | 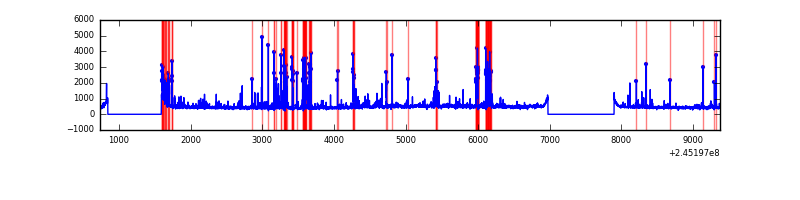 |
Top three noisy pixels from each quadrant. If the there are fewer than three noisy pixels in the level2.evt file, extra rows are filled as -1
| Pixel properties | Quadrant properties | ||||||
|---|---|---|---|---|---|---|---|
| Quadrant | DetID | PixID | Counts | Sigma | Mean | Median | Sigma |
| A | 15 | 223 | 330503 | 2005.54 | 806 | 788 | 164.4 |
| A | 8 | 5 | 262342 | 1590.94 | 806 | 788 | 164.4 |
| A | 15 | 239 | 210705 | 1276.85 | 806 | 788 | 164.4 |
| B | 4 | 239 | 1349075 | 8653.8 | 813 | 794 | 155.8 |
| B | 0 | 214 | 75886 | 481.97 | 813 | 794 | 155.8 |
| B | 4 | 81 | 30083 | 187.99 | 813 | 794 | 155.8 |
| C | 1 | 3 | 12145 | 60.87 | 795 | 798 | 186.4 |
| C | 13 | 61 | 5849 | 27.09 | 795 | 798 | 186.4 |
| C | 12 | 4 | 3803 | 16.12 | 795 | 798 | 186.4 |
| D | 1 | 52 | 714788 | 3738.56 | 778 | 753 | 191.0 |
| D | 8 | 195 | 83538 | 433.44 | 778 | 753 | 191.0 |
| D | 10 | 253 | 41290 | 212.24 | 778 | 753 | 191.0 |
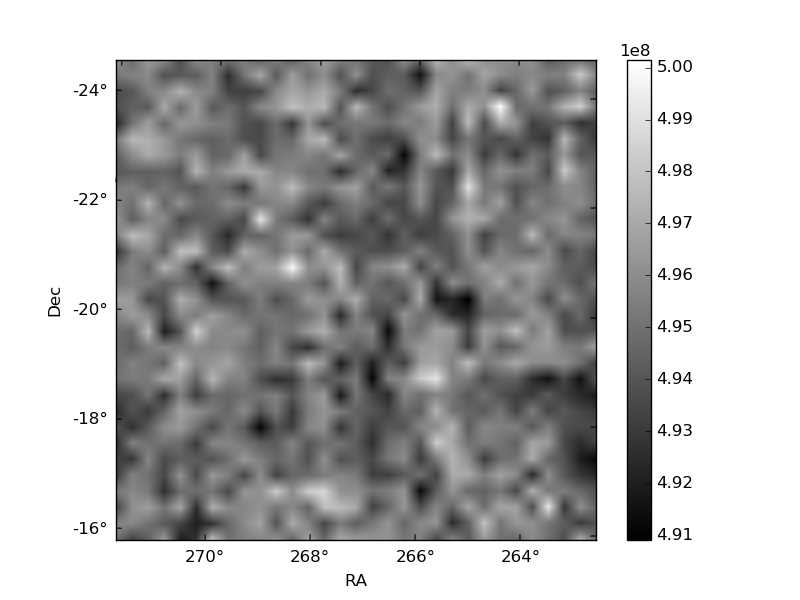
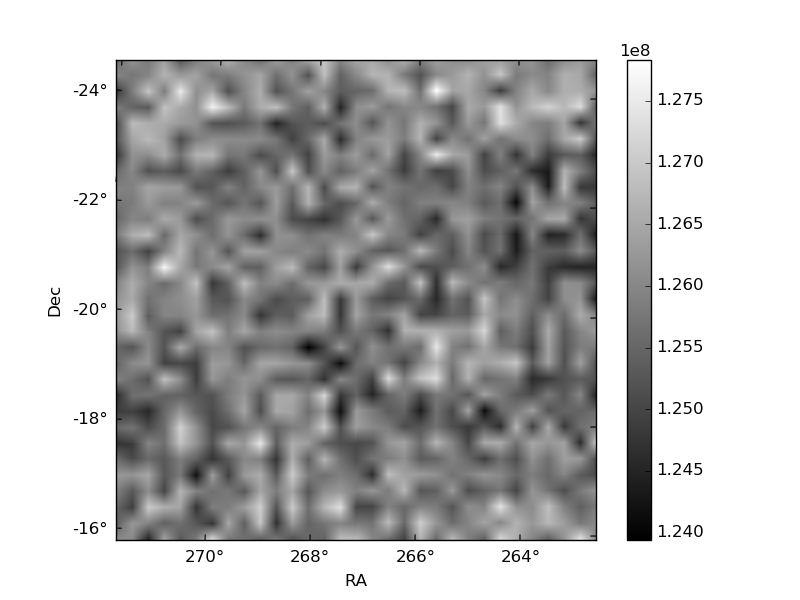
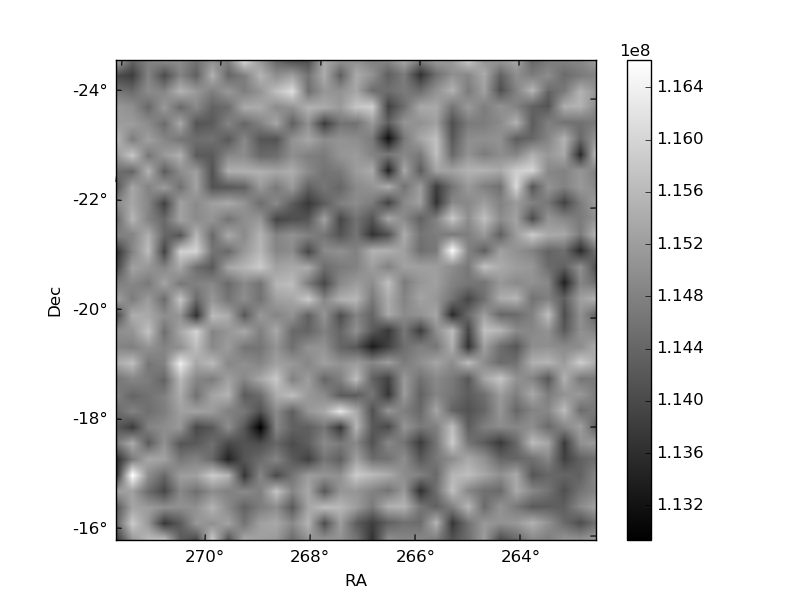
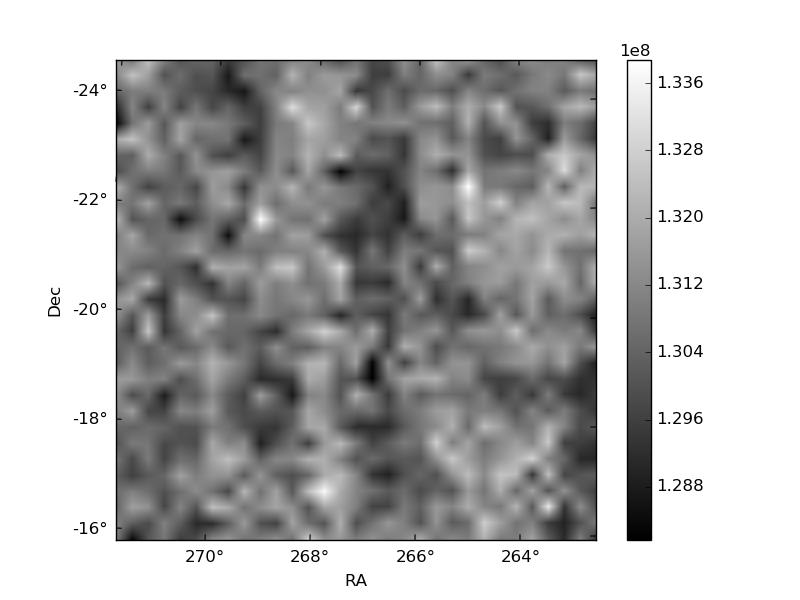
Histogram calculated using DETX and DETY for each event in the final _common_clean file
| Quadrant A | 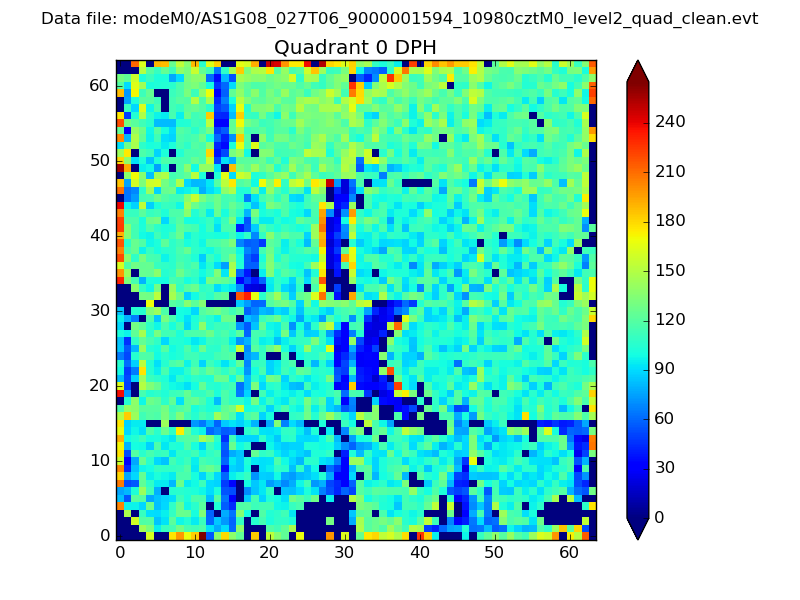 |
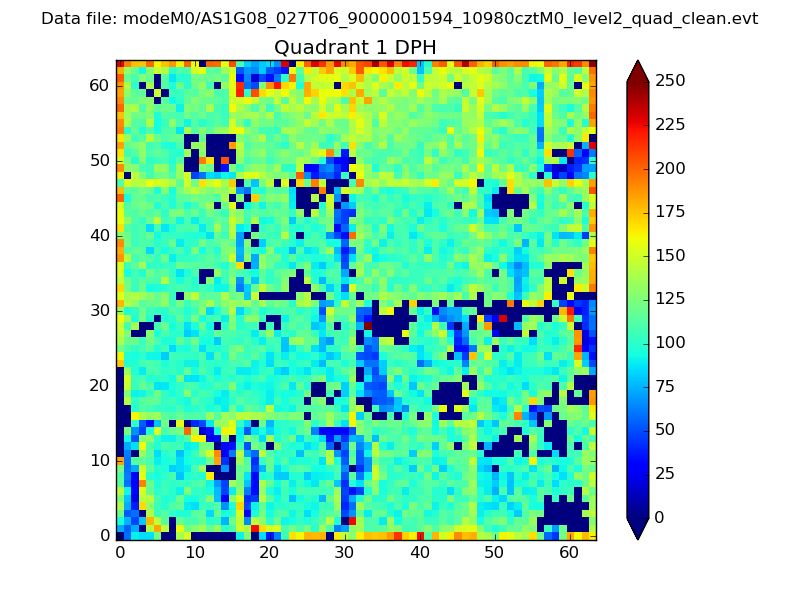 |
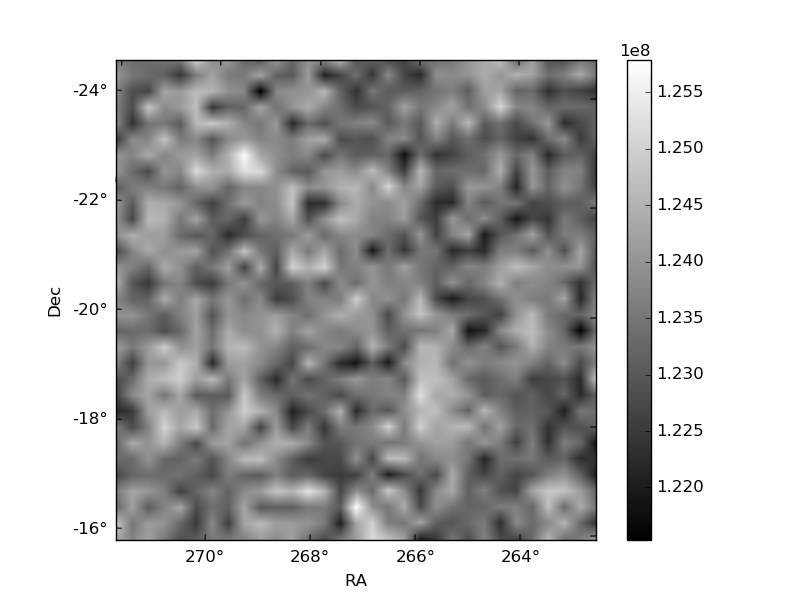
Quadrant B |
|---|---|---|---|
| Quadrant D | 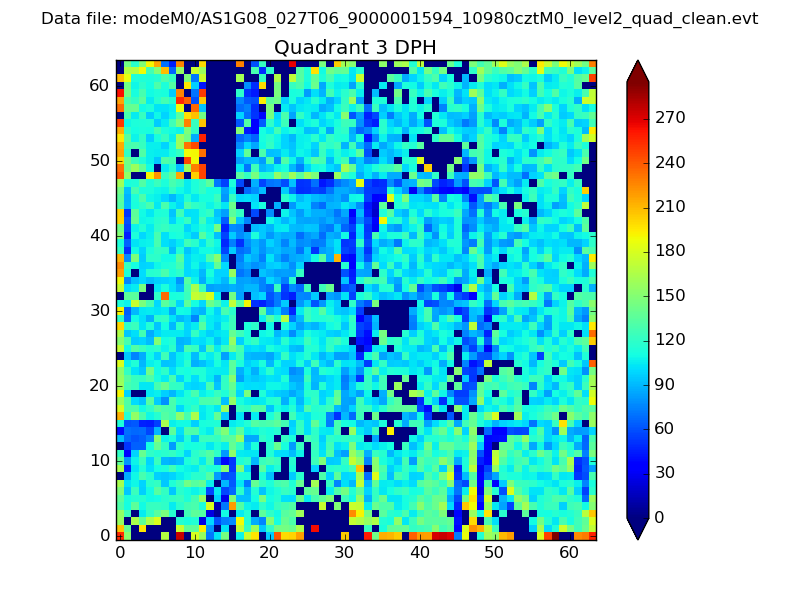 |
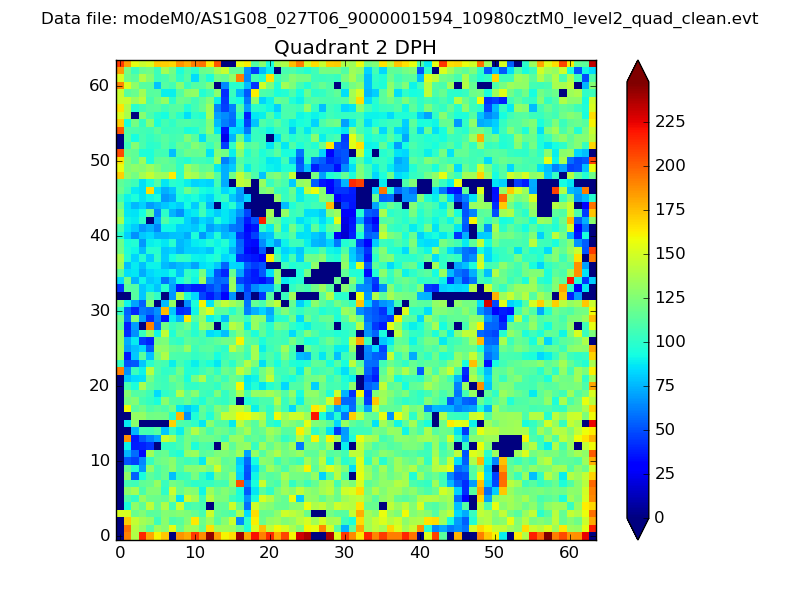 |
Quadrant C |
| Plot type | Count rate plots | Images |
|---|---|---|
| Comparison with Poisson distribution Blue bars denote a histogram of data divided into 1 sec bins. Red curve is a Poisson curve with rate = median count rate of data. |
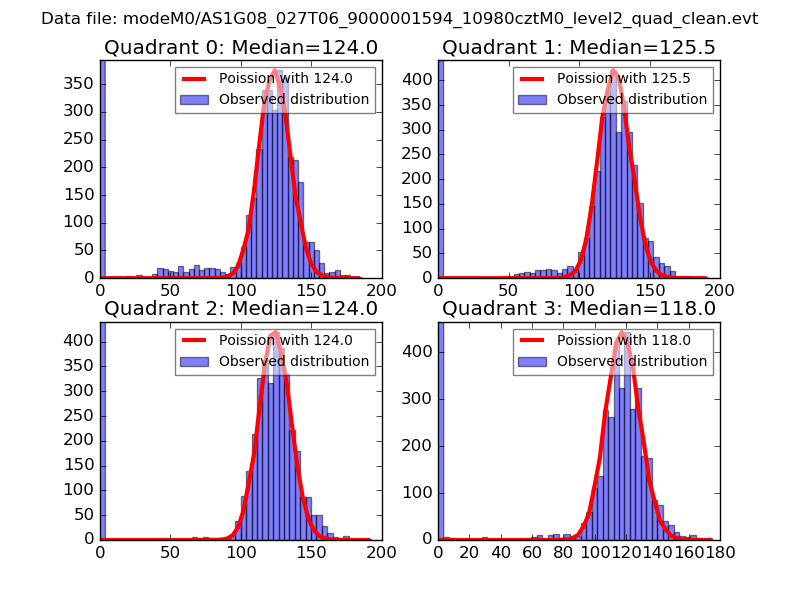 |
 |
| Quadrant-wise count rates Data is divided into 100 sec bins |
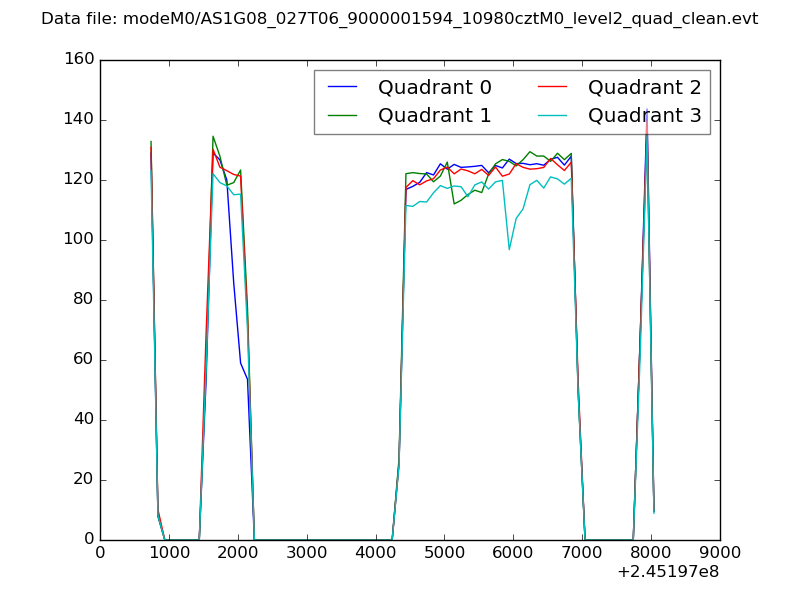 |
|
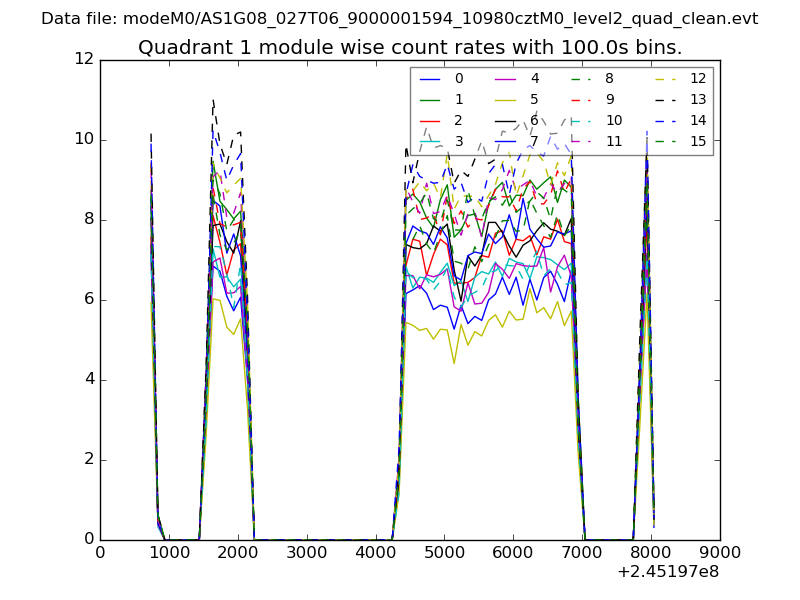
| Module-wise count rates for Quadrant A Data is divided into 100 sec bins |
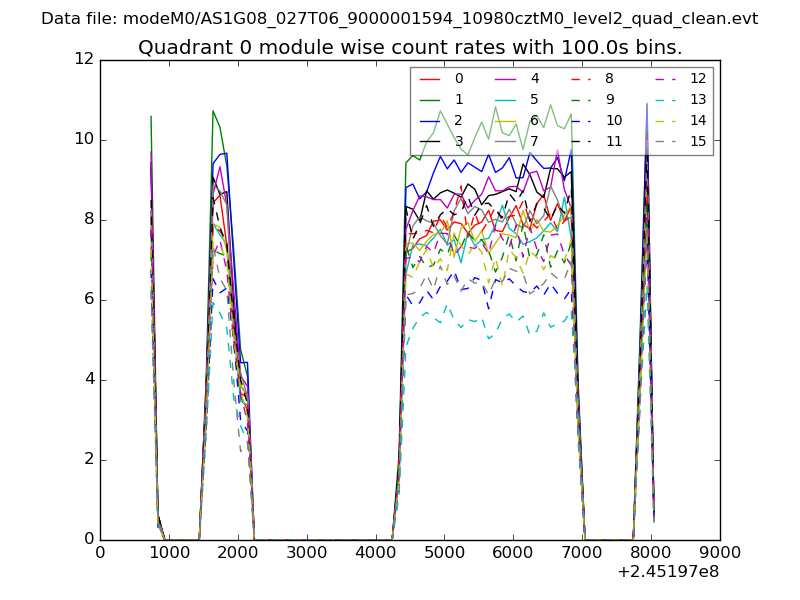 |
 |
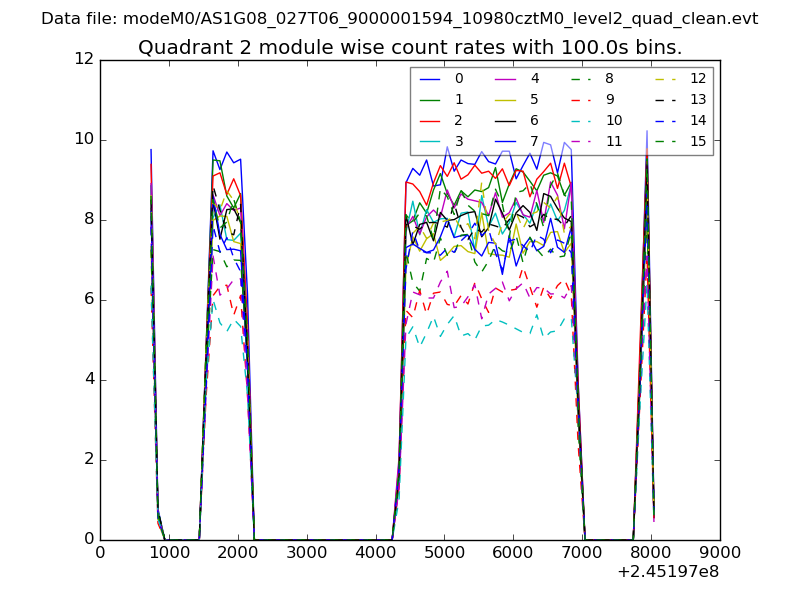
| Module-wise count rates for Quadrant B Data is divided into 100 sec bins |
 |
 |
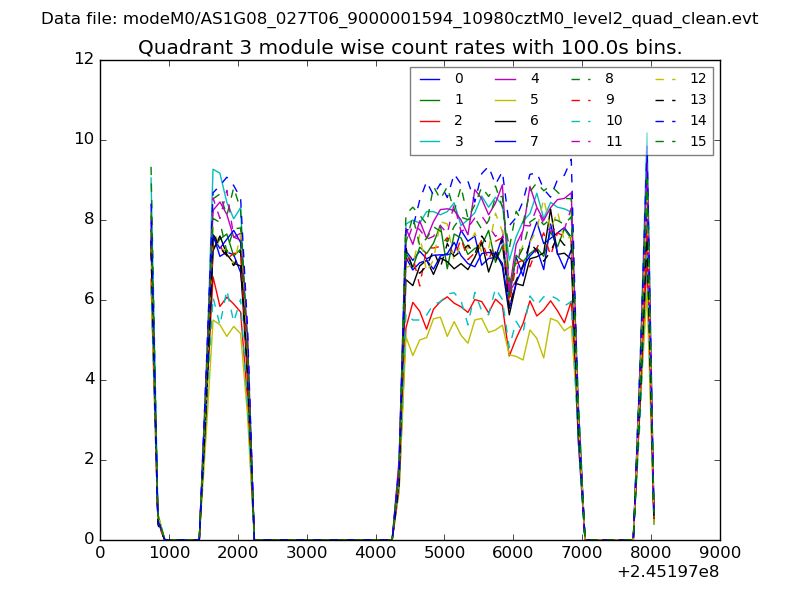
| Module-wise count rates for Quadrant C Data is divided into 100 sec bins |
 |
 |
| Module-wise count rates for Quadrant D Data is divided into 100 sec bins |
 |
 |
| Parameter | Plot |
|---|---|
| CZT HV Monitor | 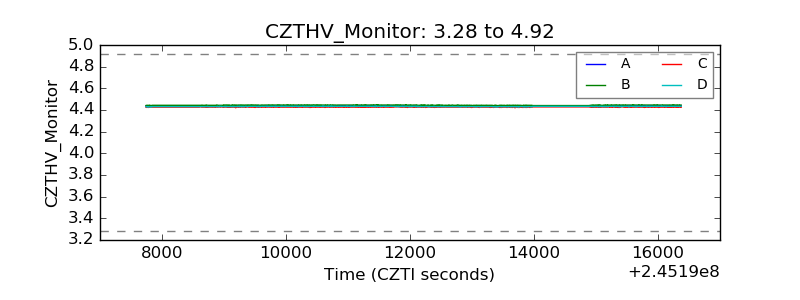 |
| D_VDD | 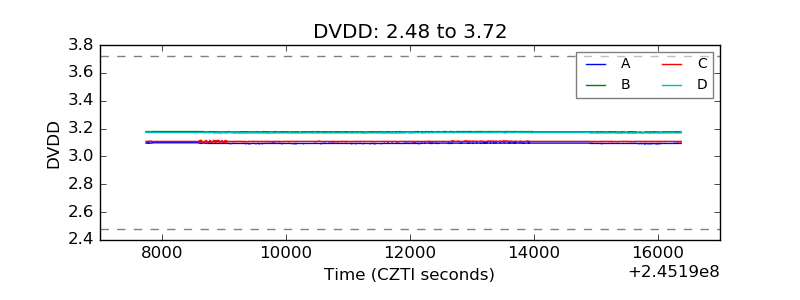 |
| Temperature 1 | 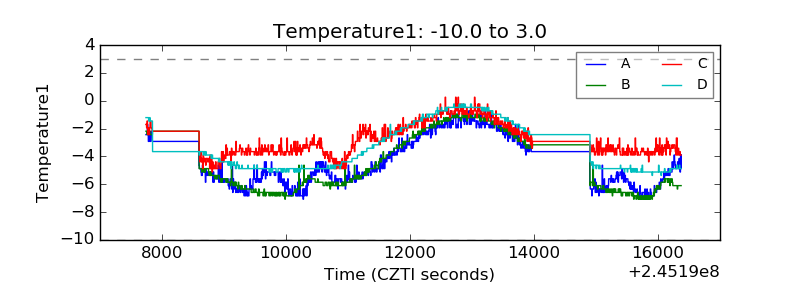 |
| Veto HV Monitor | 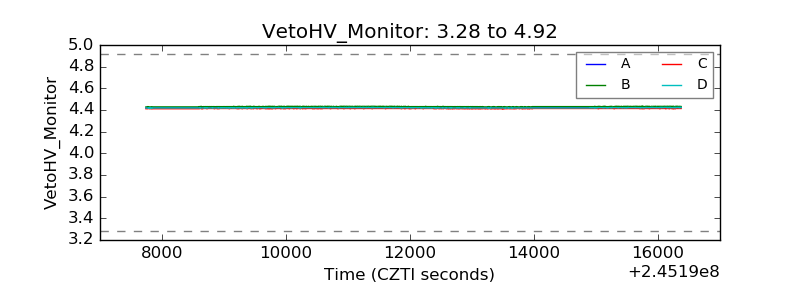 |
| Veto LLD |  |
| Alpha Counter | 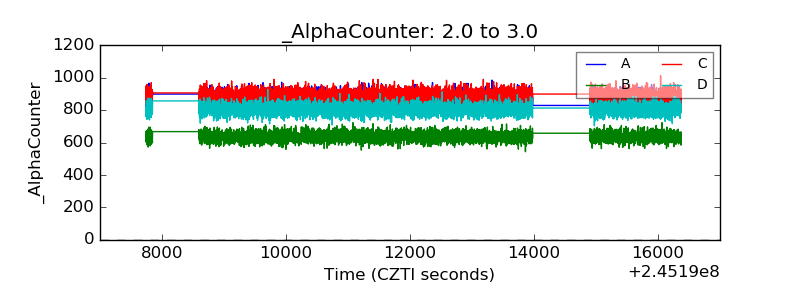 |
| _CPM_Rate | 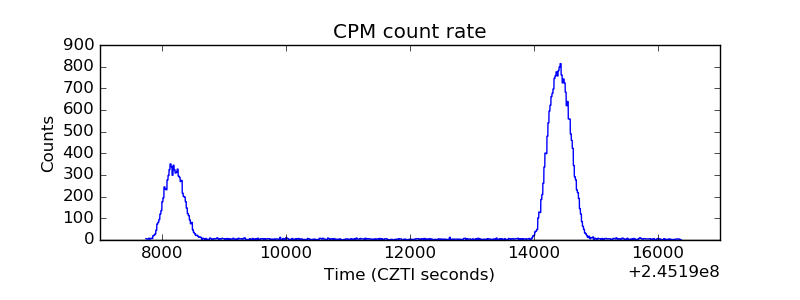 |
| CZT Counter | 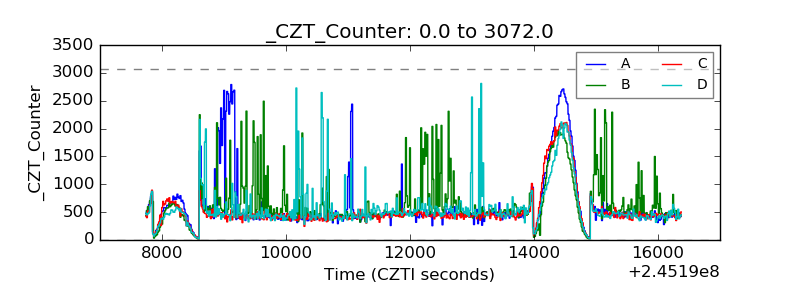 |
| +2.5 Volts monitor |  |
| +5 Volts monitor |  |
| _ROLL_ROT | 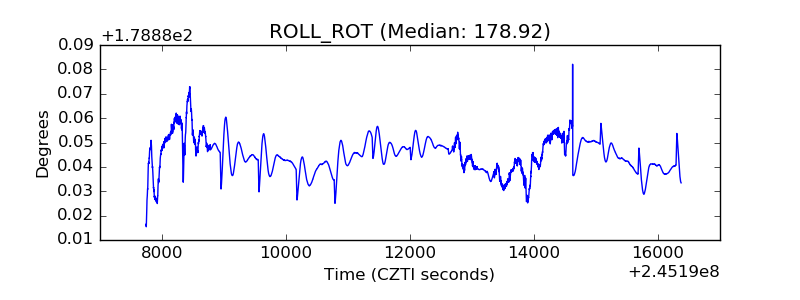 |
| _Roll_DEC | 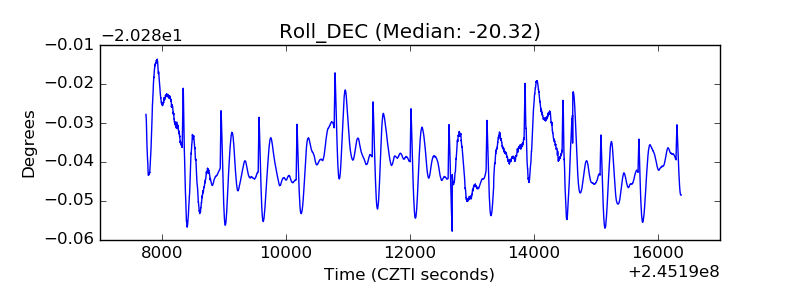 |
| _Roll_RA | 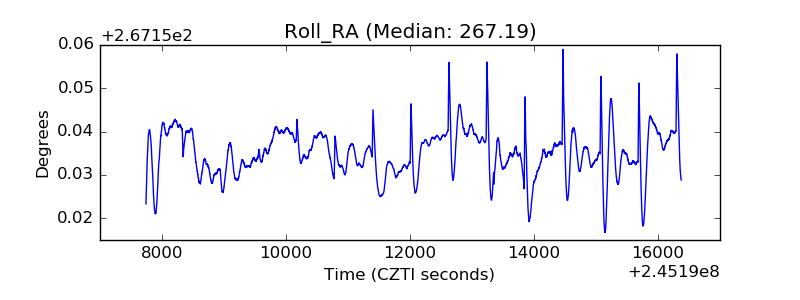 |
| Veto Counter | 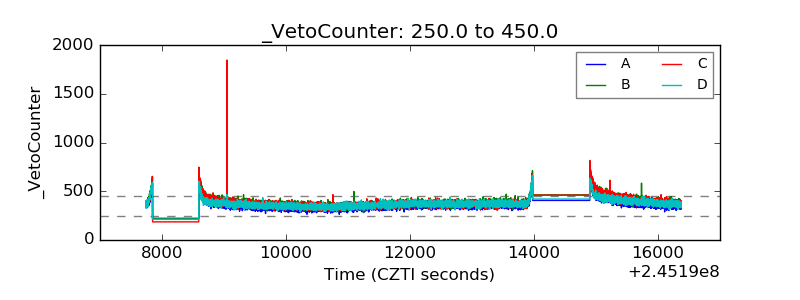 |