| Param | Original file | Final file |
|---|---|---|
| Filename | modeM0/AS1G08_027T06_9000001594_10981cztM0_level2.evt | modeM0/AS1G08_027T06_9000001594_10981cztM0_level2_quad_clean.evt |
| Size (bytes) | 422,377,920 | 60,220,800 |
| Size | 402.8 MB | 57.4 MB |
| Events in quadrant A | 3,019,956 | 355,981 |
| Events in quadrant B | 3,557,761 | 353,332 |
| Events in quadrant C | 2,759,898 | 353,506 |
| Events in quadrant D | 3,041,521 | 336,671 |
| Mode M9 | |||
|---|---|---|---|
| Quadrant | BADHDUFLAG | Total packets | Discarded packets |
| A | 0 | 10 | 0 |
| B | 0 | 10 | 0 |
| C | 0 | 10 | 0 |
| D | 0 | 10 | 0 |
| Mode M0 | |||
|---|---|---|---|
| Quadrant | BADHDUFLAG | Total packets | Discarded packets |
| A | 0 | 12903 | 2 |
| B | 0 | 14459 | 1 |
| C | 0 | 12372 | 1 |
| D | 0 | 13150 | 1 |
| Mode SS | |||
|---|---|---|---|
| Quadrant | BADHDUFLAG | Total packets | Discarded packets |
| A | 0 | 124 | 0 |
| B | 0 | 124 | 0 |
| C | 0 | 124 | 0 |
| D | 0 | 124 | 0 |
| Quadrant | Total seconds | Saturated seconds | Saturation percentage |
|---|---|---|---|
| A | 6065 | 50 | 0.824402% |
| B | 6065 | 202 | 3.330585% |
| C | 6065 | 43 | 0.708986% |
| D | 6065 | 67 | 1.104699% |
Noise dominated data is calculated using 1-second bins in cleaned event files. If a bin has >2000 counts, and if more than 50% of those come from <1% of pixels, then it is considered to be noise-dominated and hence unusable.
| Quadrant | # 1 sec bins | Bins with >0 counts | Bins with >2000 counts | High rate bins dominated by noise | Noise dominated (total time) | Noise dominated (detector-on time) | Marked lightcurve |
|---|---|---|---|---|---|---|---|
| A | 7110 | 6066 | 4 | 4 | 0.06% | 0.07% | 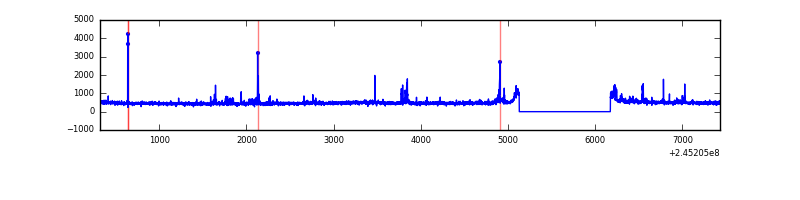 |
| B | 7110 | 6065 | 90 | 90 | 1.27% | 1.48% | 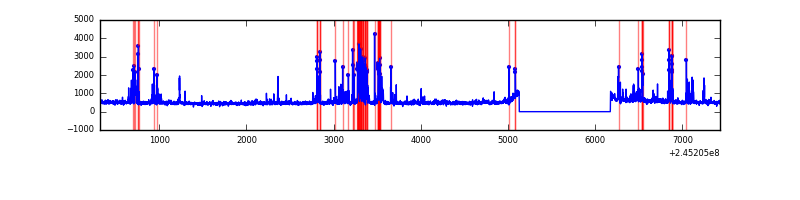 |
| C | 7110 | 6065 | 1 | 1 | 0.01% | 0.02% | 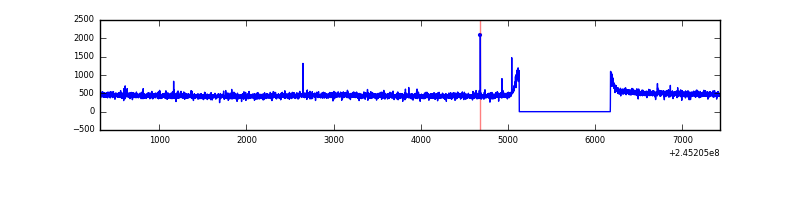 |
| D | 7110 | 6066 | 28 | 28 | 0.39% | 0.46% | 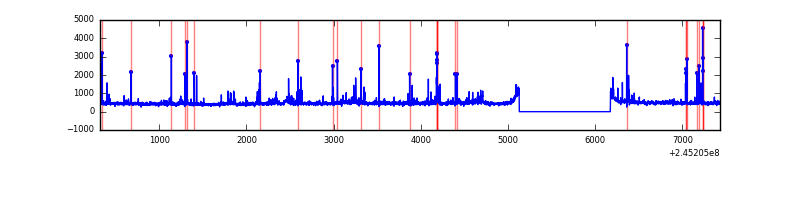 |
Top three noisy pixels from each quadrant. If the there are fewer than three noisy pixels in the level2.evt file, extra rows are filled as -1
| Pixel properties | Quadrant properties | ||||||
|---|---|---|---|---|---|---|---|
| Quadrant | DetID | PixID | Counts | Sigma | Mean | Median | Sigma |
| A | 8 | 5 | 117475 | 779.34 | 729 | 714 | 149.8 |
| A | 15 | 223 | 41639 | 273.16 | 729 | 714 | 149.8 |
| A | 8 | 15 | 34285 | 224.07 | 729 | 714 | 149.8 |
| B | 4 | 239 | 604066 | 4380.07 | 726 | 709 | 137.8 |
| B | 0 | 214 | 36824 | 262.18 | 726 | 709 | 137.8 |
| B | 0 | 219 | 23277 | 163.83 | 726 | 709 | 137.8 |
| C | 1 | 3 | 10670 | 61.07 | 705 | 709 | 163.1 |
| C | 13 | 61 | 5294 | 28.11 | 705 | 709 | 163.1 |
| C | 14 | 234 | 2833 | 13.02 | 705 | 709 | 163.1 |
| D | 1 | 52 | 116130 | 697.65 | 696 | 676 | 165.5 |
| D | 5 | 222 | 81998 | 491.4 | 696 | 676 | 165.5 |
| D | 13 | 152 | 49971 | 297.87 | 696 | 676 | 165.5 |
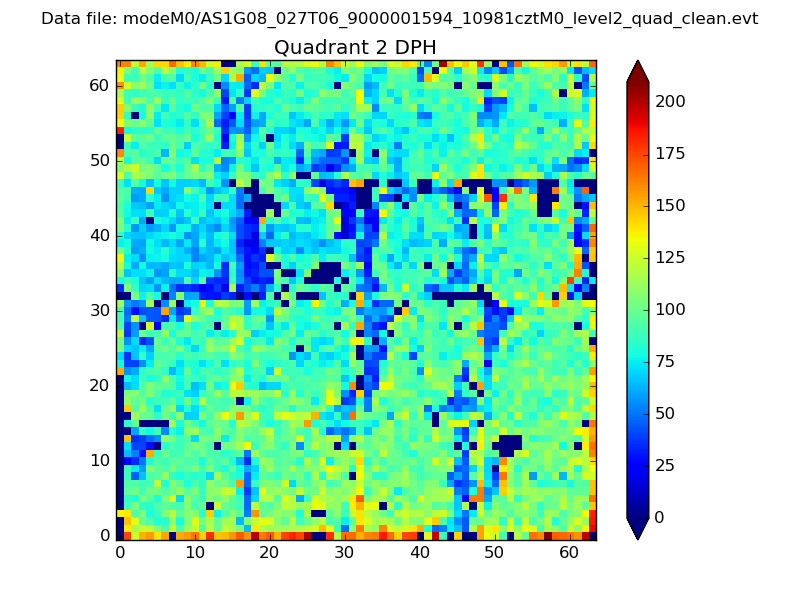
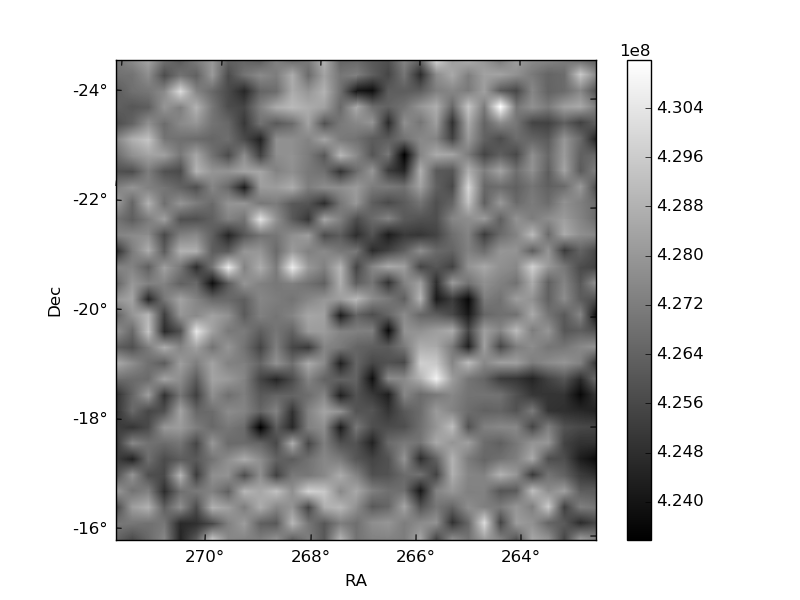
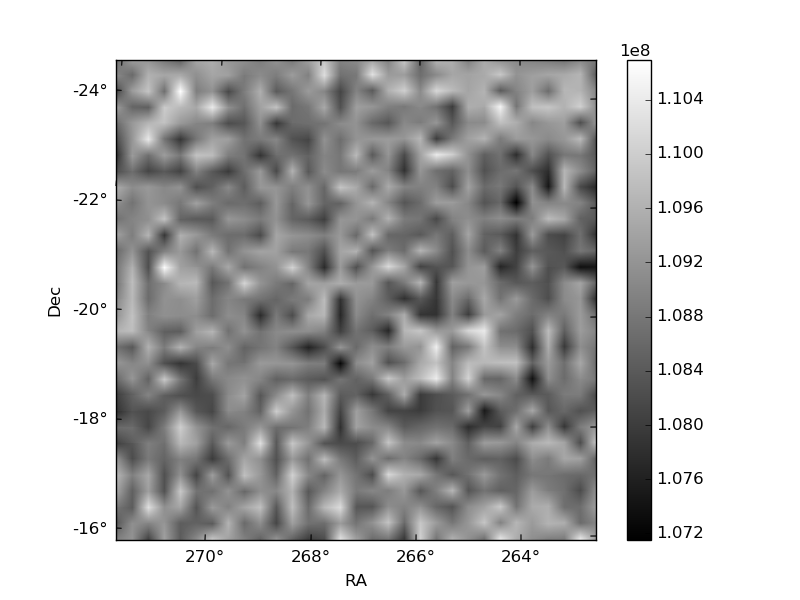
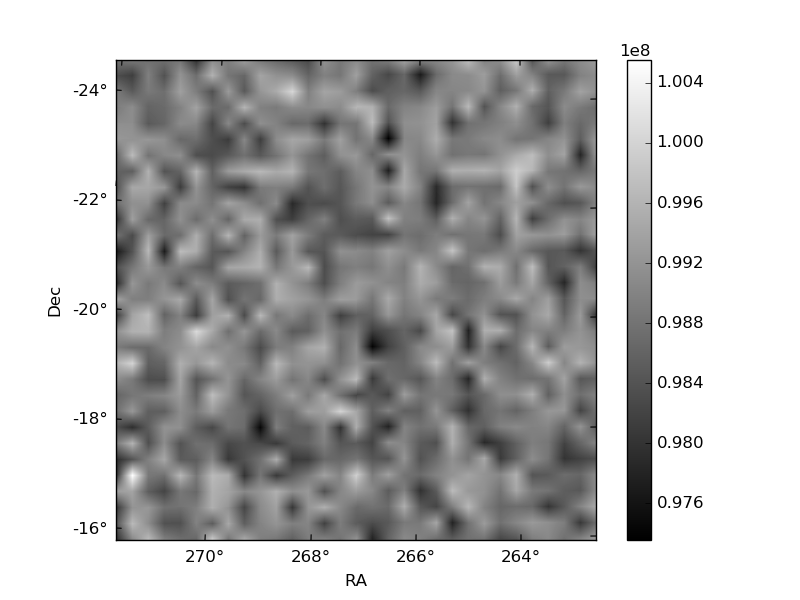
Histogram calculated using DETX and DETY for each event in the final _common_clean file
| Quadrant A | 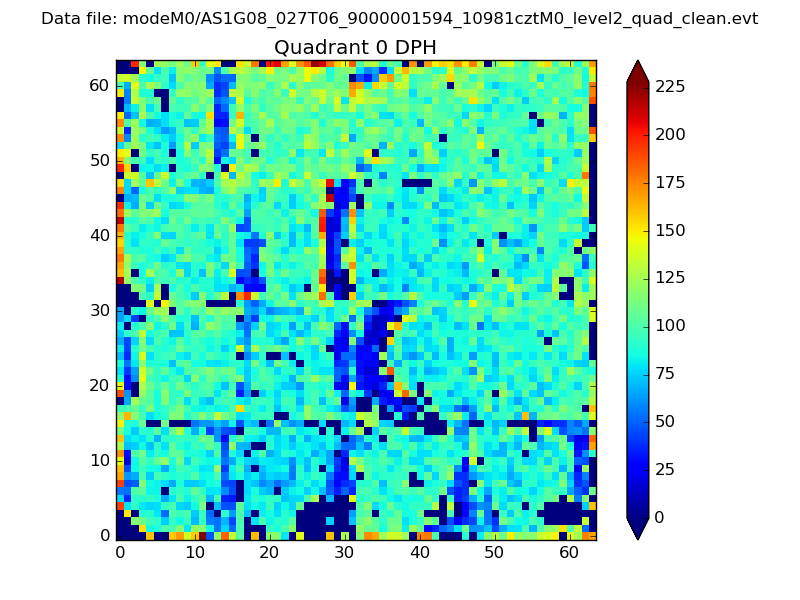 |
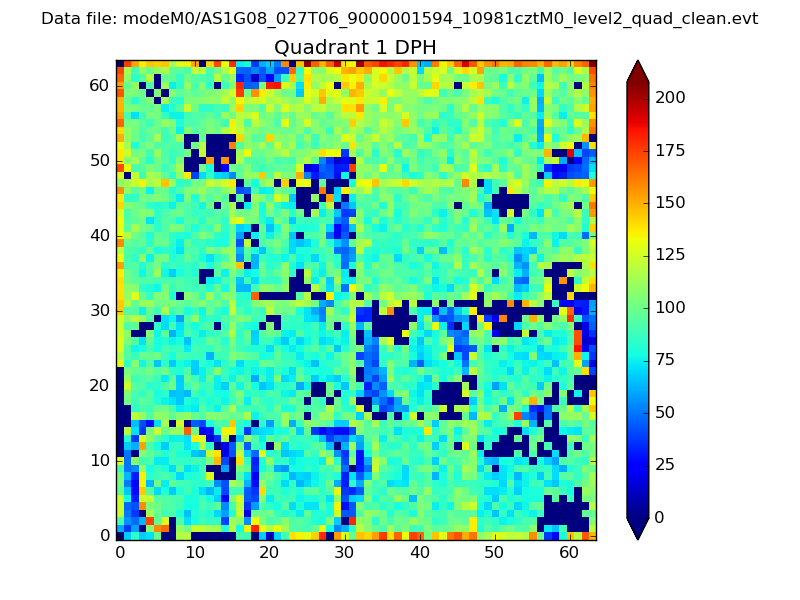 |
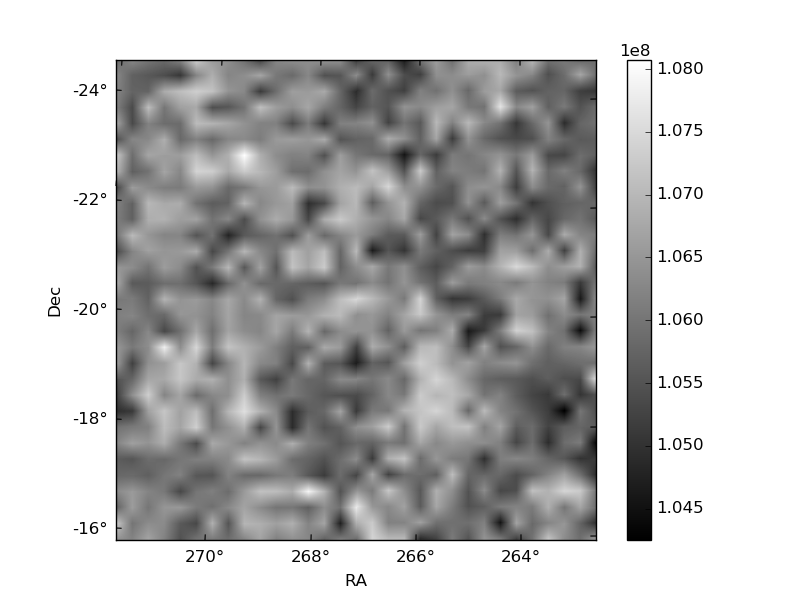
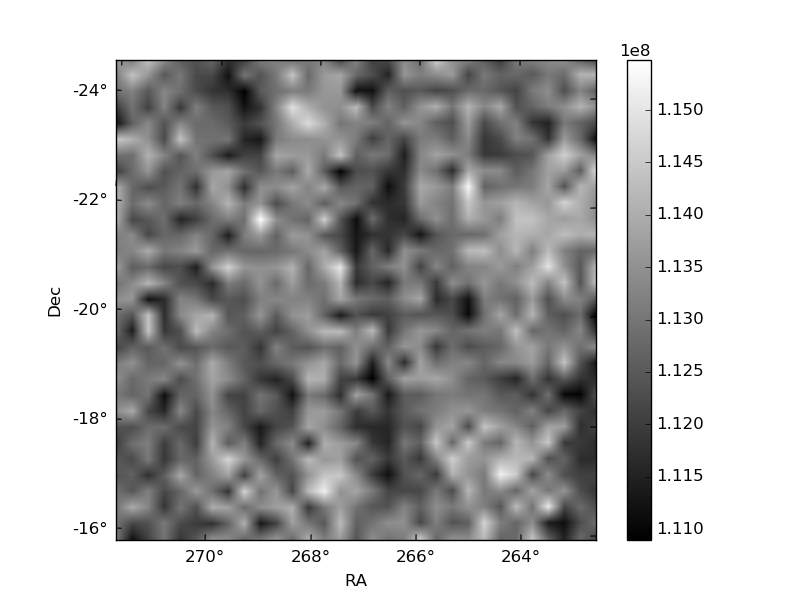
Quadrant B |
|---|---|---|---|
| Quadrant D | 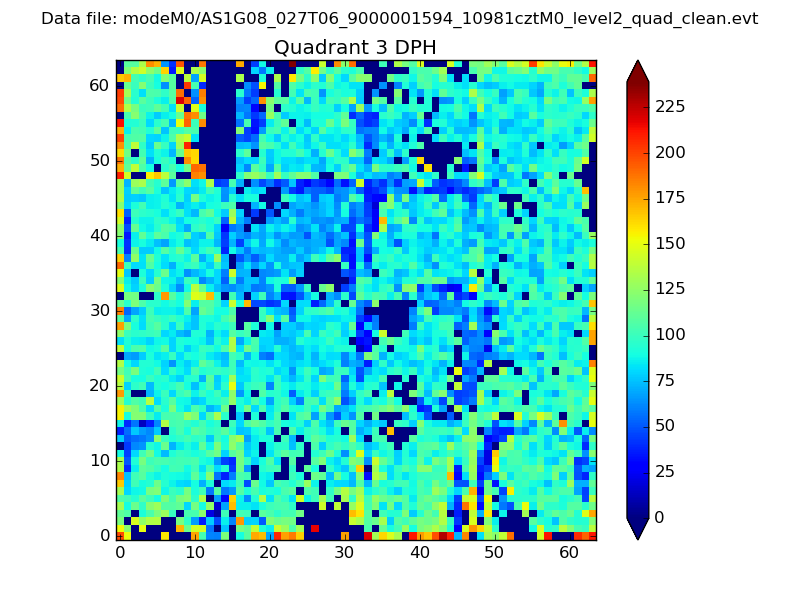 |
 |
Quadrant C |
| Plot type | Count rate plots | Images |
|---|---|---|
| Comparison with Poisson distribution Blue bars denote a histogram of data divided into 1 sec bins. Red curve is a Poisson curve with rate = median count rate of data. |
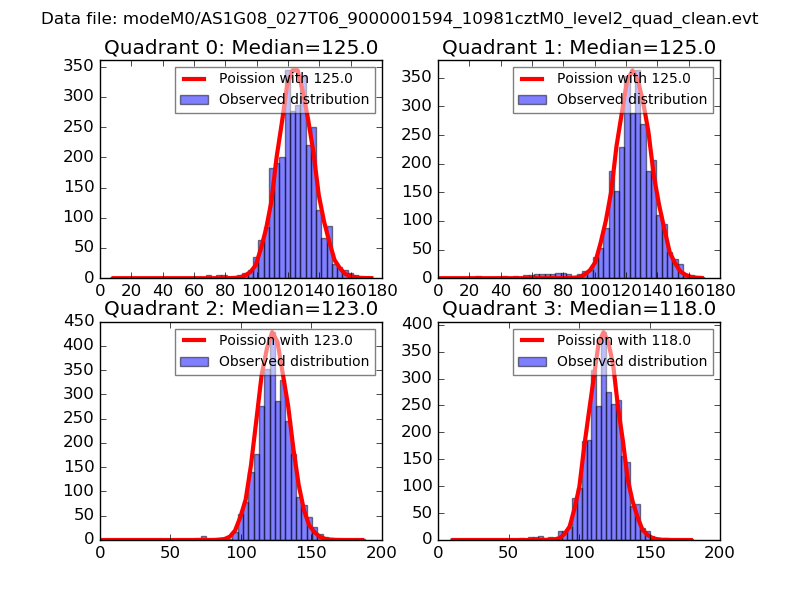 |
 |
| Quadrant-wise count rates Data is divided into 100 sec bins |
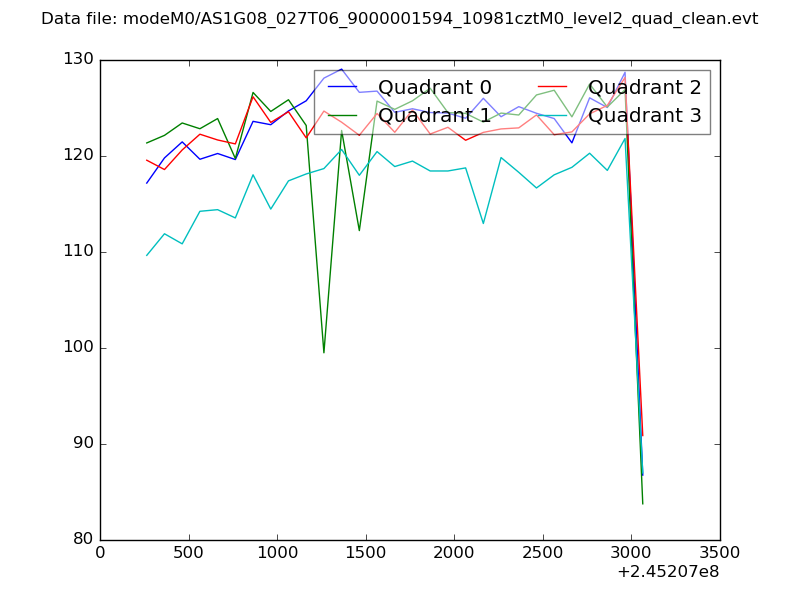 |
|
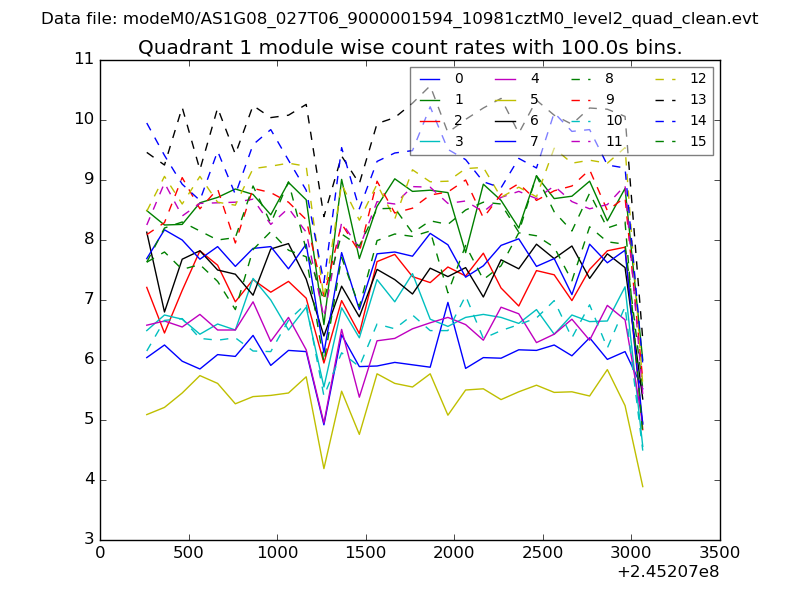
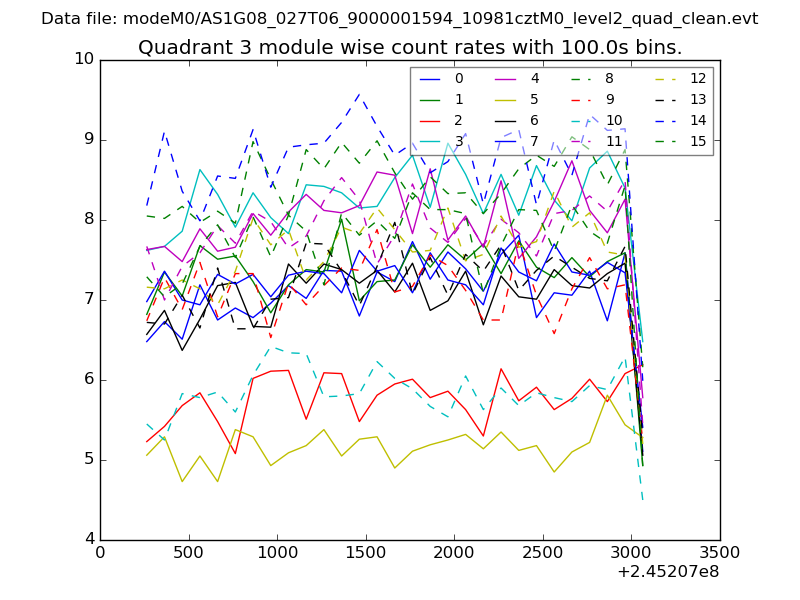
| Module-wise count rates for Quadrant A Data is divided into 100 sec bins |
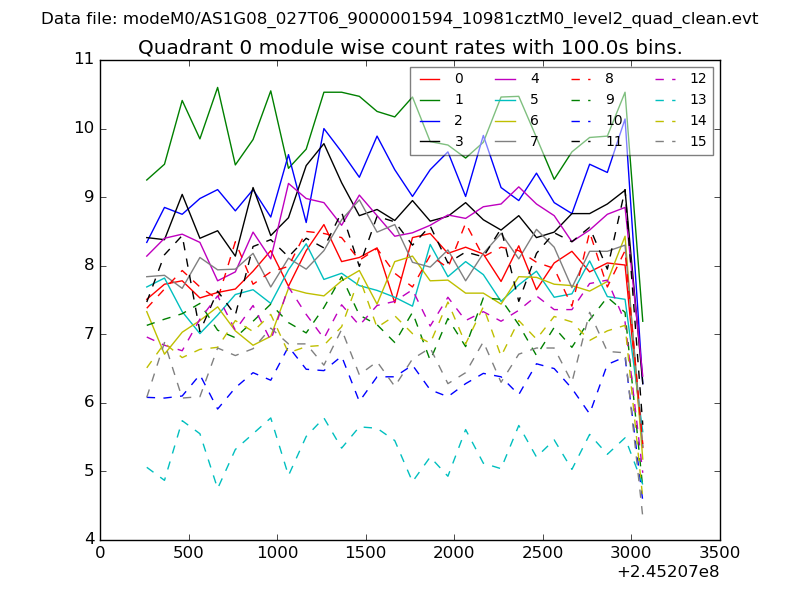 |
 |
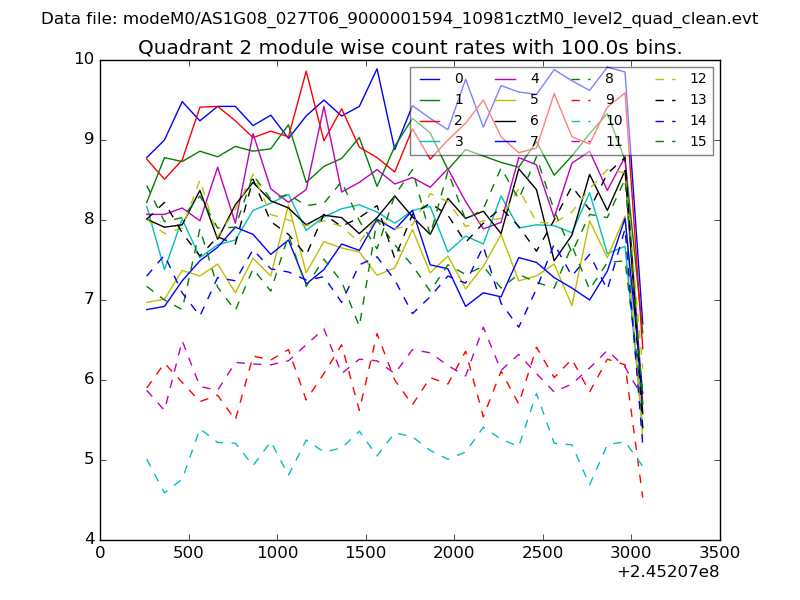
| Module-wise count rates for Quadrant B Data is divided into 100 sec bins |
 |
 |
| Module-wise count rates for Quadrant C Data is divided into 100 sec bins |
 |
 |
| Module-wise count rates for Quadrant D Data is divided into 100 sec bins |
 |
 |
| Parameter | Plot |
|---|---|
| CZT HV Monitor | 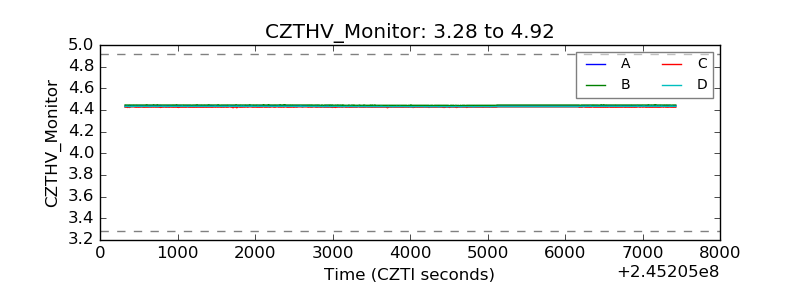 |
| D_VDD |  |
| Temperature 1 | 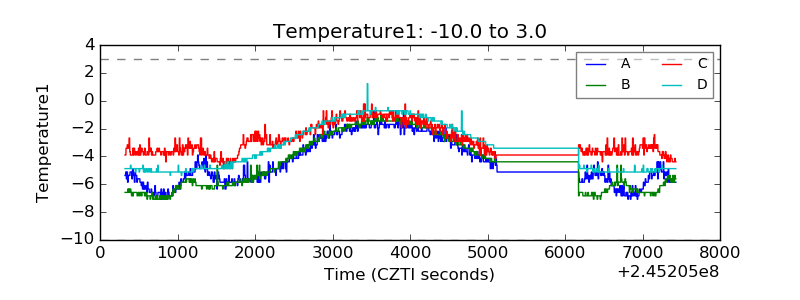 |
| Veto HV Monitor | 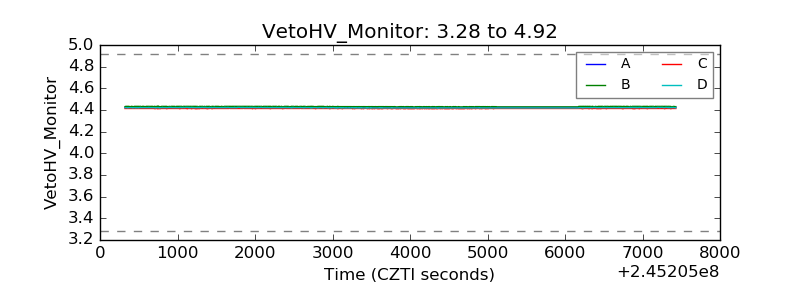 |
| Veto LLD | 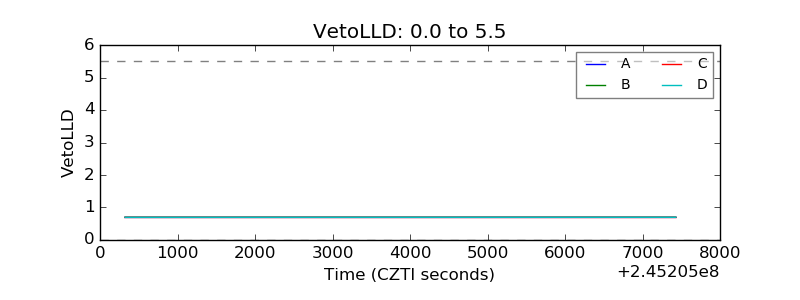 |
| Alpha Counter | 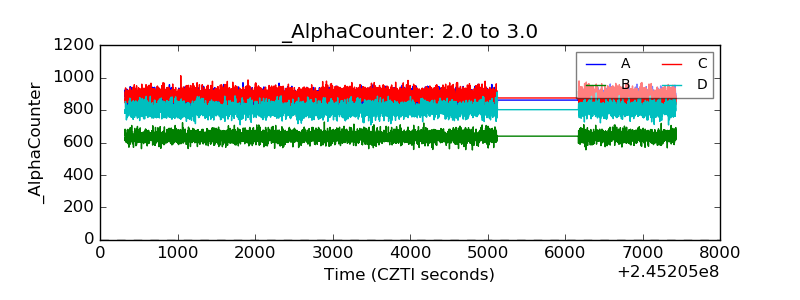 |
| _CPM_Rate | 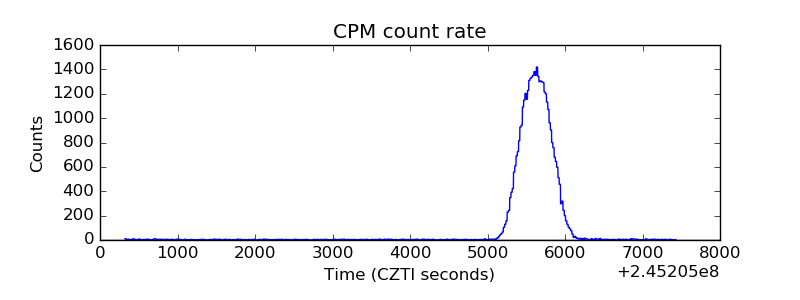 |
| CZT Counter | 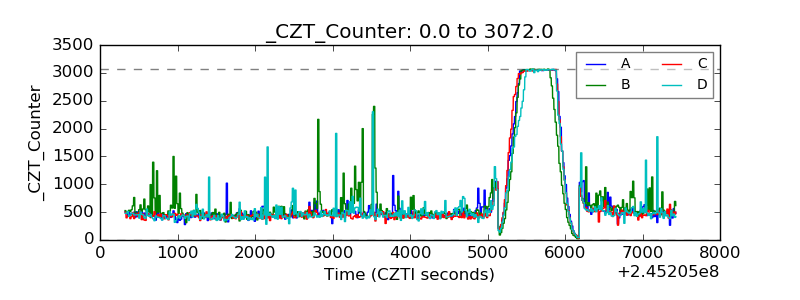 |
| +2.5 Volts monitor |  |
| +5 Volts monitor |  |
| _ROLL_ROT | 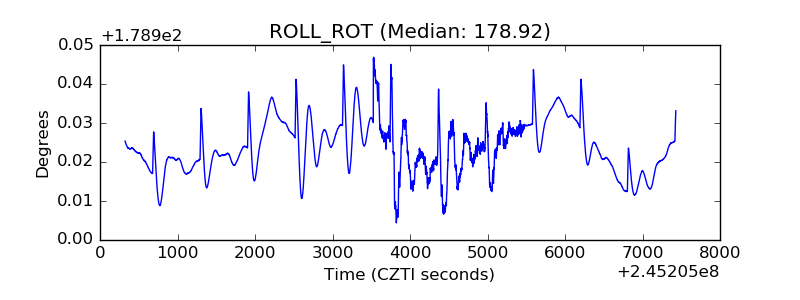 |
| _Roll_DEC | 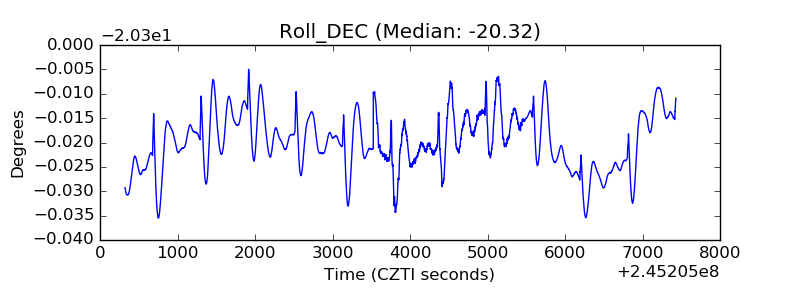 |
| _Roll_RA | 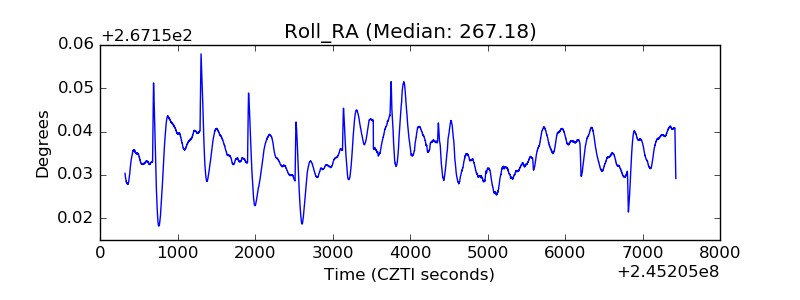 |
| Veto Counter | 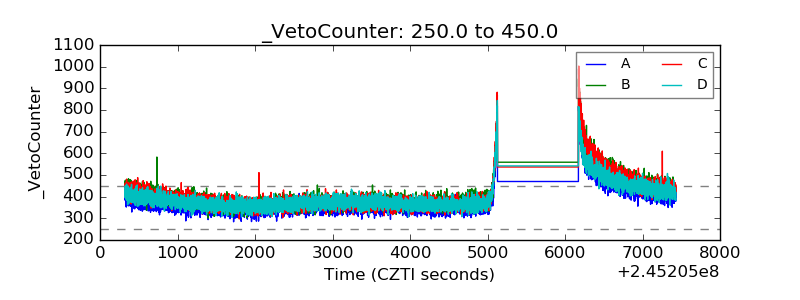 |