| Param | Original file | Final file |
|---|---|---|
| Filename | modeM0/AS1G08_027T06_9000001594_10984cztM0_level2.evt | modeM0/AS1G08_027T06_9000001594_10984cztM0_level2_quad_clean.evt |
| Size (bytes) | 493,574,400 | 77,425,920 |
| Size | 470.7 MB | 73.8 MB |
| Events in quadrant A | 3,588,904 | 489,384 |
| Events in quadrant B | 4,005,150 | 484,280 |
| Events in quadrant C | 3,087,959 | 482,642 |
| Events in quadrant D | 3,845,358 | 455,278 |
| Mode M9 | |||
|---|---|---|---|
| Quadrant | BADHDUFLAG | Total packets | Discarded packets |
| A | 0 | 16 | 0 |
| B | 0 | 16 | 0 |
| C | 0 | 16 | 0 |
| D | 0 | 17 | 0 |
| Mode M0 | |||
|---|---|---|---|
| Quadrant | BADHDUFLAG | Total packets | Discarded packets |
| A | 0 | 14577 | 3 |
| B | 0 | 15865 | 2 |
| C | 0 | 13120 | 2 |
| D | 0 | 15243 | 2 |
| Mode SS | |||
|---|---|---|---|
| Quadrant | BADHDUFLAG | Total packets | Discarded packets |
| A | 0 | 126 | 0 |
| B | 0 | 126 | 0 |
| C | 0 | 126 | 0 |
| D | 0 | 126 | 0 |
| Quadrant | Total seconds | Saturated seconds | Saturation percentage |
|---|---|---|---|
| A | 6200 | 107 | 1.725806% |
| B | 6200 | 287 | 4.629032% |
| C | 6200 | 40 | 0.645161% |
| D | 6200 | 122 | 1.967742% |
Noise dominated data is calculated using 1-second bins in cleaned event files. If a bin has >2000 counts, and if more than 50% of those come from <1% of pixels, then it is considered to be noise-dominated and hence unusable.
| Quadrant | # 1 sec bins | Bins with >0 counts | Bins with >2000 counts | High rate bins dominated by noise | Noise dominated (total time) | Noise dominated (detector-on time) | Marked lightcurve |
|---|---|---|---|---|---|---|---|
| A | 7480 | 6201 | 27 | 27 | 0.36% | 0.44% | 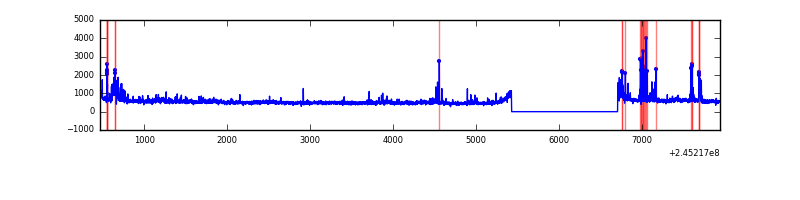 |
| B | 7480 | 6200 | 137 | 137 | 1.83% | 2.21% | 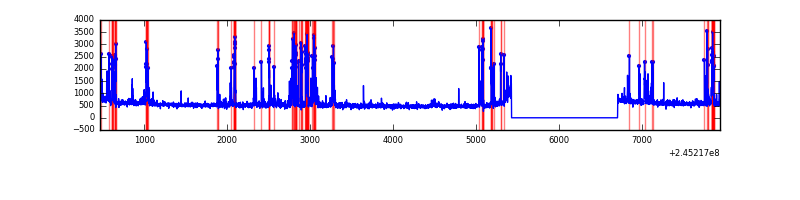 |
| C | 7480 | 6201 | 0 | 0 | 0.00% | 0.00% | 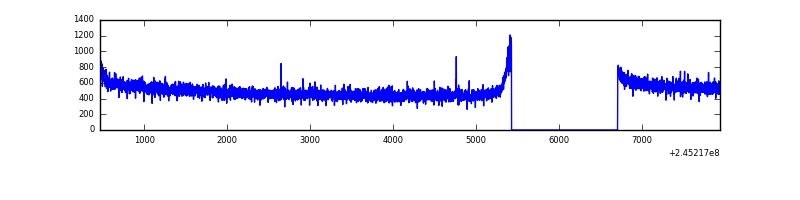 |
| D | 7480 | 6200 | 85 | 85 | 1.14% | 1.37% | 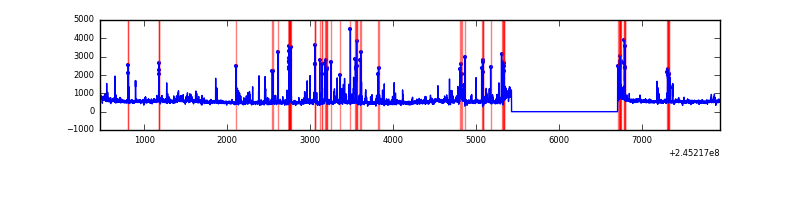 |
Top three noisy pixels from each quadrant. If the there are fewer than three noisy pixels in the level2.evt file, extra rows are filled as -1
| Pixel properties | Quadrant properties | ||||||
|---|---|---|---|---|---|---|---|
| Quadrant | DetID | PixID | Counts | Sigma | Mean | Median | Sigma |
| A | 8 | 5 | 321903 | 1952.29 | 821 | 809 | 164.5 |
| A | 8 | 15 | 85479 | 514.8 | 821 | 809 | 164.5 |
| A | 14 | 238 | 10265 | 57.49 | 821 | 809 | 164.5 |
| B | 4 | 239 | 746659 | 4911.84 | 812 | 797 | 151.8 |
| B | 0 | 214 | 45343 | 293.36 | 812 | 797 | 151.8 |
| B | 3 | 189 | 22103 | 140.31 | 812 | 797 | 151.8 |
| C | 13 | 61 | 5874 | 28.09 | 791 | 798 | 180.7 |
| C | 1 | 3 | 3105 | 12.77 | 791 | 798 | 180.7 |
| C | 12 | 4 | 2023 | 6.78 | 791 | 798 | 180.7 |
| D | 1 | 52 | 453126 | 2407.19 | 786 | 766 | 187.9 |
| D | 8 | 195 | 182213 | 965.55 | 786 | 766 | 187.9 |
| D | 10 | 253 | 69628 | 366.44 | 786 | 766 | 187.9 |
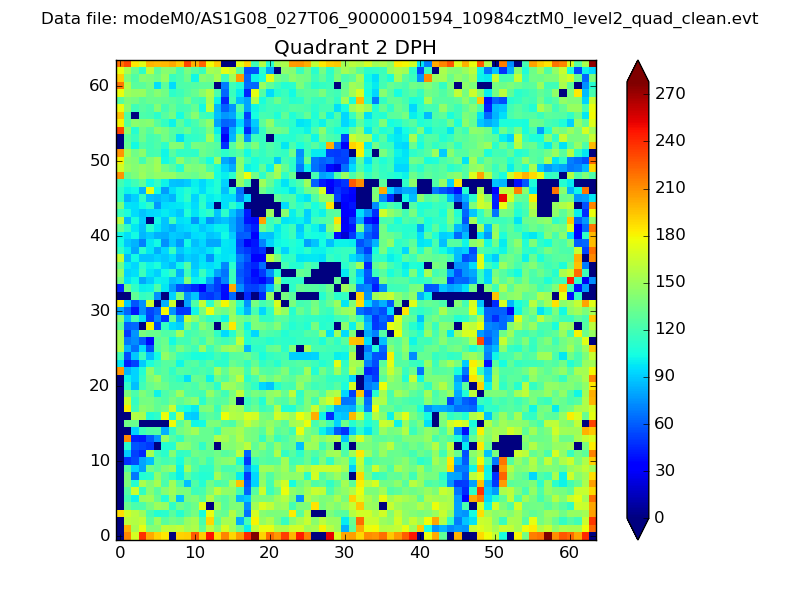
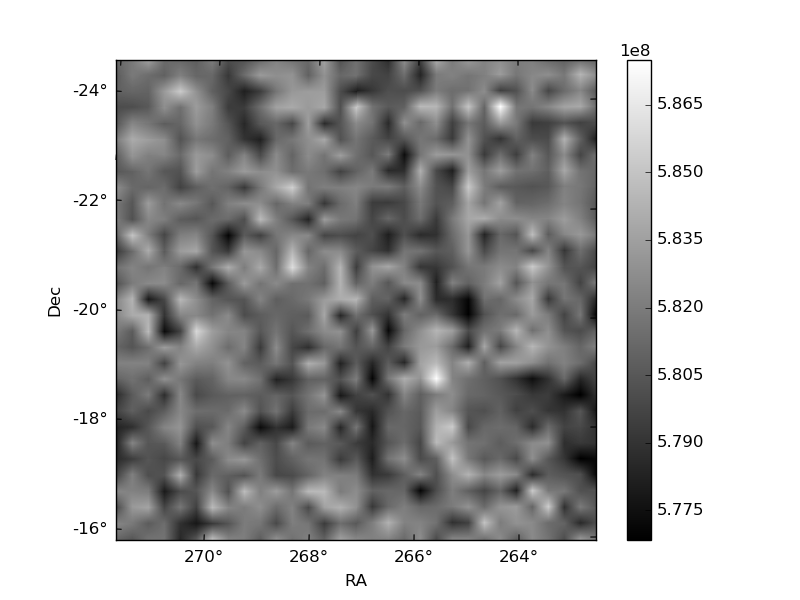
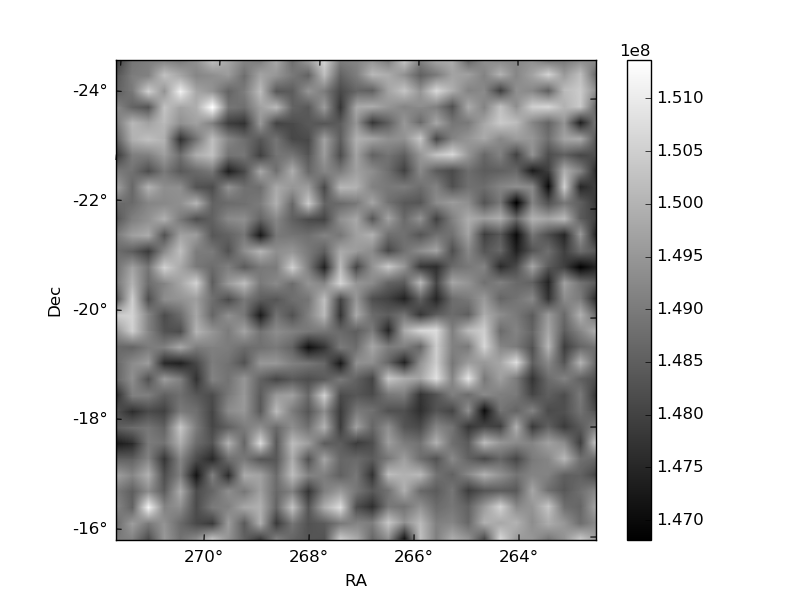
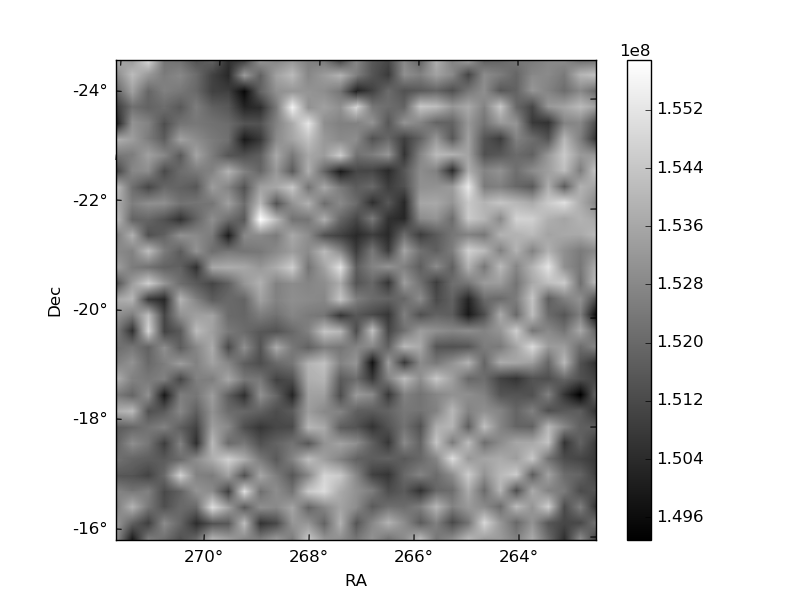
Histogram calculated using DETX and DETY for each event in the final _common_clean file
| Quadrant A | 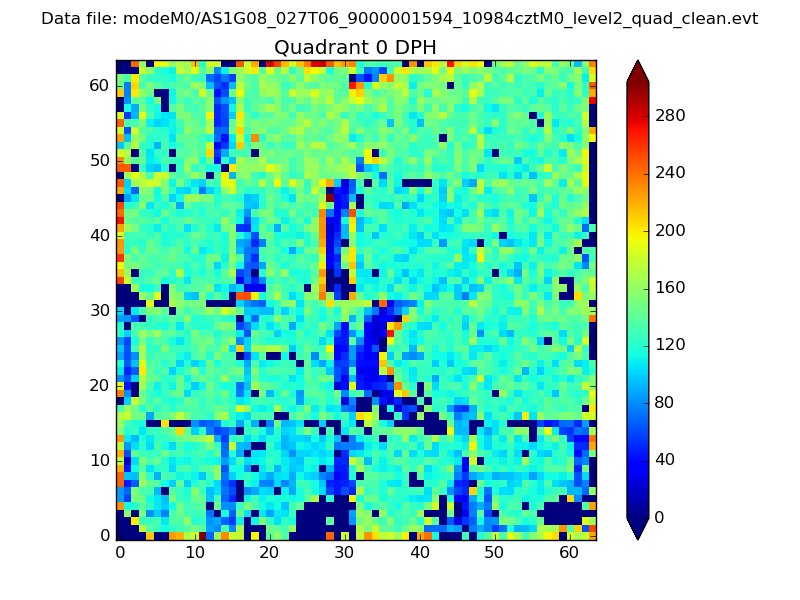 |
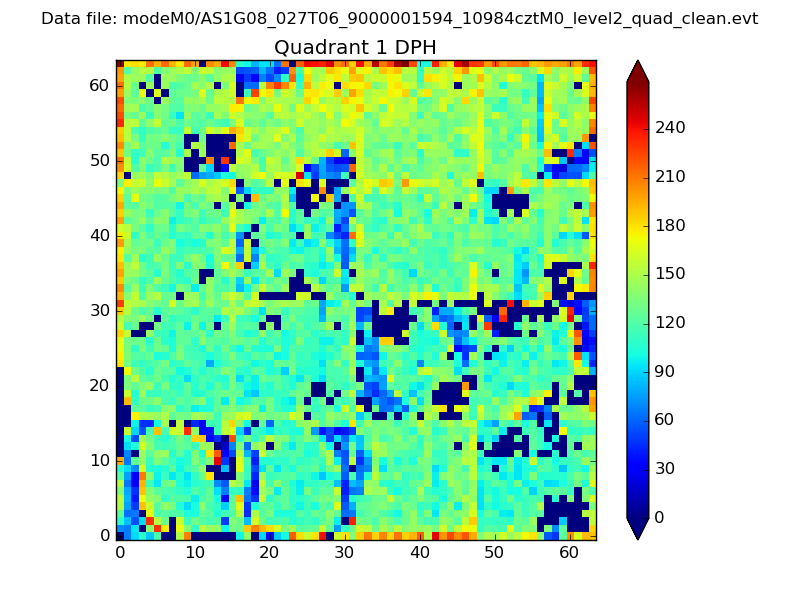 |
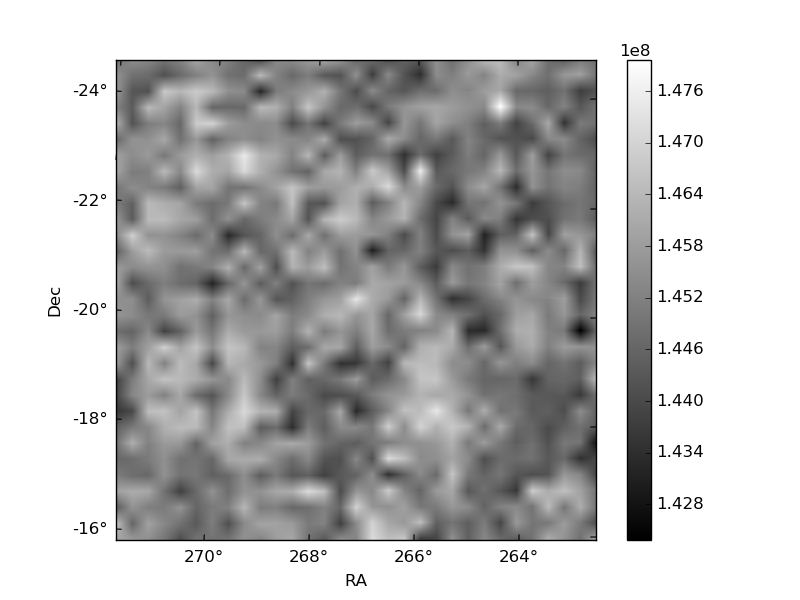
Quadrant B |
|---|---|---|---|
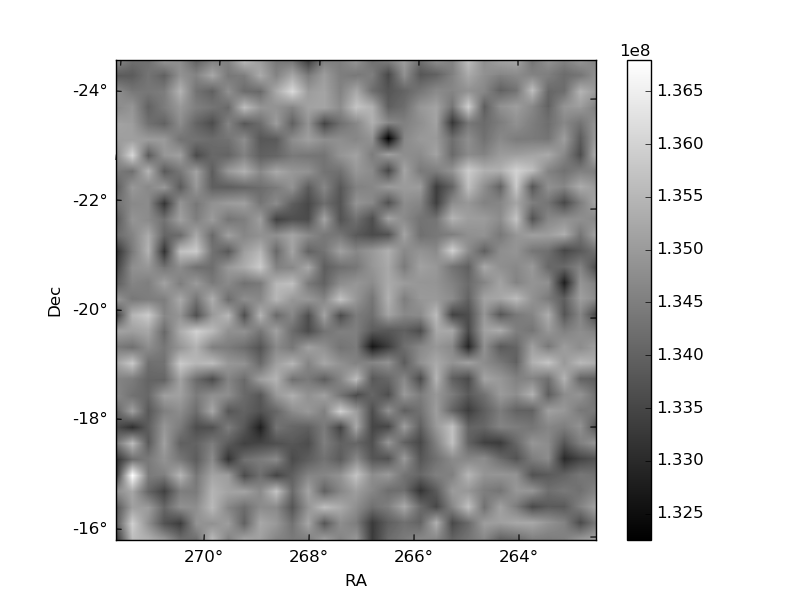
| Quadrant D | 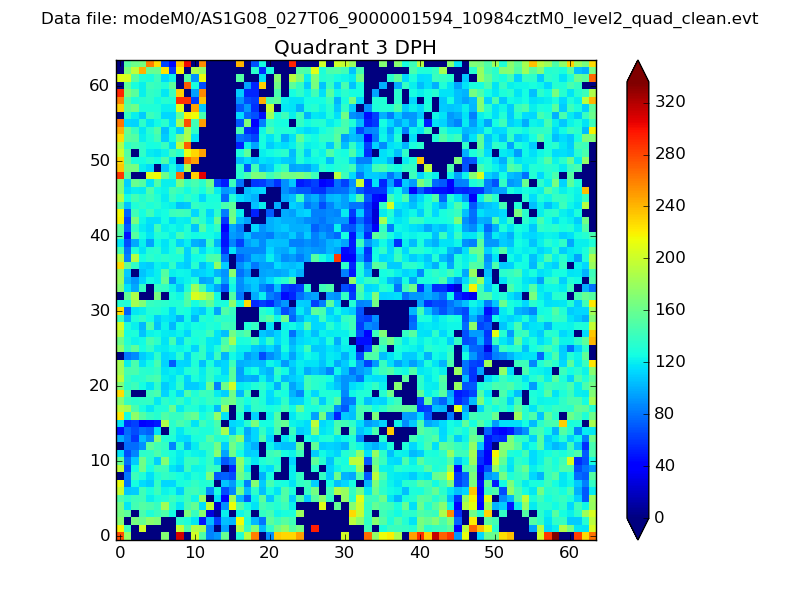 |
 |
Quadrant C |
| Plot type | Count rate plots | Images |
|---|---|---|
| Comparison with Poisson distribution Blue bars denote a histogram of data divided into 1 sec bins. Red curve is a Poisson curve with rate = median count rate of data. |
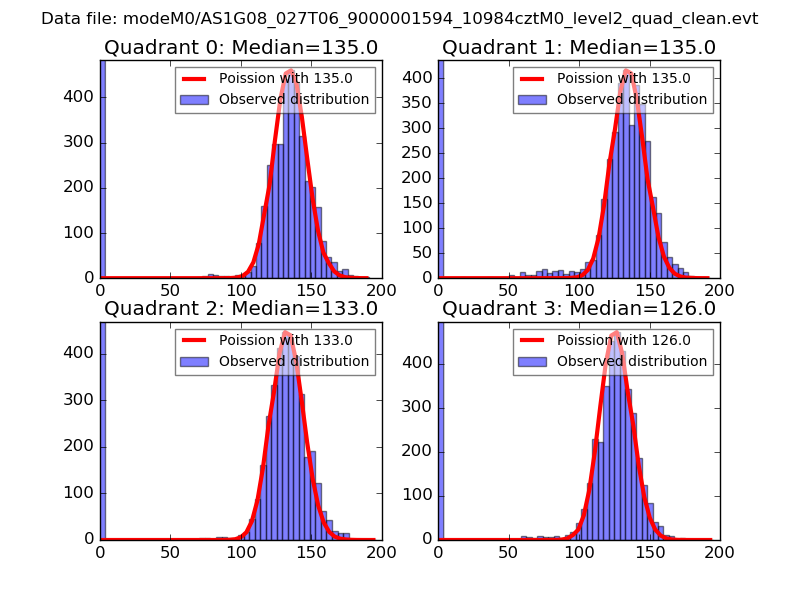 |
 |
| Quadrant-wise count rates Data is divided into 100 sec bins |
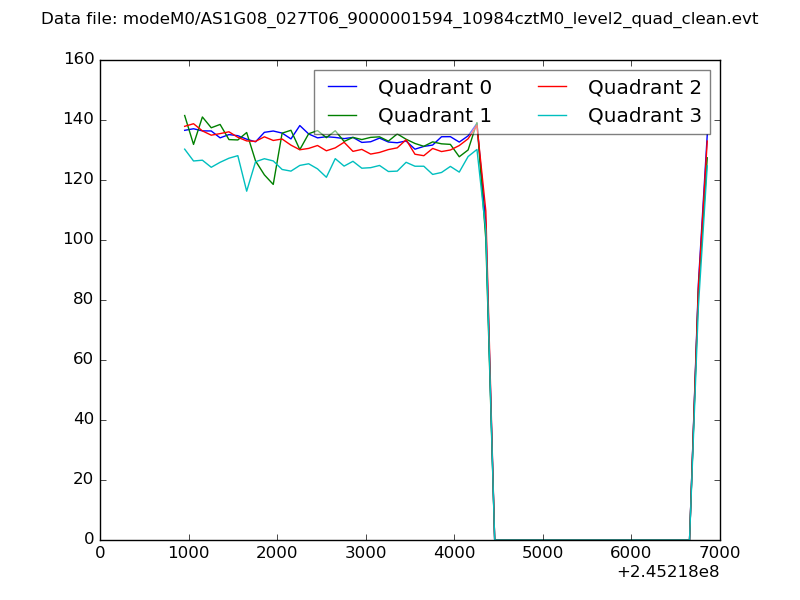 |
|
| Module-wise count rates for Quadrant A Data is divided into 100 sec bins |
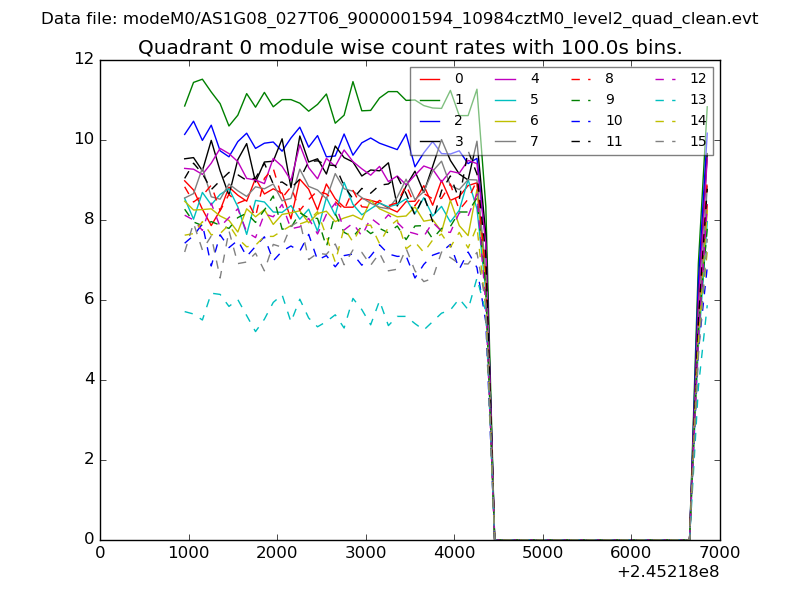 |
 |
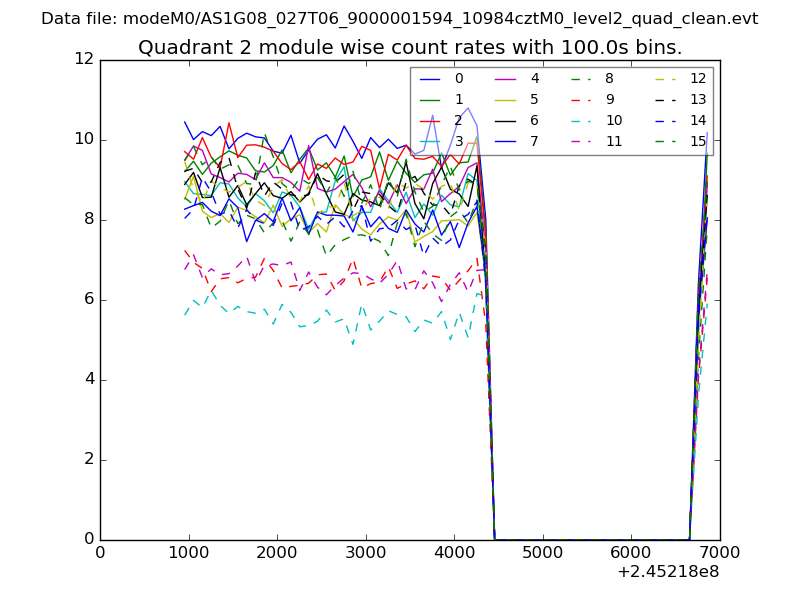
| Module-wise count rates for Quadrant B Data is divided into 100 sec bins |
 |
 |
| Module-wise count rates for Quadrant C Data is divided into 100 sec bins |
 |
 |
| Module-wise count rates for Quadrant D Data is divided into 100 sec bins |
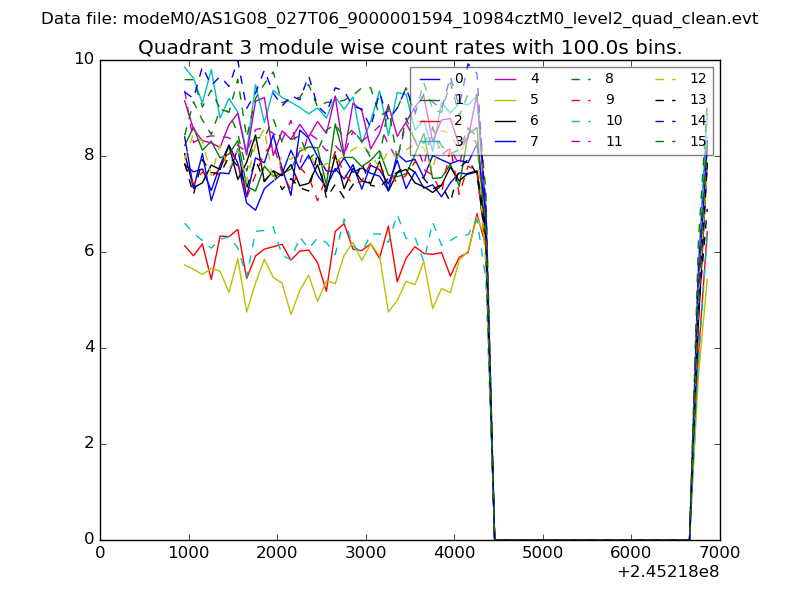 |
 |
| Parameter | Plot |
|---|---|
| CZT HV Monitor | 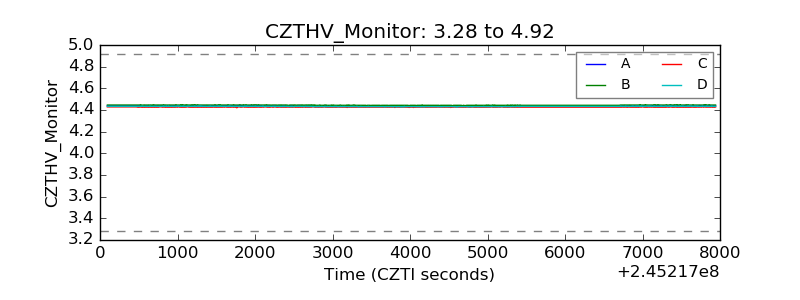 |
| D_VDD | 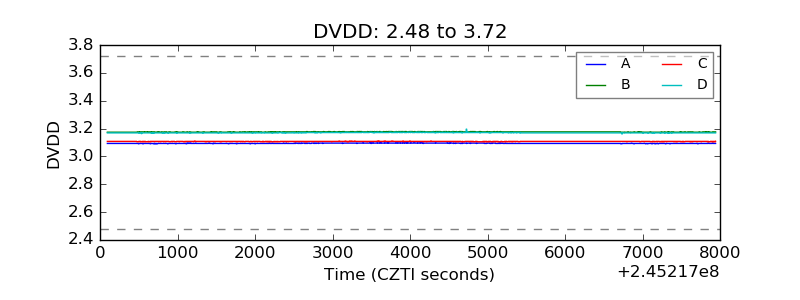 |
| Temperature 1 | 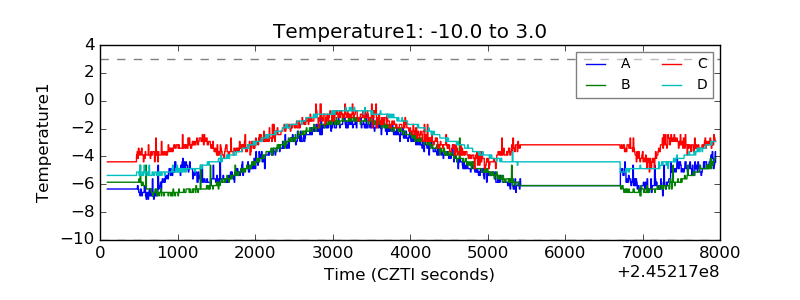 |
| Veto HV Monitor | 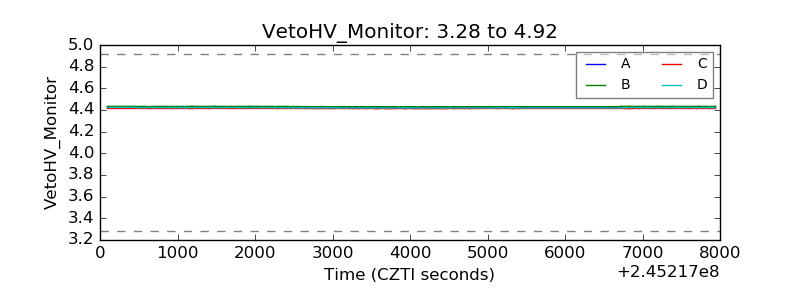 |
| Veto LLD | 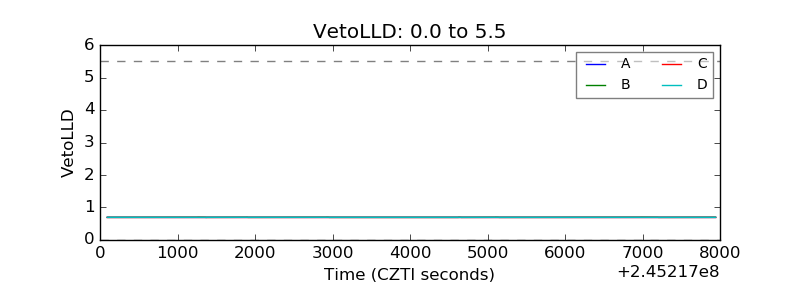 |
| Alpha Counter | 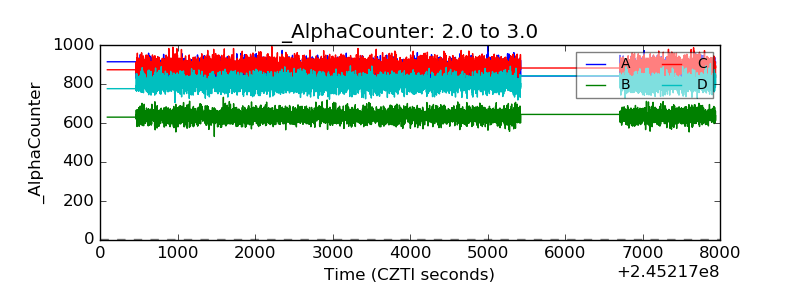 |
| _CPM_Rate | 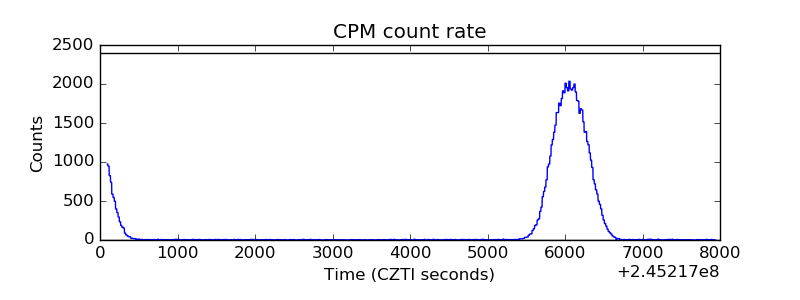 |
| CZT Counter | 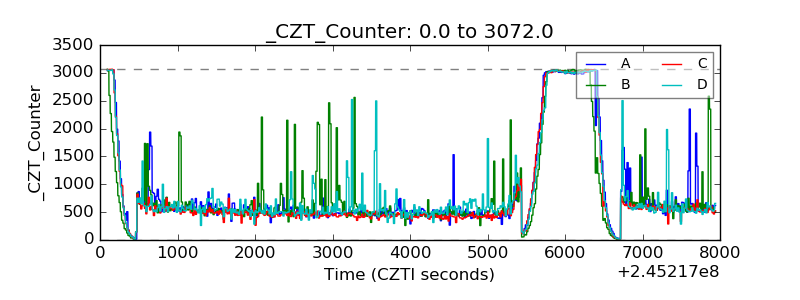 |
| +2.5 Volts monitor |  |
| +5 Volts monitor |  |
| _ROLL_ROT | 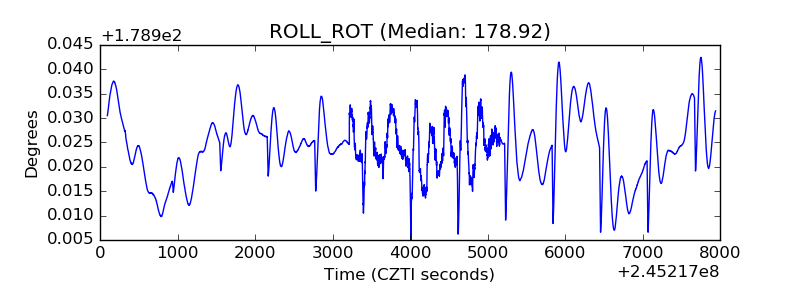 |
| _Roll_DEC | 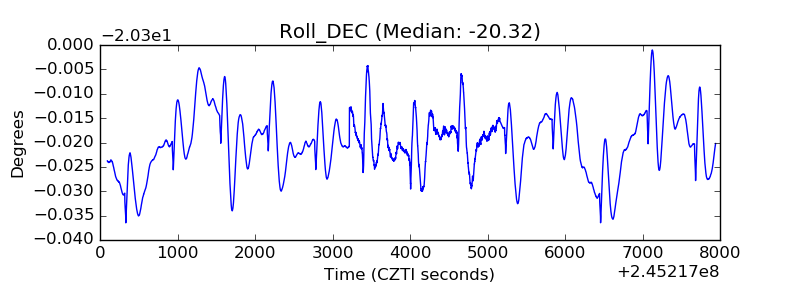 |
| _Roll_RA | 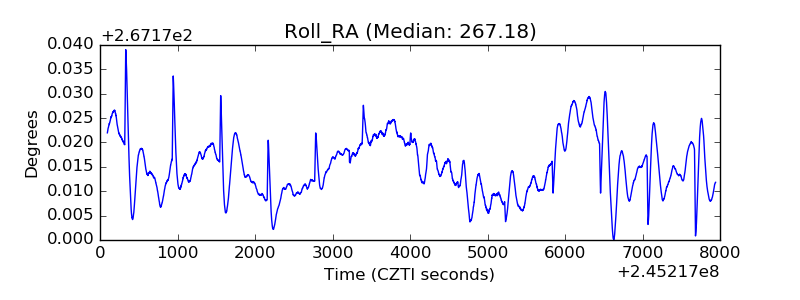 |
| Veto Counter |  |