| Param | Original file | Final file |
|---|---|---|
| Filename | modeM0/AS1G08_027T06_9000001594_10986cztM0_level2.evt | modeM0/AS1G08_027T06_9000001594_10986cztM0_level2_quad_clean.evt |
| Size (bytes) | 478,840,320 | 99,967,680 |
| Size | 456.7 MB | 95.3 MB |
| Events in quadrant A | 3,229,801 | 673,514 |
| Events in quadrant B | 4,122,067 | 659,189 |
| Events in quadrant C | 2,985,147 | 653,132 |
| Events in quadrant D | 3,756,889 | 621,993 |
| Mode M9 | |||
|---|---|---|---|
| Quadrant | BADHDUFLAG | Total packets | Discarded packets |
| A | 0 | 13 | 0 |
| B | 0 | 13 | 0 |
| C | 0 | 13 | 0 |
| D | 0 | 13 | 0 |
| Mode M0 | |||
|---|---|---|---|
| Quadrant | BADHDUFLAG | Total packets | Discarded packets |
| A | 0 | 13213 | 2 |
| B | 0 | 16208 | 1 |
| C | 0 | 12585 | 1 |
| D | 0 | 14995 | 1 |
| Mode SS | |||
|---|---|---|---|
| Quadrant | BADHDUFLAG | Total packets | Discarded packets |
| A | 0 | 122 | 0 |
| B | 0 | 122 | 0 |
| C | 0 | 122 | 0 |
| D | 0 | 122 | 0 |
| Quadrant | Total seconds | Saturated seconds | Saturation percentage |
|---|---|---|---|
| A | 6008 | 111 | 1.847537% |
| B | 6008 | 335 | 5.575899% |
| C | 6008 | 78 | 1.298269% |
| D | 6008 | 170 | 2.829561% |
Noise dominated data is calculated using 1-second bins in cleaned event files. If a bin has >2000 counts, and if more than 50% of those come from <1% of pixels, then it is considered to be noise-dominated and hence unusable.
| Quadrant | # 1 sec bins | Bins with >0 counts | Bins with >2000 counts | High rate bins dominated by noise | Noise dominated (total time) | Noise dominated (detector-on time) | Marked lightcurve |
|---|---|---|---|---|---|---|---|
| A | 7283 | 6009 | 11 | 11 | 0.15% | 0.18% | 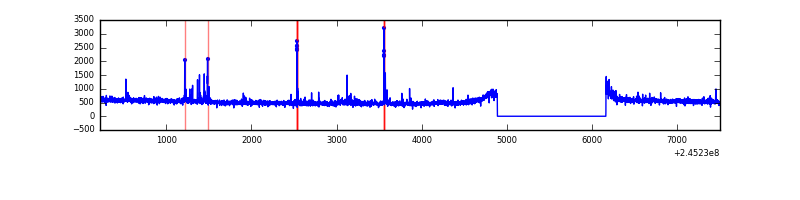 |
| B | 7283 | 6008 | 156 | 156 | 2.14% | 2.60% | 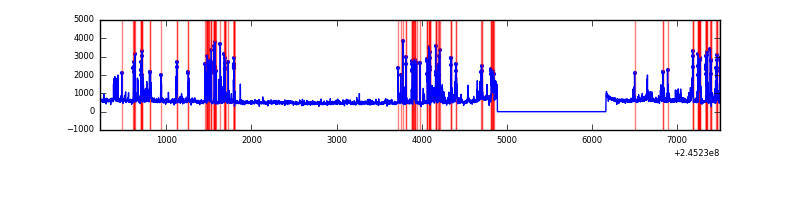 |
| C | 7283 | 6009 | 0 | 0 | 0.00% | 0.00% | 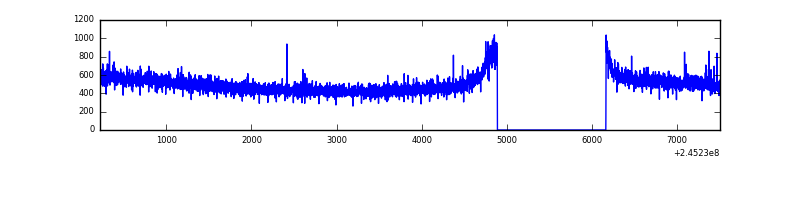 |
| D | 7283 | 6009 | 69 | 69 | 0.95% | 1.15% | 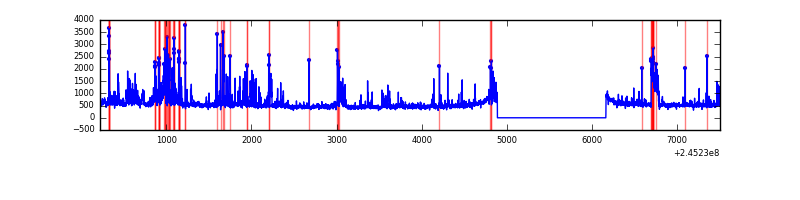 |
Top three noisy pixels from each quadrant. If the there are fewer than three noisy pixels in the level2.evt file, extra rows are filled as -1
| Pixel properties | Quadrant properties | ||||||
|---|---|---|---|---|---|---|---|
| Quadrant | DetID | PixID | Counts | Sigma | Mean | Median | Sigma |
| A | 8 | 5 | 61255 | 371.16 | 803 | 790 | 162.9 |
| A | 15 | 223 | 33088 | 198.26 | 803 | 790 | 162.9 |
| A | 15 | 239 | 14770 | 85.81 | 803 | 790 | 162.9 |
| B | 4 | 239 | 932000 | 6351.88 | 776 | 761 | 146.6 |
| B | 0 | 214 | 75178 | 507.59 | 776 | 761 | 146.6 |
| B | 0 | 187 | 20906 | 137.41 | 776 | 761 | 146.6 |
| C | 1 | 3 | 7746 | 40.03 | 763 | 767 | 174.3 |
| C | 13 | 61 | 5628 | 27.88 | 763 | 767 | 174.3 |
| C | 9 | 54 | 3513 | 15.75 | 763 | 767 | 174.3 |
| D | 1 | 52 | 424217 | 2335.03 | 767 | 748 | 181.4 |
| D | 13 | 152 | 103352 | 565.76 | 767 | 748 | 181.4 |
| D | 8 | 195 | 98058 | 536.57 | 767 | 748 | 181.4 |
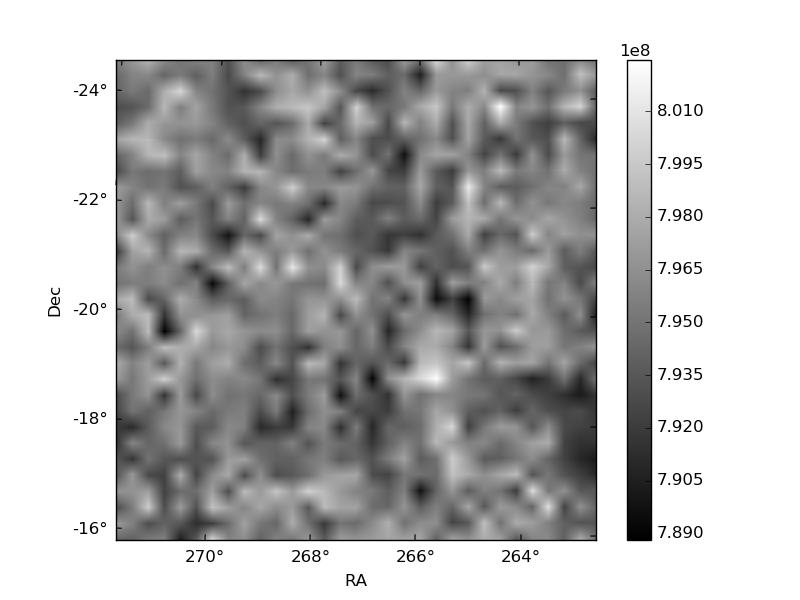
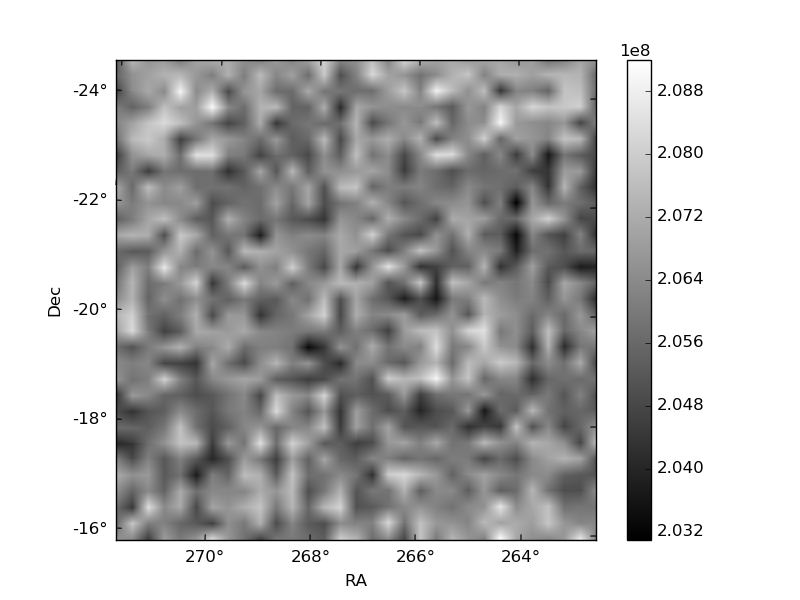
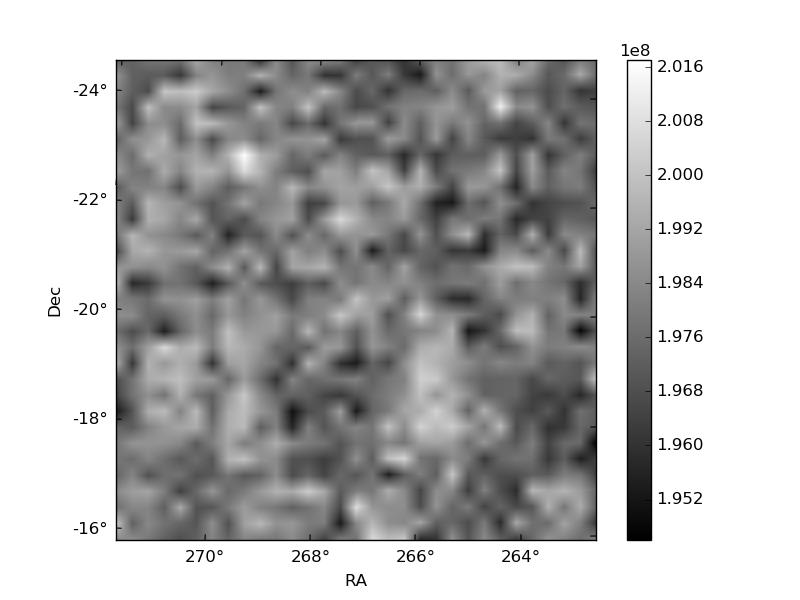
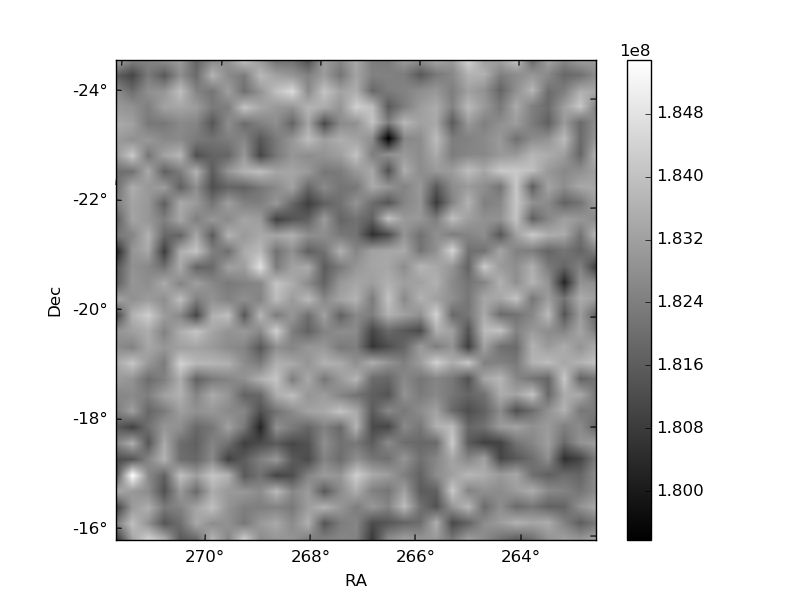
Histogram calculated using DETX and DETY for each event in the final _common_clean file
| Quadrant A | 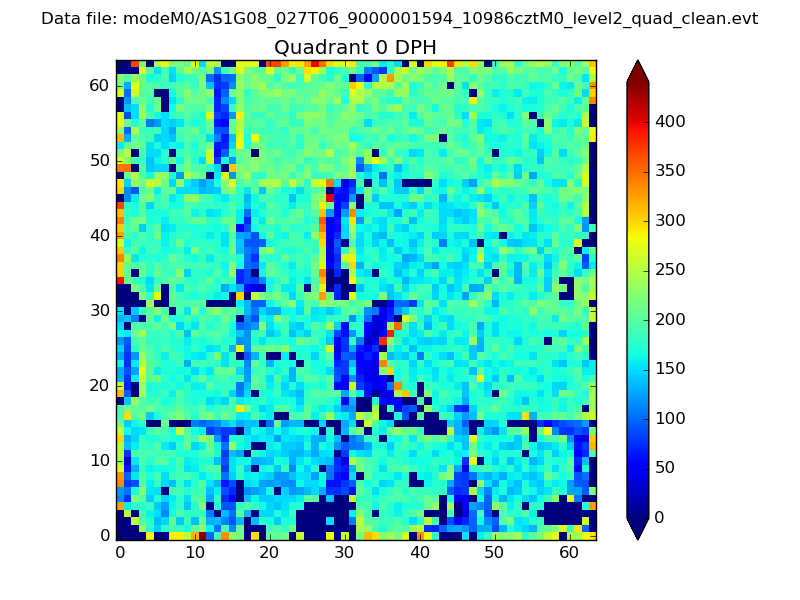 |
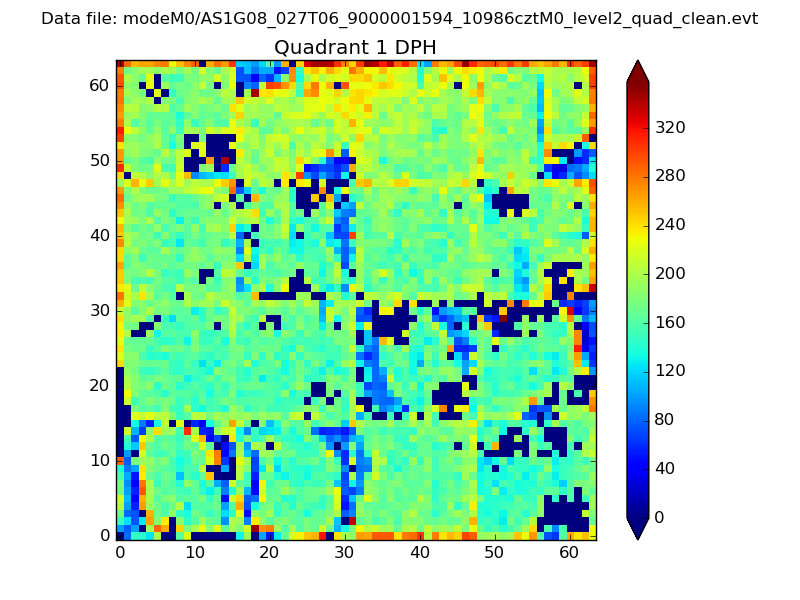 |
Quadrant B |
|---|---|---|---|
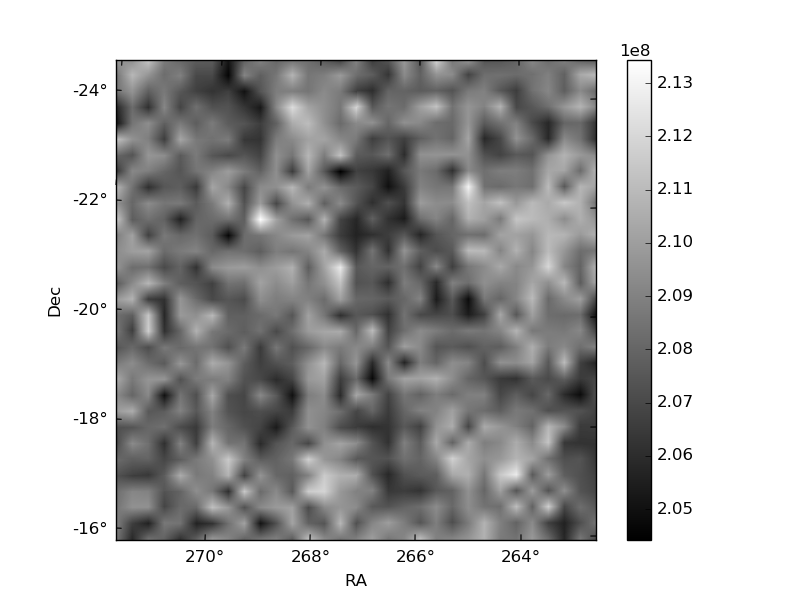
| Quadrant D | 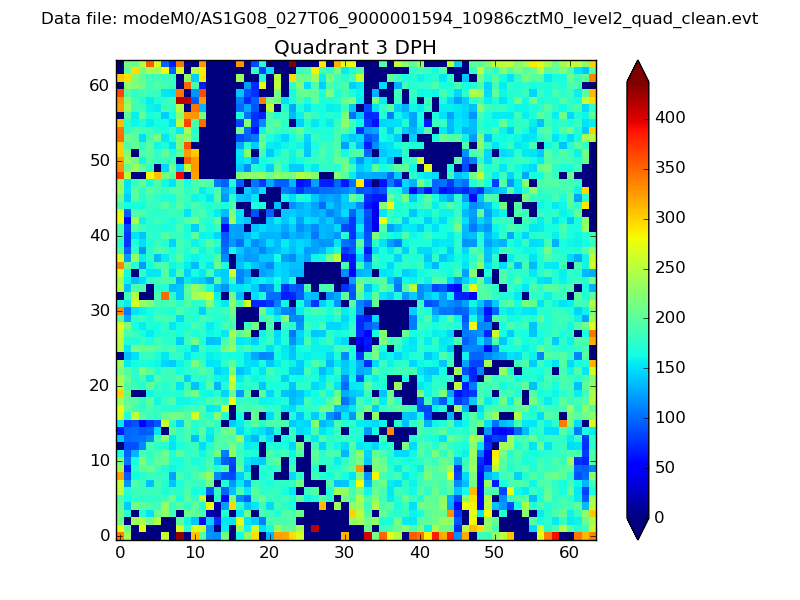 |
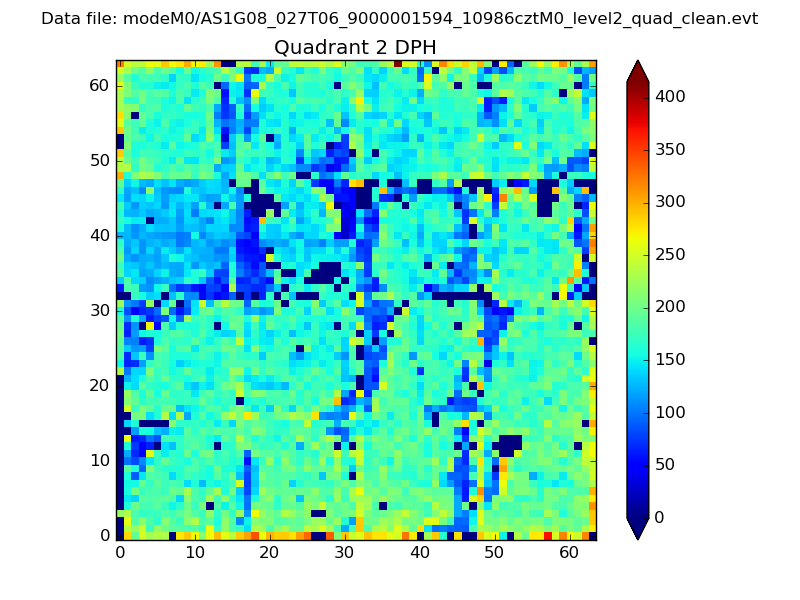 |
Quadrant C |
| Plot type | Count rate plots | Images |
|---|---|---|
| Comparison with Poisson distribution Blue bars denote a histogram of data divided into 1 sec bins. Red curve is a Poisson curve with rate = median count rate of data. |
 |
 |
| Quadrant-wise count rates Data is divided into 100 sec bins |
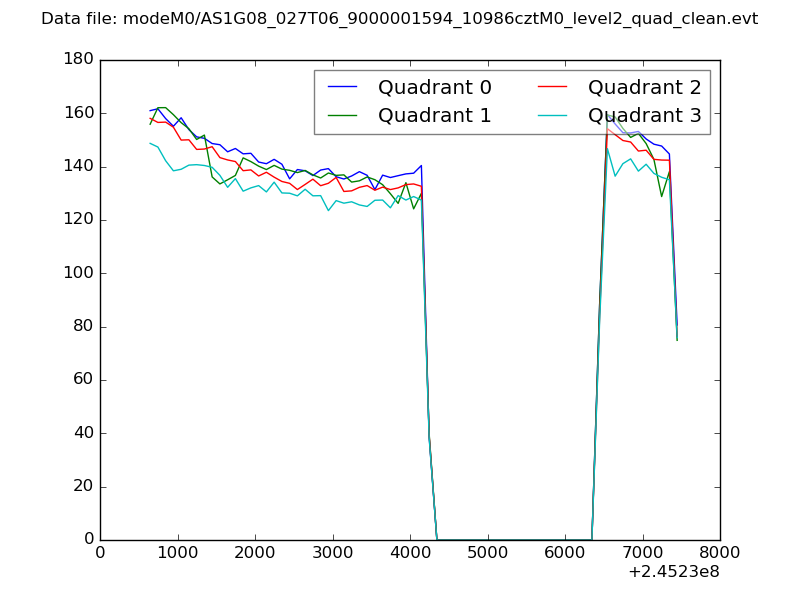 |
|
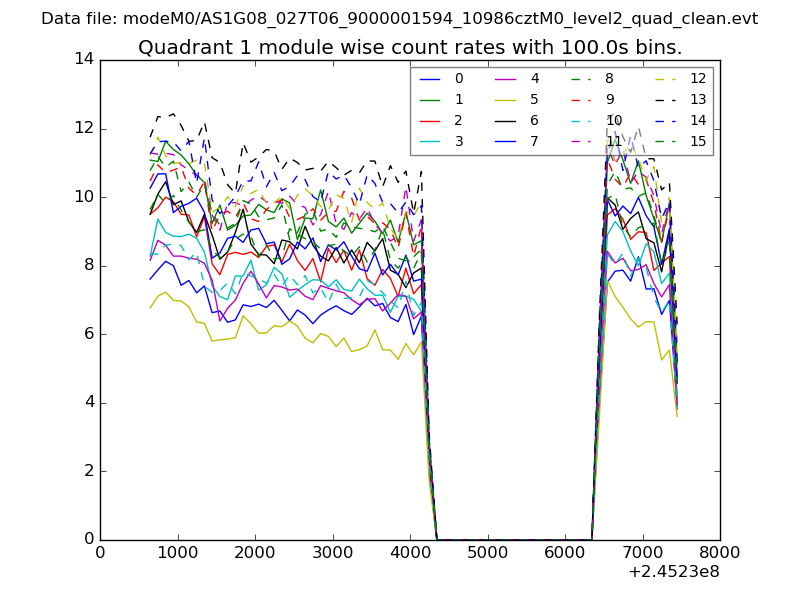
| Module-wise count rates for Quadrant A Data is divided into 100 sec bins |
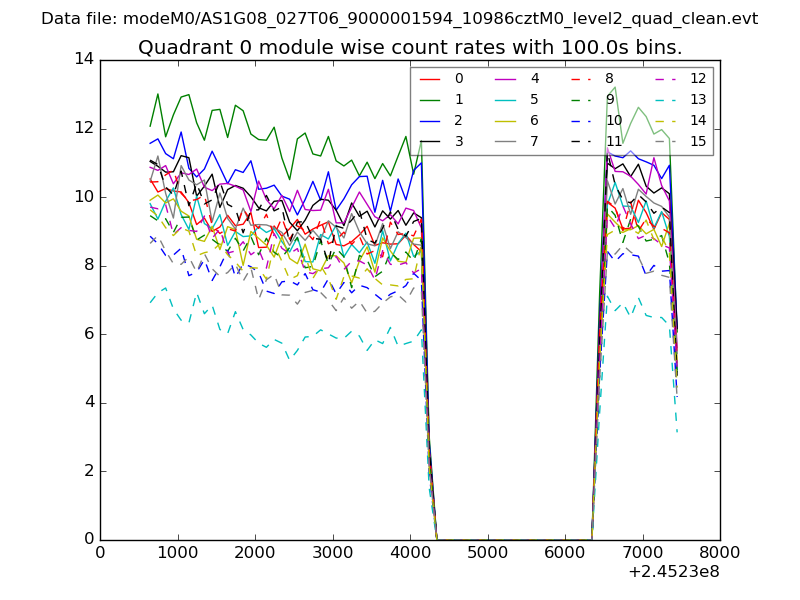 |
 |
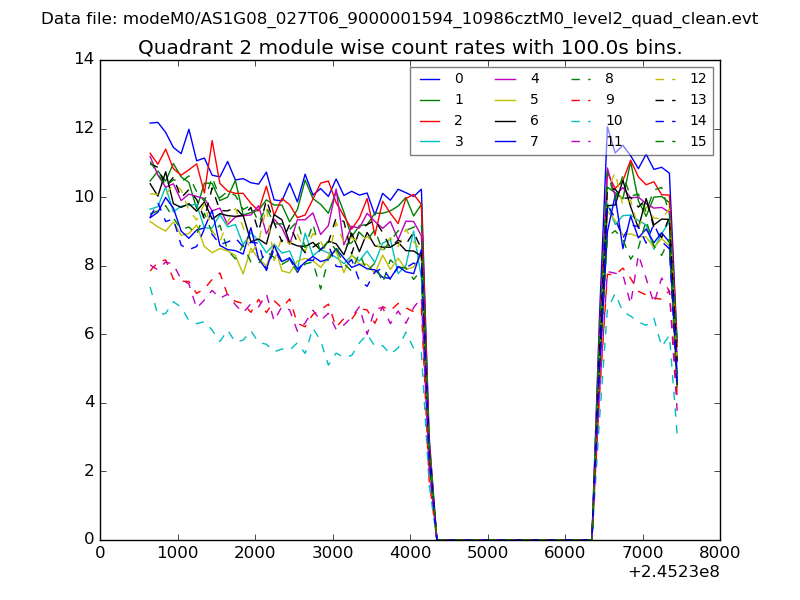
| Module-wise count rates for Quadrant B Data is divided into 100 sec bins |
 |
 |
| Module-wise count rates for Quadrant C Data is divided into 100 sec bins |
 |
 |
| Module-wise count rates for Quadrant D Data is divided into 100 sec bins |
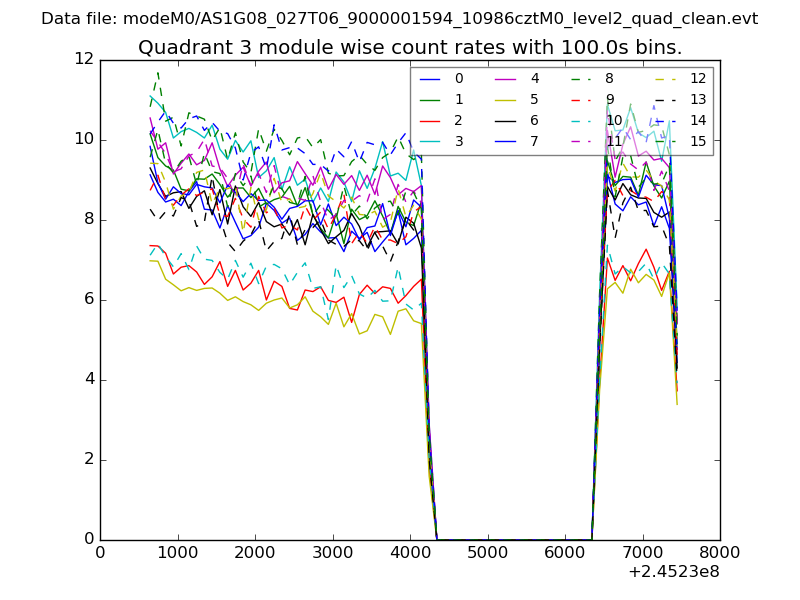 |
 |
| Parameter | Plot |
|---|---|
| CZT HV Monitor | 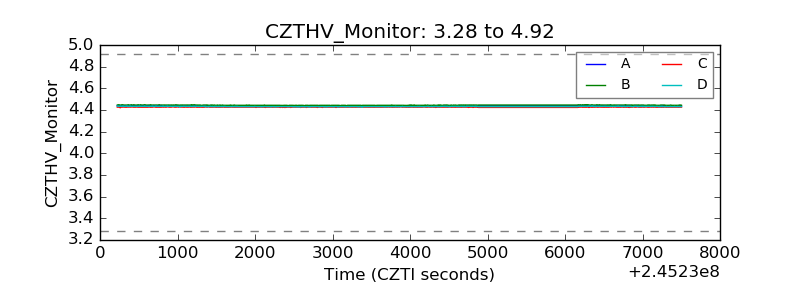 |
| D_VDD | 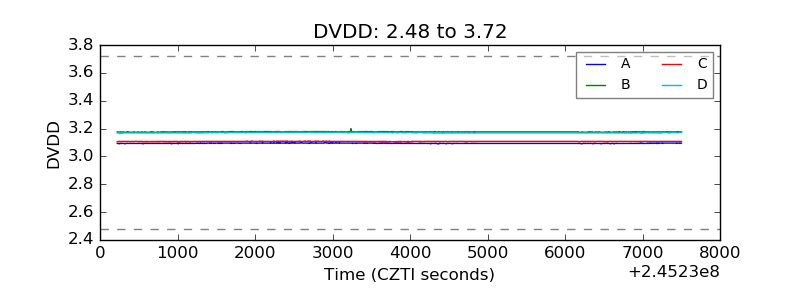 |
| Temperature 1 | 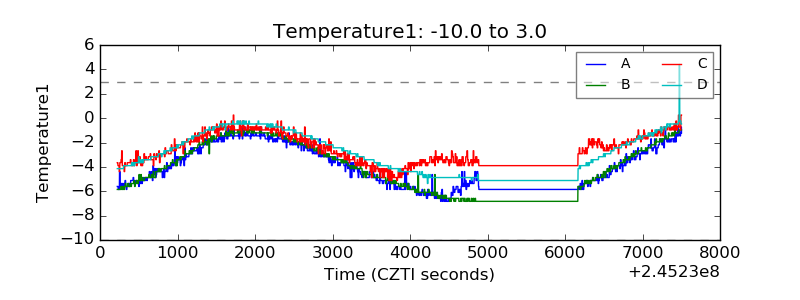 |
| Veto HV Monitor | 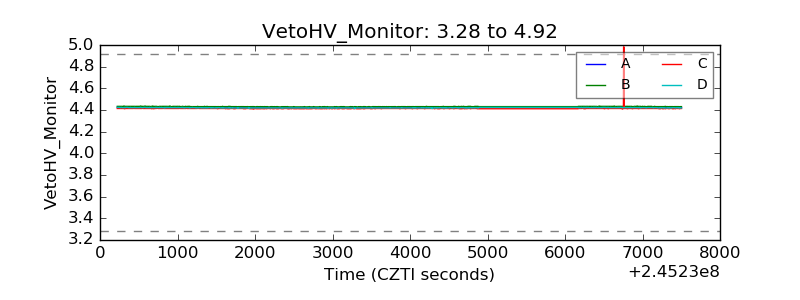 |
| Veto LLD | 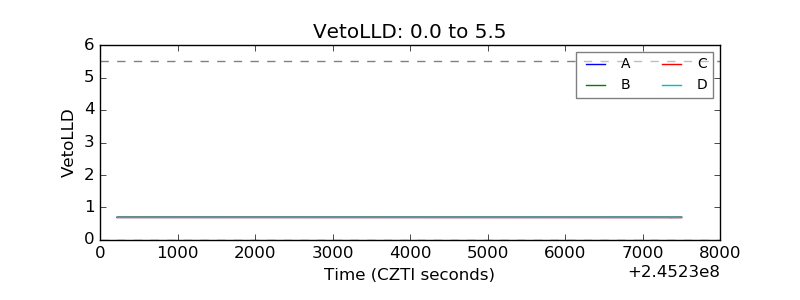 |
| Alpha Counter | 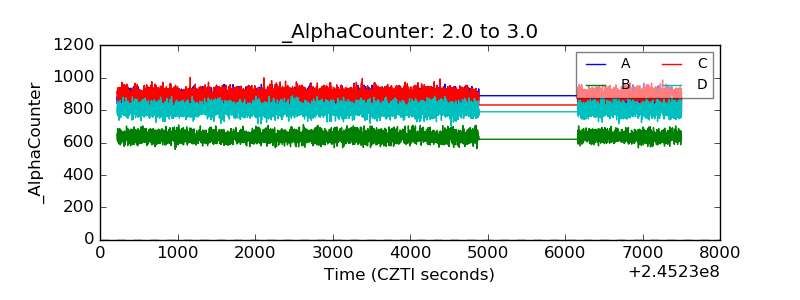 |
| _CPM_Rate | 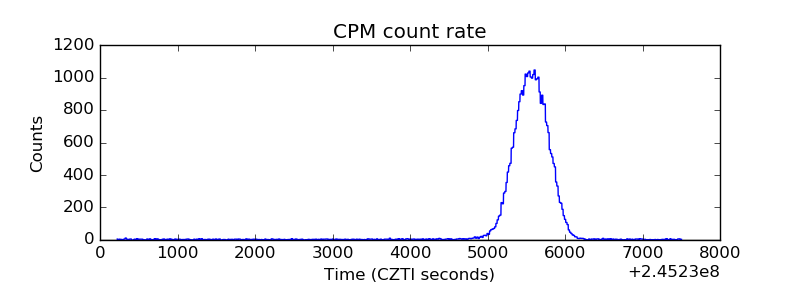 |
| CZT Counter | 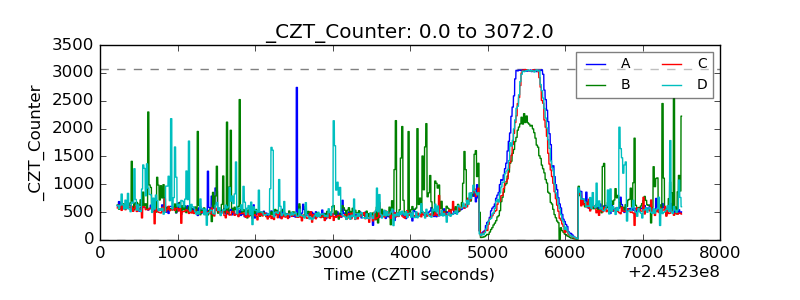 |
| +2.5 Volts monitor | 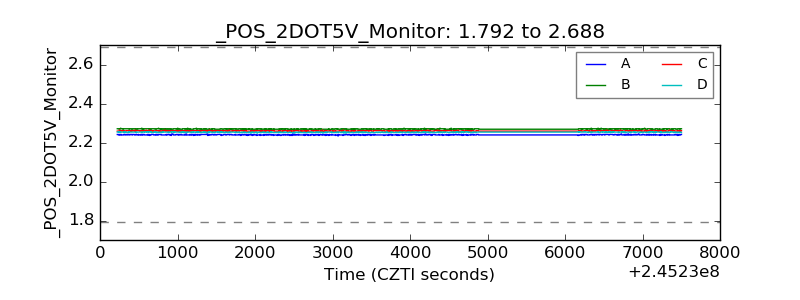 |
| +5 Volts monitor |  |
| _ROLL_ROT | 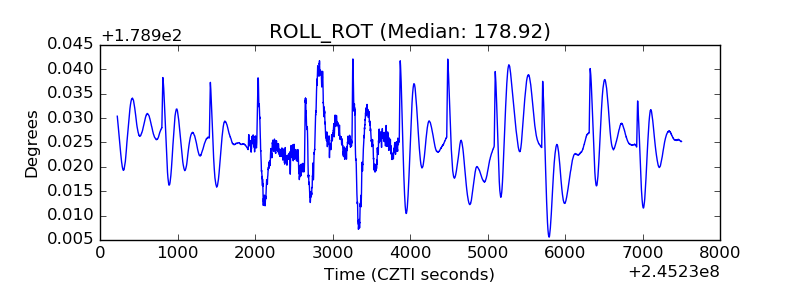 |
| _Roll_DEC | 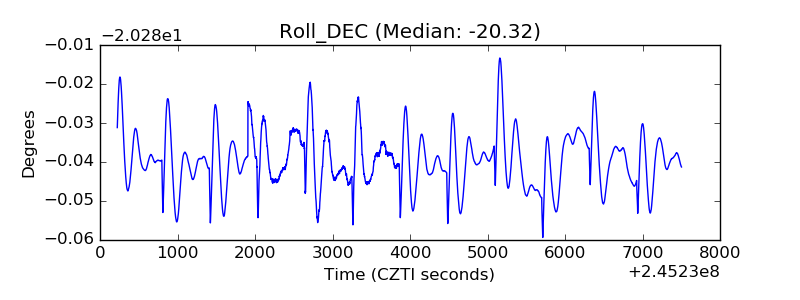 |
| _Roll_RA | 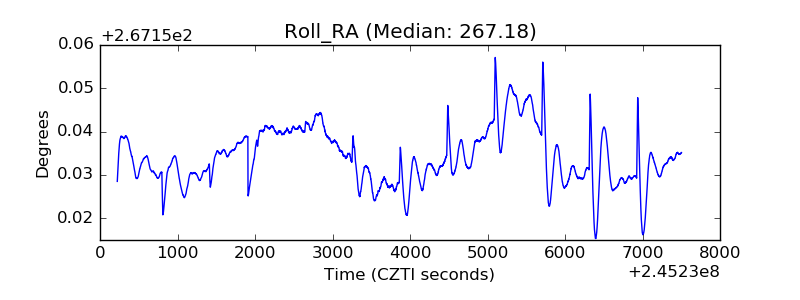 |
| Veto Counter | 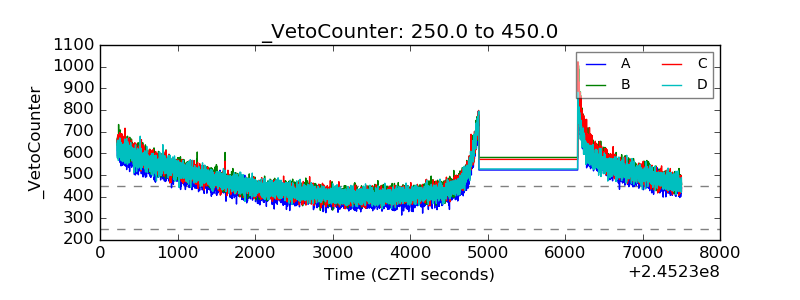 |