| Param | Original file | Final file |
|---|---|---|
| Filename | modeM0/AS1G08_027T06_9000001594_10987cztM0_level2.evt | modeM0/AS1G08_027T06_9000001594_10987cztM0_level2_quad_clean.evt |
| Size (bytes) | 488,485,440 | 101,903,040 |
| Size | 465.9 MB | 97.2 MB |
| Events in quadrant A | 3,243,100 | 686,680 |
| Events in quadrant B | 4,665,106 | 668,590 |
| Events in quadrant C | 2,907,221 | 666,316 |
| Events in quadrant D | 3,564,412 | 638,856 |
| Mode M9 | |||
|---|---|---|---|
| Quadrant | BADHDUFLAG | Total packets | Discarded packets |
| A | 0 | 12 | 0 |
| B | 0 | 12 | 0 |
| C | 0 | 12 | 0 |
| D | 0 | 12 | 0 |
| Mode M0 | |||
|---|---|---|---|
| Quadrant | BADHDUFLAG | Total packets | Discarded packets |
| A | 0 | 13400 | 2 |
| B | 0 | 17906 | 1 |
| C | 0 | 12664 | 1 |
| D | 0 | 14529 | 1 |
| Mode SS | |||
|---|---|---|---|
| Quadrant | BADHDUFLAG | Total packets | Discarded packets |
| A | 0 | 122 | 0 |
| B | 0 | 122 | 0 |
| C | 0 | 122 | 0 |
| D | 0 | 122 | 0 |
| Quadrant | Total seconds | Saturated seconds | Saturation percentage |
|---|---|---|---|
| A | 6102 | 160 | 2.622091% |
| B | 6102 | 548 | 8.980662% |
| C | 6102 | 93 | 1.524090% |
| D | 6102 | 251 | 4.113405% |
Noise dominated data is calculated using 1-second bins in cleaned event files. If a bin has >2000 counts, and if more than 50% of those come from <1% of pixels, then it is considered to be noise-dominated and hence unusable.
| Quadrant | # 1 sec bins | Bins with >0 counts | Bins with >2000 counts | High rate bins dominated by noise | Noise dominated (total time) | Noise dominated (detector-on time) | Marked lightcurve |
|---|---|---|---|---|---|---|---|
| A | 7222 | 6102 | 9 | 9 | 0.12% | 0.15% | 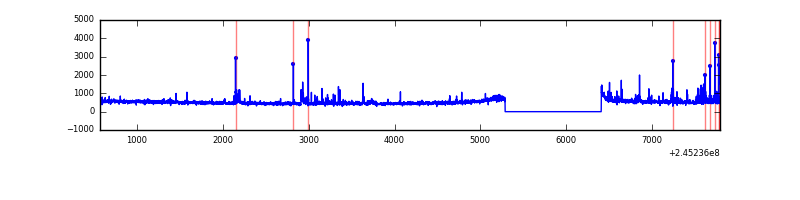 |
| B | 7222 | 6102 | 290 | 290 | 4.02% | 4.75% | 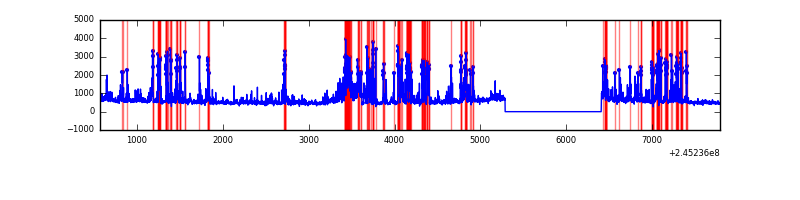 |
| C | 7222 | 6102 | 1 | 1 | 0.01% | 0.02% | 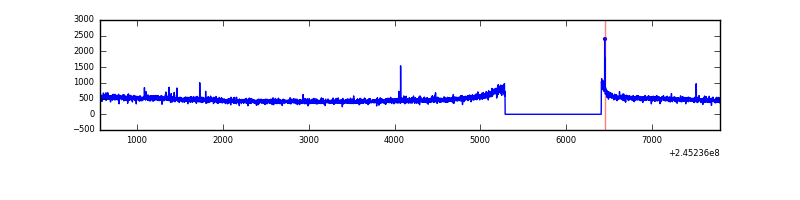 |
| D | 7222 | 6102 | 101 | 101 | 1.40% | 1.66% | 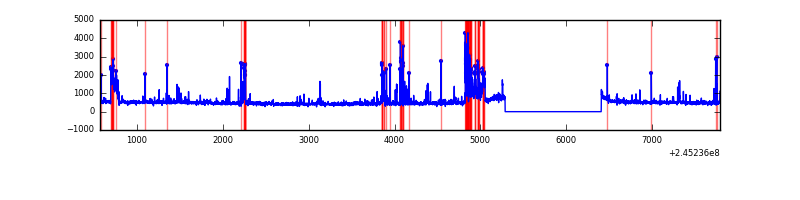 |
Top three noisy pixels from each quadrant. If the there are fewer than three noisy pixels in the level2.evt file, extra rows are filled as -1
| Pixel properties | Quadrant properties | ||||||
|---|---|---|---|---|---|---|---|
| Quadrant | DetID | PixID | Counts | Sigma | Mean | Median | Sigma |
| A | 8 | 5 | 171114 | 1077.24 | 780 | 767 | 158.1 |
| A | 15 | 223 | 36774 | 227.7 | 780 | 767 | 158.1 |
| A | 8 | 15 | 19021 | 115.44 | 780 | 767 | 158.1 |
| B | 4 | 239 | 1510836 | 10604.79 | 753 | 736 | 142.4 |
| B | 0 | 214 | 80859 | 562.67 | 753 | 736 | 142.4 |
| B | 0 | 229 | 43544 | 300.62 | 753 | 736 | 142.4 |
| C | 1 | 3 | 13138 | 72.65 | 740 | 746 | 170.6 |
| C | 12 | 4 | 9469 | 51.14 | 740 | 746 | 170.6 |
| C | 13 | 61 | 5500 | 27.87 | 740 | 746 | 170.6 |
| D | 1 | 52 | 258328 | 1436.33 | 742 | 721 | 179.4 |
| D | 10 | 253 | 136407 | 756.54 | 742 | 721 | 179.4 |
| D | 13 | 104 | 105691 | 585.27 | 742 | 721 | 179.4 |
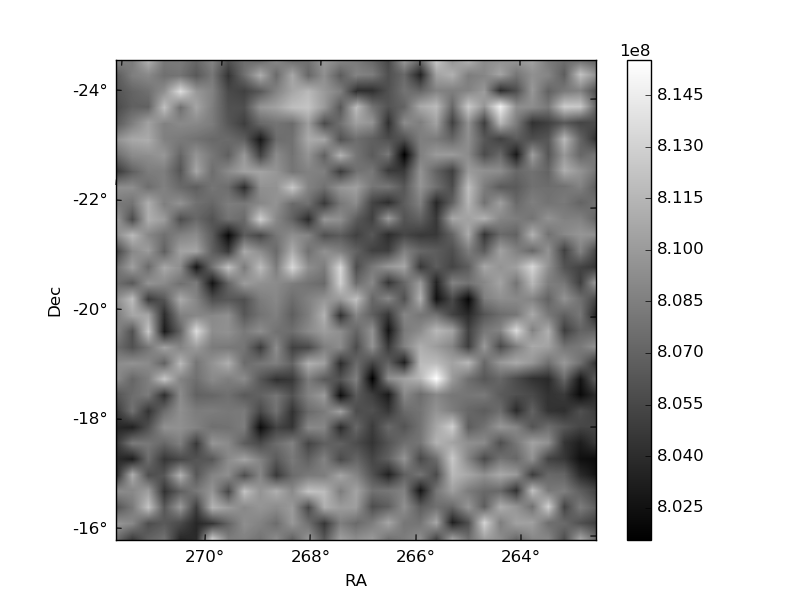
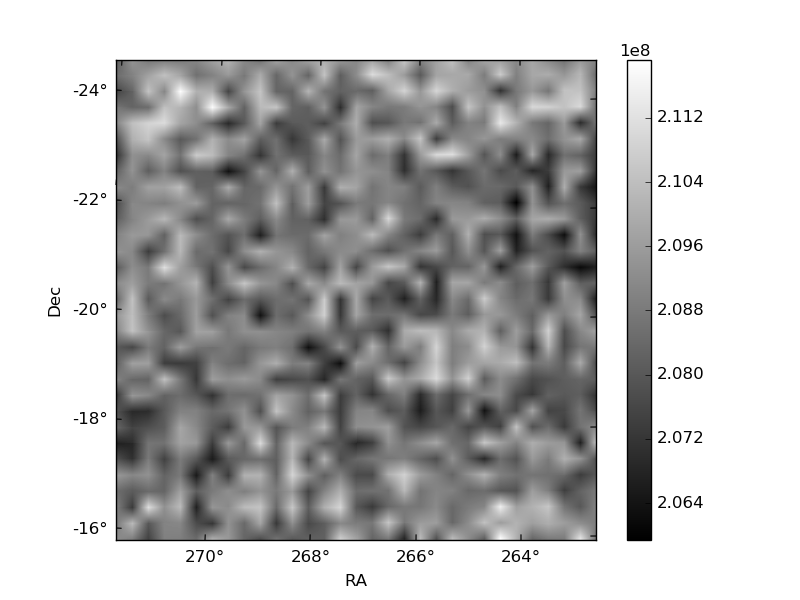
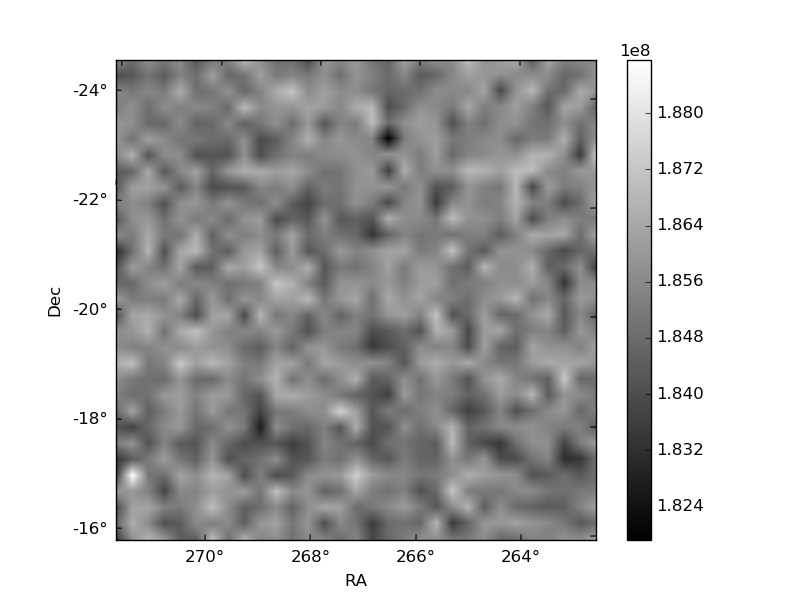
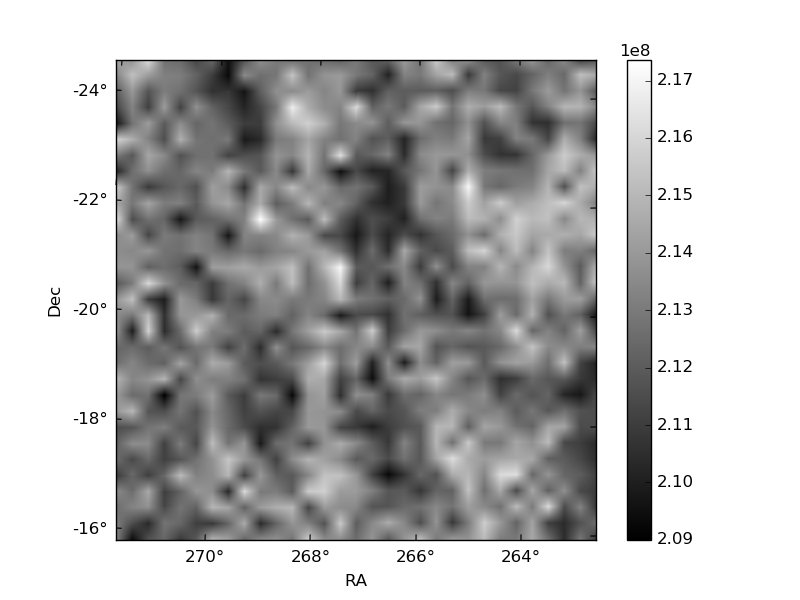
Histogram calculated using DETX and DETY for each event in the final _common_clean file
| Quadrant A | 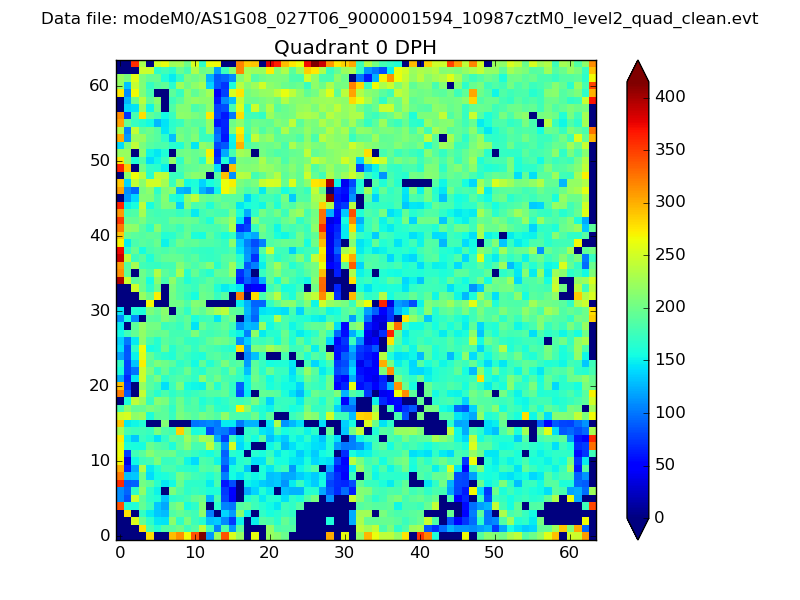 |
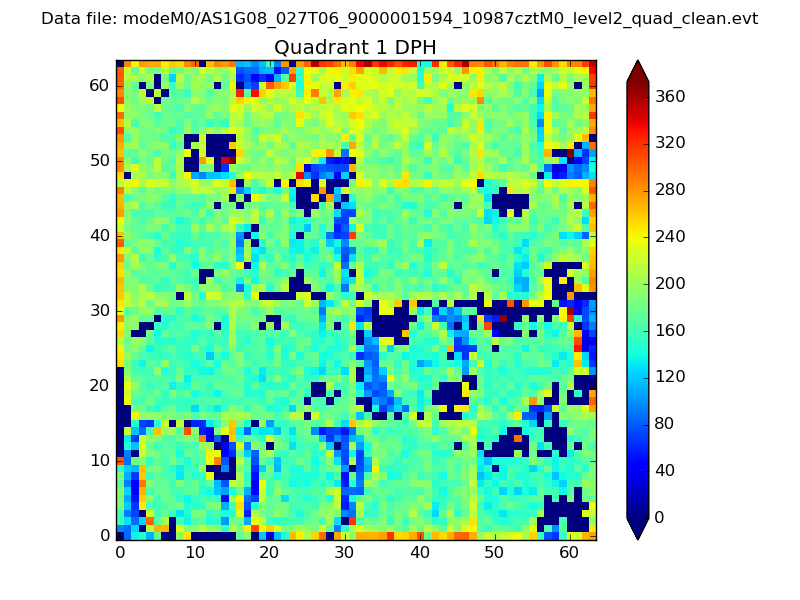 |
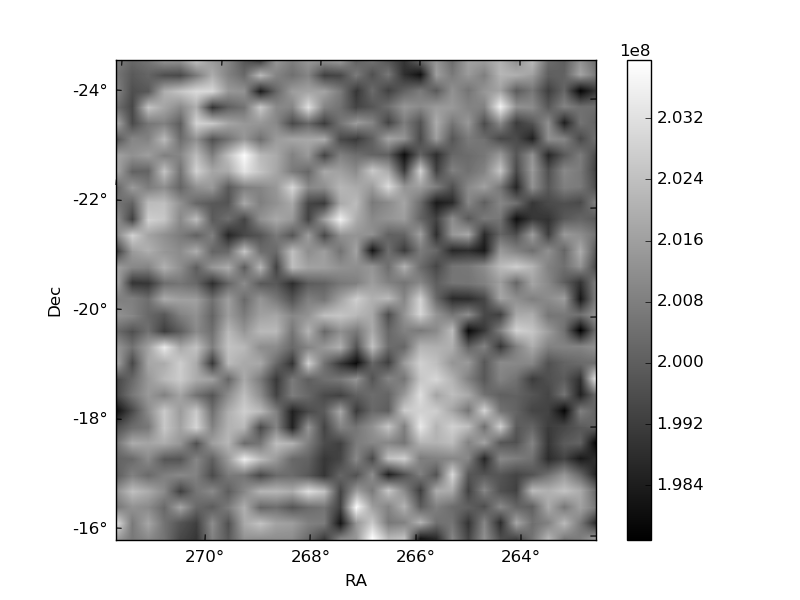
Quadrant B |
|---|---|---|---|
| Quadrant D | 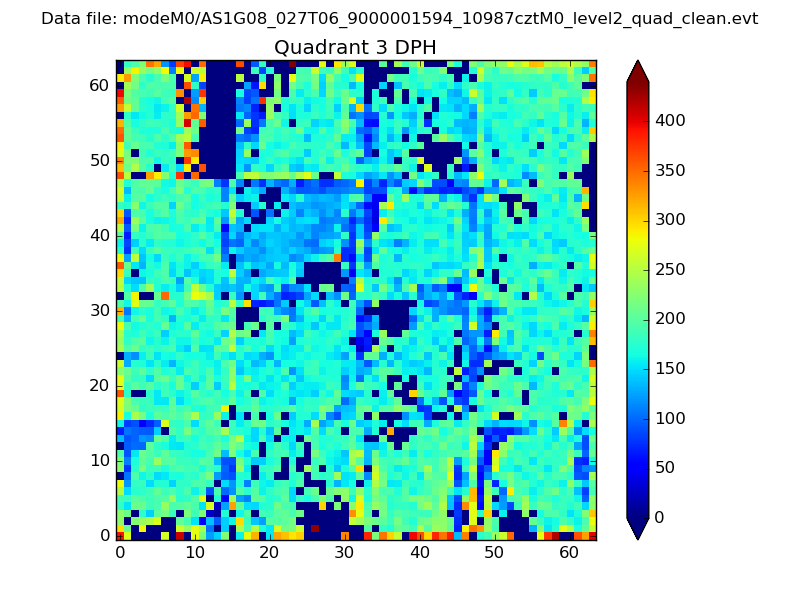 |
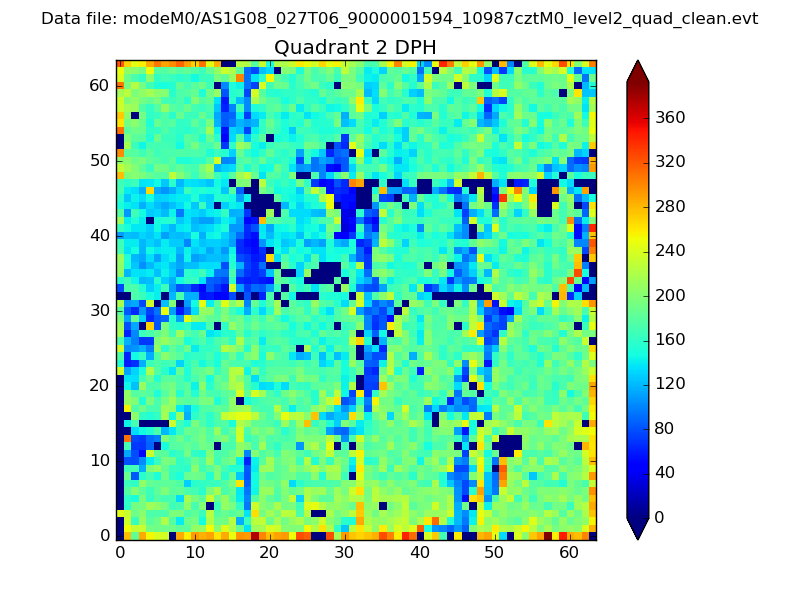 |
Quadrant C |
| Plot type | Count rate plots | Images |
|---|---|---|
| Comparison with Poisson distribution Blue bars denote a histogram of data divided into 1 sec bins. Red curve is a Poisson curve with rate = median count rate of data. |
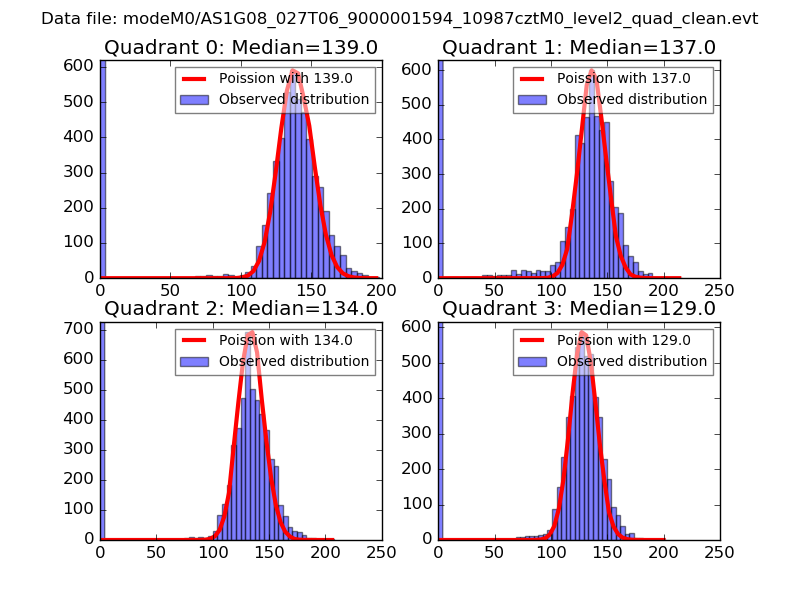 |
 |
| Quadrant-wise count rates Data is divided into 100 sec bins |
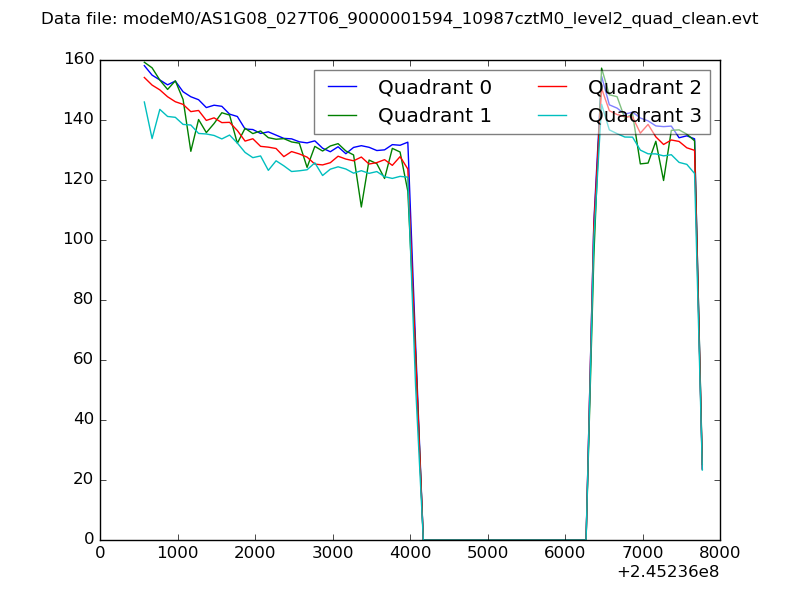 |
|
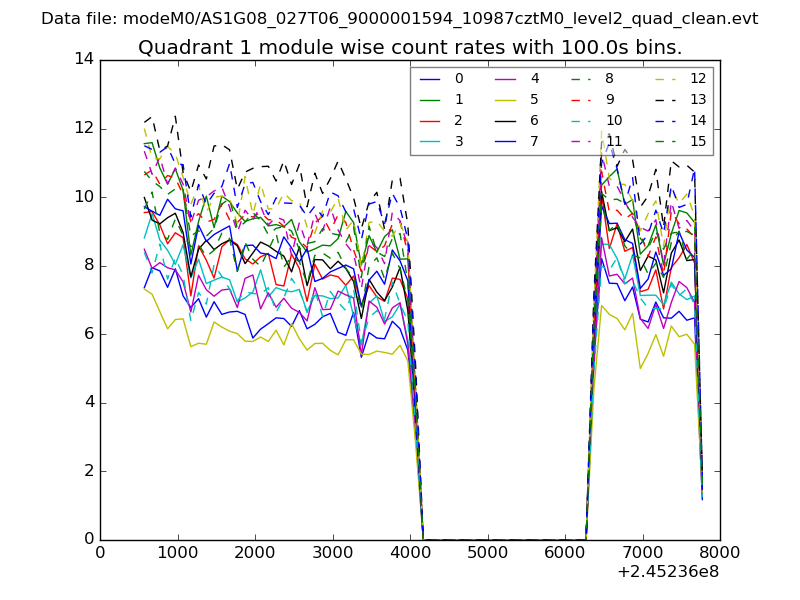
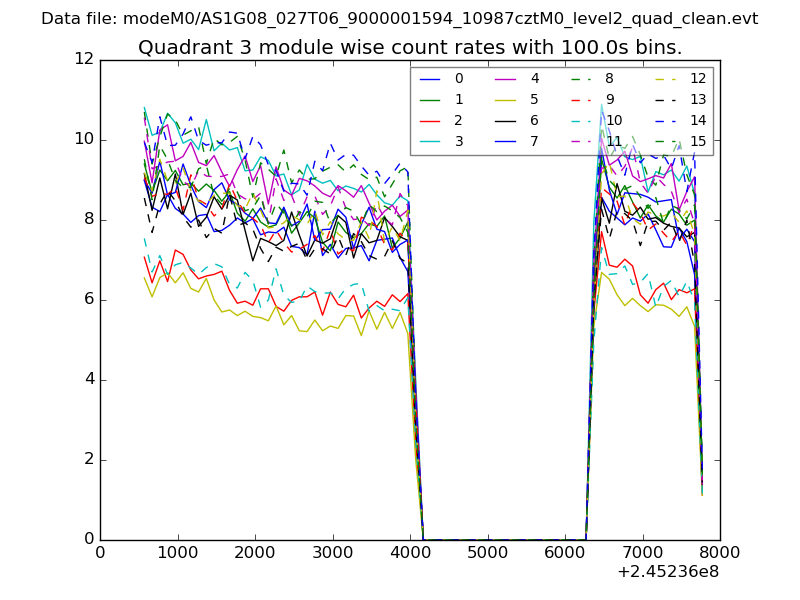
| Module-wise count rates for Quadrant A Data is divided into 100 sec bins |
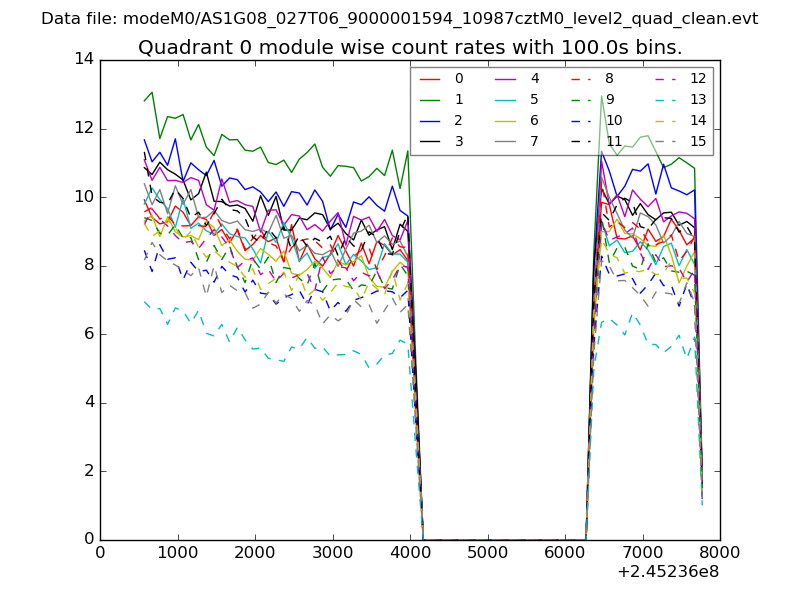 |
 |
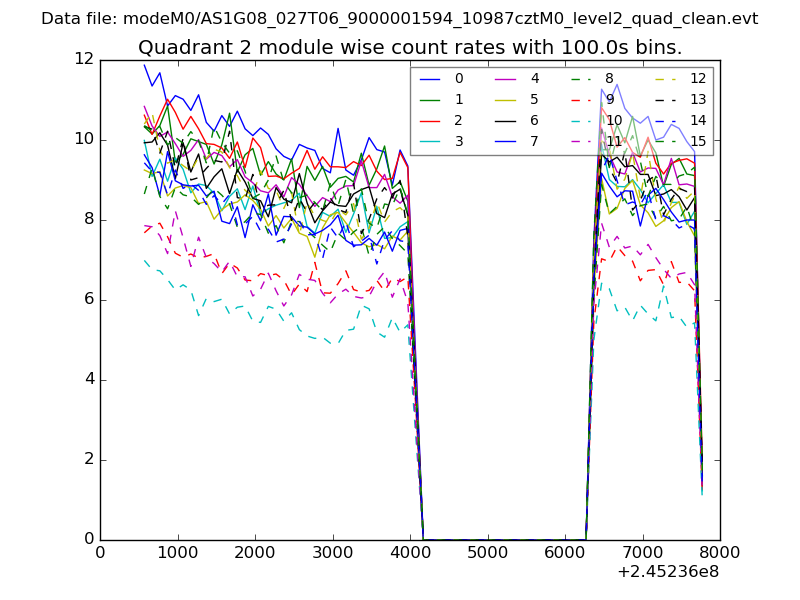
| Module-wise count rates for Quadrant B Data is divided into 100 sec bins |
 |
 |
| Module-wise count rates for Quadrant C Data is divided into 100 sec bins |
 |
 |
| Module-wise count rates for Quadrant D Data is divided into 100 sec bins |
 |
 |
| Parameter | Plot |
|---|---|
| CZT HV Monitor | 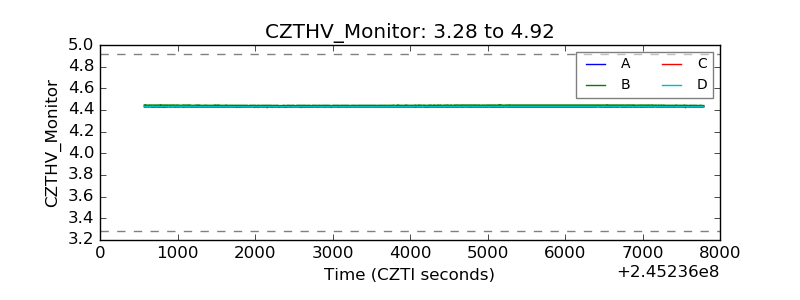 |
| D_VDD | 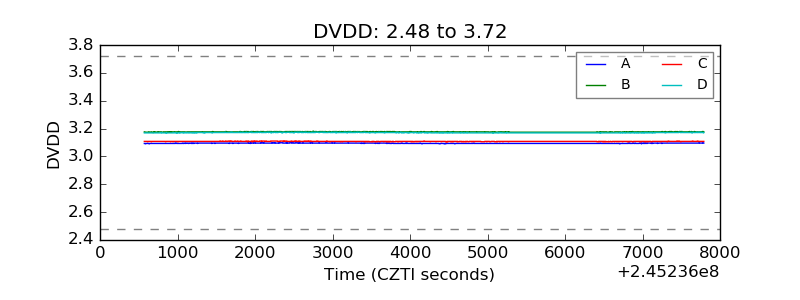 |
| Temperature 1 | 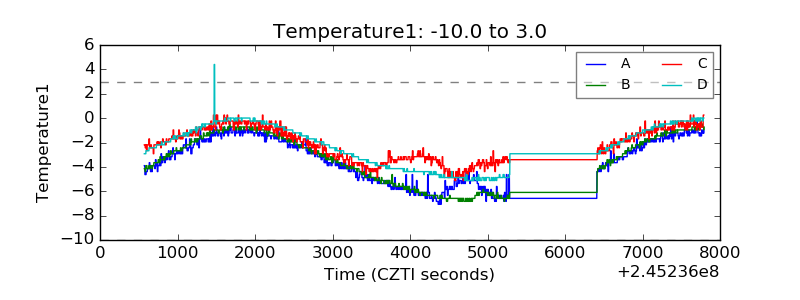 |
| Veto HV Monitor | 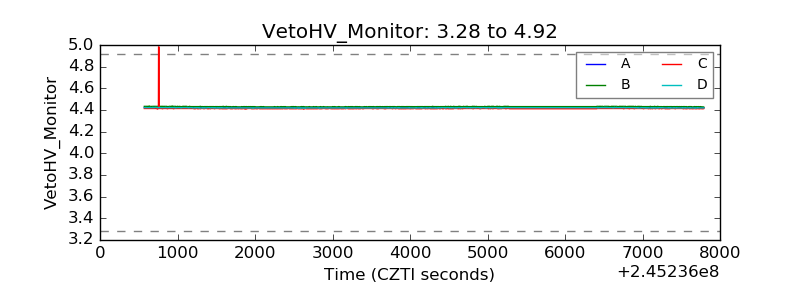 |
| Veto LLD | 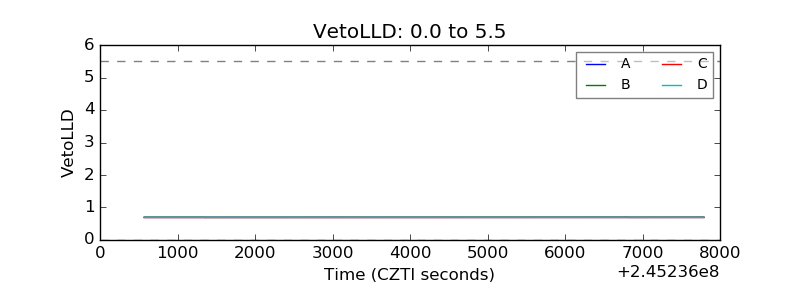 |
| Alpha Counter | 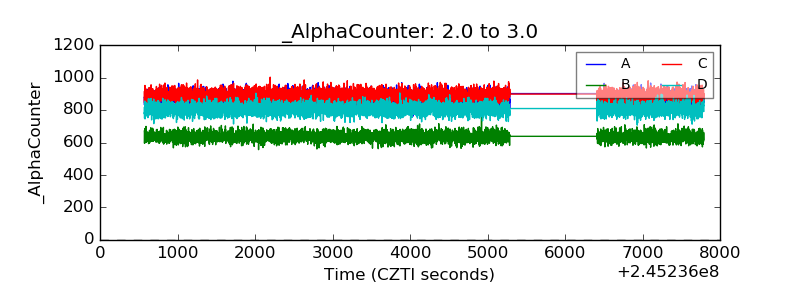 |
| _CPM_Rate | 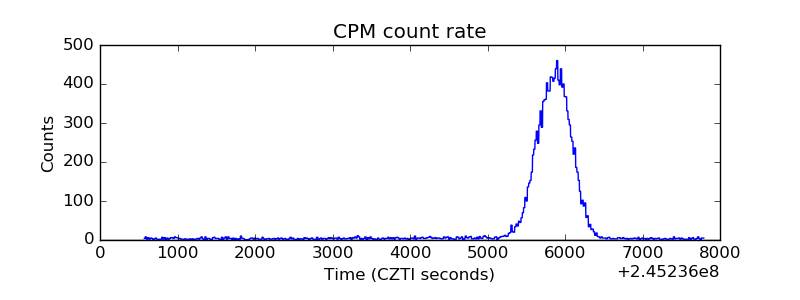 |
| CZT Counter | 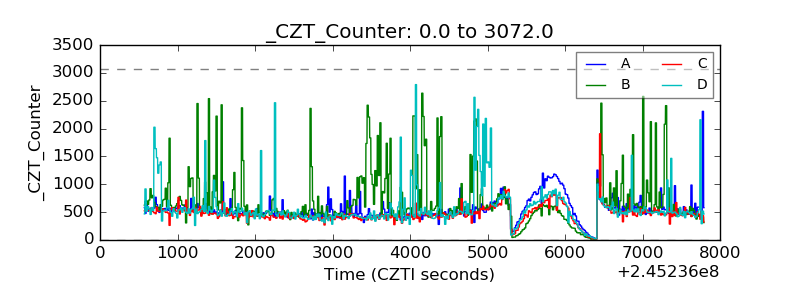 |
| +2.5 Volts monitor | 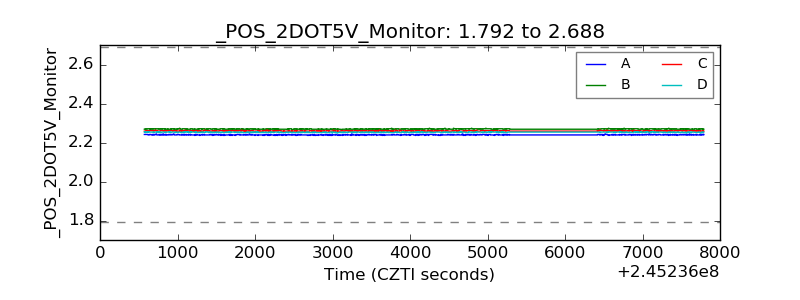 |
| +5 Volts monitor | 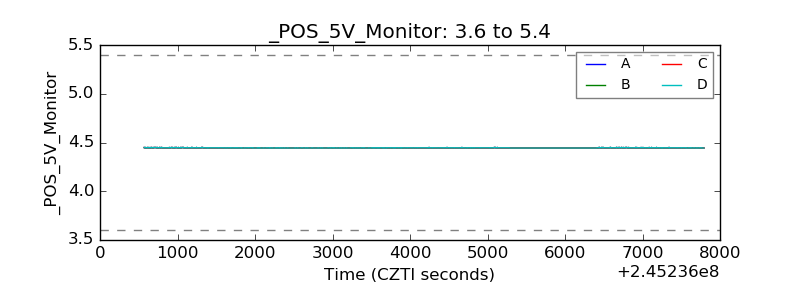 |
| _ROLL_ROT | 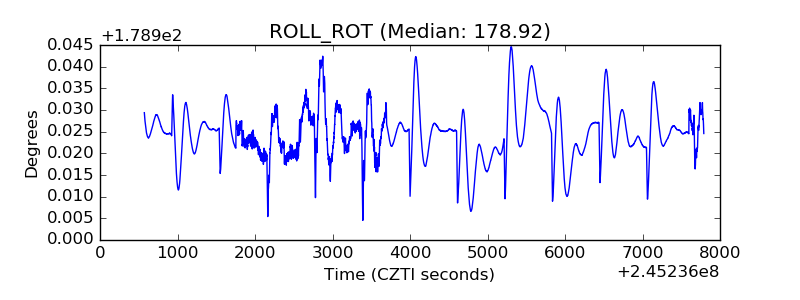 |
| _Roll_DEC | 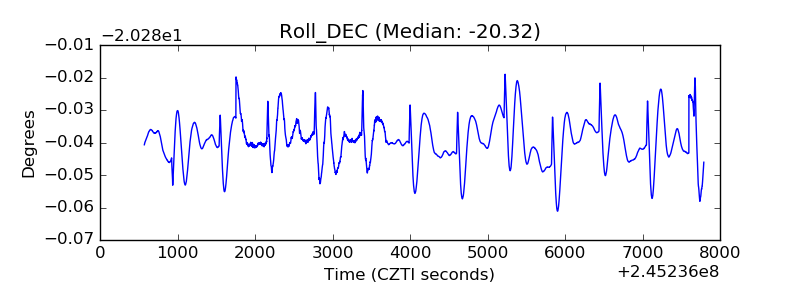 |
| _Roll_RA | 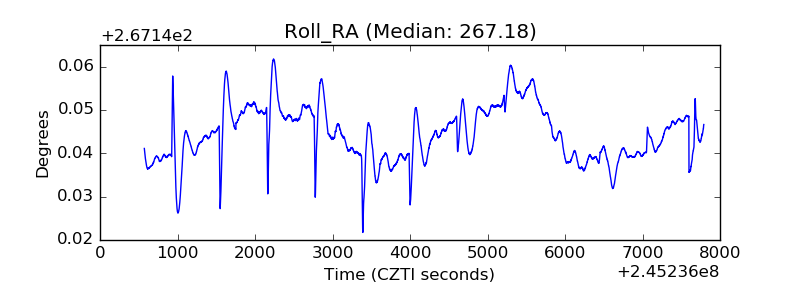 |
| Veto Counter | 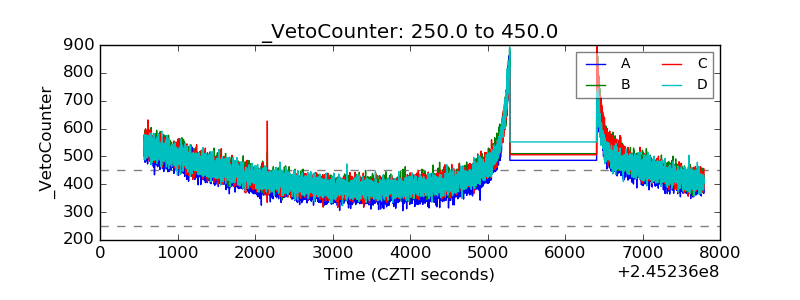 |